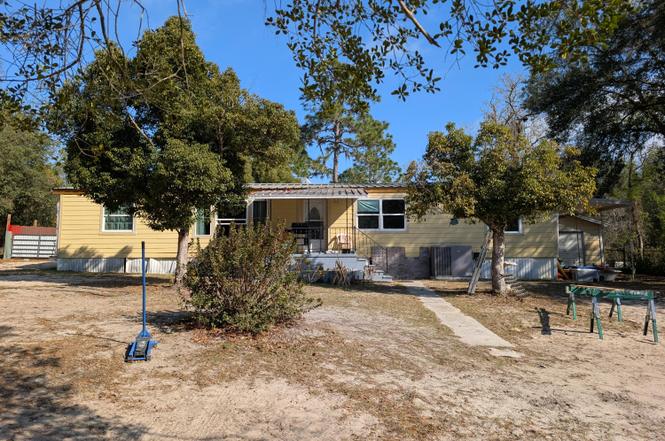
110 Silver Lake Dr · Hawthorne, FL
Flood risk 1/10 · Minimal
- FEMA flood zone
- X (unshaded)
- Chance of flooding over 30 yrs
- 0.0%
- Est. flood insurance / yr
- $507 – $1,088
Fire risk 6/10 · Moderate
- Est. fire insurance / yr
- $947 – $1,759
Heat risk 8/10 · Major
- Hot days now (above 109°F)
- 7 days/yr
- Hot days in 30 yrs
- 21 days/yr
Wind risk 9/10 · Severe
- Chance of severe wind over 30 yrs
- 99.0%
Air-quality risk 2/10 · Minimal
- Unhealthy air days now
- 2 days/yr
- Unhealthy air days in 30 yrs
- 2 days/yr
Risk factors via First Street. Map © Google.
Why this score? — see what drove the C- grade
The composite is a weighted blend of 9 inputs, each scored 0–100. Each bar is that input's sub-score; the figure is the points it added to the 100-point composite (weight × sub-score).
- Cash flow +20.7/30.0
- DSCR +6.6/10.0
- ARV discount +5.9/15.0
- 1% rule +5.2/10.0
- Livability +3.6/5.0
- Schools +3.0/10.0
- Rent growth +2.5/5.0
- Condition / age +2.5/5.0
- Appreciation +0.0/10.0
$147,500
🖨 Deal sheet 📄 Offer letter ✓ Due diligence
Listing remarks MLS
VERY NEAT AND CLEAN MOBILE HOME ON ONE ACRE NEAR SILVER LAKE. *THE REAL ESTATE SIGN IS PLACED IN THE APPROXIMATE LOCATION OF THIS PROPERTY. ONLY A SURVEY CAN DETERMINE THE EXACT LOCATION OF THIS PROPERTY.*
Key facts
- Renovated
- Metal roof
- Galley kitchen
Tags
Property features AI
Exterior
- Parking: 2-car garage; Additional off-street parking
- Utilities: Electricity connected; Water connected; Private sewer (septic tank)
- Home design: Double wide manufactured home; Property is attached
- Construction: Wood siding construction; Metal roof
- Exterior features: Covered front and rear porches; Screened porch; Patio/porch areas; Privacy and backyard fencing; Shed(s); Above-ground private pool; Cleared lot with few trees; Agricultural use allowed; County road frontage with dirt road surface
Interior
- Kitchen: Dishwasher; Electric oven; Electric range; Ice maker; Refrigerator; Electric water heater
- Bedrooms: 4 bedrooms
- Flooring: Laminate flooring; Vinyl flooring
- Bathrooms: 2 full bathrooms
- Heating & cooling: Central heating (electric); Central air conditioning (electric)
- Interior features: Ceiling fans; Primary bathroom with tub and separate shower; Split bedroom layout; Walk-in closet(s); 9 total rooms
- Laundry & utility: Laundry in unit
Neighborhood map
What this means for you Summary
Snapshot
- This is a 4-bed/2.0-bath manufactured listed at $148k.
Deal economics
- At list price, monthly cash flow is $201 ($2k/yr) — positive.
- The deal already cash-flows at list — no discount required.
- Meets the 1% rule at list price ($2k rent vs $148k).
- Recommended offer: $134k (9.0% below list) — sets the bar for market timing.
- Cap rate 7.9% vs local median 3.7% in Hawthorne — top-decile yield for the area; either an underpriced asset or a hidden risk that comps aren't pricing in. Stress-test before assuming the spread holds.
Location & tenants
- Location reads 71/100 on livability (#376 in FL) — a middle-class / working-renter tenant base. Strengths: crime A+, cost of living A+, health & safety A+; Watch: schools D, amenities F, commute F.
- Putnam (town): math 34% / reading 39% proficiency, ranked #66 of 73 in FL (top 90%) — families likely to look elsewhere, expect single-tenant / working-renter base with shorter leases; 71% free/reduced lunch — lower-income household profile, screen leases tightly.
- Market conditions: 299 active listings in the ZIP; 113 units permitted in Putnam County in 2024 (0 in 5+ unit buildings).
Forward outlook
- Local home prices are declining (-3.0%/yr); year-one equity from $1k of loan paydown is wiped out by about $4k of value loss. Plan a longer hold.
- Putnam County population projected at -31% by 2050 — secular population decline; favor cash flow + early exit over multi-decade hold.
Negotiation context
- It's been on market 115 days — a 9% lower offer ($134k) is reasonable based on typical stale-listing flexibility.
- 2 sale attempts since 22y ago with the ask held roughly flat each time — persistent listings suggest the price (not the market) is what's stuck; bring a comps-based counter.
- Current owner paid $20k; list at $148k implies a 620% gain — meaningful room to come down on a strong offer.
Risks & watch-outs
- Climate carrying-cost: severe wind risk, 99% chance of damaging wind over 30y; major wildfire risk; extreme-heat days projected 7→21/yr by 2055 (HVAC capex compounding) — expect insurance premiums to compound above CPI over the hold.
Questions for the listing agent
- It's been on market 115 days. Have you received any prior offers? Is the seller open to a 9% concession, seller financing, or rate buy-down credit?
- Built in 1975 — when were the roof, HVAC, electrical panel, plumbing, and water heater last replaced?
- Why hasn't it sold? Are there any deal-killer items the seller is aware of (foundation, flood, title, zoning, code violations)?
- Is there a deadline driving the sale (1031 exchange, divorce, estate, relocation)? That informs how much negotiation room exists.
- Schools are D-rated, which usually means shorter tenancies and higher turnover. Who's the typical renter profile here, and what's been the actual vacancy rate?
- What's the average days-on-market for RENTAL listings here right now (not sales)? A rising rental-DOM trend means longer vacancies and softer asking-rent achievability than the comps imply.
- What's the recent tenant-quality profile in this submarket — average credit score on applications, eviction rate, late-payment / NSF rate, and stable-employment percentage? A property-management company in the area should have these aggregated.
- How much new for-sale + rental construction is in the pipeline within 1–3 miles? Heavy new supply typically softens prices + rents 12–24 months out; constrained supply supports both.
Investment metrics
- 1% rule
- 1.02% ✓
- Cap rate
- 7.93%
- Cash-on-cash
- 5.83%
- DSCR
- 1.26
- GRM
- 8.2
CMA / ARV
- ARV (on-the-fly)
- $142,560
- Comps found
- 2
Show comp detail 2 sales within ~0.75 mi
| Address | Dist | Beds/Ba | Sqft | Sold | Price | $/sf | Match |
|---|---|---|---|---|---|---|---|
| 313 White Sands Beaches Dr | 0.38mi | 3/2.0 (-1) | 1,344 (-7%) | 5mo | $95,000 | $71 | 62 |
| 262 S County Road 21 | 0.40mi | 3/2.0 (-1) | 1,512 (+5%) | 13mo | $150,350 | $99 | 57 |
Match score weights: distance 35% · size 25% · config 20% · recency 20%. Top-matched comps best support the ARV.
Projected returns pro-forma
-3.0% appreciation · 3.0% rent growth · sell at horizon
- IRR
- -7.3%
- Equity multiple
- 0.73×
- Total profit
- $-11,111
- Equity at exit
- $21,993
- IRR
- 2.3%
- Equity multiple
- 1.16×
- Total profit
- $6,804
- Equity at exit
- $12,753
Cash invested: $41,300 (down + closing). Projections, not guarantees.
Landlord ↔ Tenant lean methodology
- Overall (STATE)
- 87 Strongly Landlord-Friendly
- State Florida
- 87 Strongly Landlord-Friendly · R+3
- County
- — inherits STATE
- City
- — inherits STATE
ZIP-level market 32640
- Home prices YoY
- -5.3%
- Active inventory
- 299
- Price-to-rent
- 8.2×
Monthly cashflow live
- Estimated rent
- $1,504 medium interval (Pro) →
- Mortgage (P&I)
- −$774
- Tax from tax record
- −$153 /mo · $1,831/yr
- Insurance
- −$61
- HOA
- −$0
- Vacancy / Maint / Mgmt
- −$316
- Net cashflow
- $201
Break-even live
UW: 25.0% down · 7.5% · 30yr · 1.5% tax · 5.0% vac · 8.0% maint · 8.0% mgmt
Financing live
Cash to close
- Down payment
- $36,875
- Closing costs
- $4,425
- Reserves months
- —
- Total cash needed
- —
Loan-product check · same deal, 3 products live
Conventional
25% down · 7.5% · 30yr
- Down + closing
- —
- Monthly P&I
- —
- Monthly cashflow
- —
- DSCR
- —
- Eligible?
- —
Personal DTI + credit; lowest rate.
DSCR
20% down · 8.5% · 30yr
- Down + closing
- —
- Monthly P&I
- —
- Monthly cashflow
- —
- DSCR
- —
- Eligible?
- —
No personal income docs; deal must DSCR.
Hard money
10% down · 12.0% · 12mo
- Down + closing
- —
- Monthly P&I
- —
- Monthly cashflow
- —
- DSCR
- —
- Eligible?
- —
Short-term bridge; refi at stabilization.
Listing history 17 events
-
2026-06-18days on market $147,500 Active 115 DOM
-
2026-06-17days on market $147,500 Active 114 DOM
-
2026-06-16days on market $147,500 Active 113 DOM
-
2026-06-15days on market $147,500 Active 112 DOM
-
2026-06-13days on market $147,500 Active 110 DOM
-
2026-06-10days on market $147,500 Active 106 DOM
-
2026-06-08days on market $147,500 Active 105 DOM
-
2026-06-07days on market $147,500 Active 104 DOM
-
2026-06-05days on market $147,500 Active 101 DOM
-
2026-06-03days on market $147,500 Active 100 DOM
-
2026-06-02days on market $147,500 Active 99 DOM
-
2026-06-01days on market $147,500 Active 98 DOM
-
2026-05-31days on market $147,500 Active 97 DOM
-
2026-02-23$147,500 Active
-
2004-12-01historical 205-char remark
Show marketing remark (205 chars)
VERY NEAT AND CLEAN MOBILE HOME ON ONE ACRE NEAR SILVER LAKE. *THE REAL ESTATE SIGN IS PLACED IN THE APPROXIMATE LOCATION OF THIS PROPERTY. ONLY A SURVEY CAN DETERMINE THE EXACT LOCATION OF THIS PROPERTY.*
-
2004-11-30soldstatus $20,500 205-char remark
Show marketing remark (205 chars)
VERY NEAT AND CLEAN MOBILE HOME ON ONE ACRE NEAR SILVER LAKE. *THE REAL ESTATE SIGN IS PLACED IN THE APPROXIMATE LOCATION OF THIS PROPERTY. ONLY A SURVEY CAN DETERMINE THE EXACT LOCATION OF THIS PROPERTY.*
-
2004-04-08$29,900 205-char remark
Show marketing remark (205 chars)
VERY NEAT AND CLEAN MOBILE HOME ON ONE ACRE NEAR SILVER LAKE. *THE REAL ESTATE SIGN IS PLACED IN THE APPROXIMATE LOCATION OF THIS PROPERTY. ONLY A SURVEY CAN DETERMINE THE EXACT LOCATION OF THIS PROPERTY.*
ⓘ Source: listings_history table (triggers on properties + properties_extension) + one-shot
backfill from property_details.listing_events for pre-trigger history.
Tax reassessment forecast FL · Resets to sale price
- Current annual tax
- $1,831 · $153/mo
- Projected year-2 tax
- $1,831 · $153/mo
- Expected delta
- $0/yr ($0/mo · 0.0%)
ⓘ Screening estimate from a state-policy table — verify with the county assessor before closing.
Climate risk First Street
- Flood 1/10 Low FEMA zone X (unshaded) · 0% chance over 30 yrs
- Wildfire 6/10 Major
- Heat 8/10 Severe 7 d/yr ≥109°F today · 21 d/yr by 30 yrs out
- Wind 9/10 Extreme 99% chance of damaging wind over 30 yrs
- Air quality 2/10 Low 2 unhealthy d/yr today · 2 by 30 yrs out
Nearby sold comps map
Loading sold comps map…
Walkable amenities ~0.75 mi
Loading nearby amenities…
Taxation est. · year 1
- Rental income
- $18,050
- − Mortgage interest
- −$8,262
- − Property taxes
- −$1,831
- − Insurance
- −$738
- − Repairs & maintenance
- −$1,444
- − Management
- −$1,444
- − Depreciation
- −$4,291
- Taxable income
- $41
- Est. tax owed @ 24.0%
- −$10
- After-tax cash flow
- $2,400/yr
For passive investors: Depreciation is non-cash, so a rental often shows a tax loss while cash-flowing — sheltering income. Rental losses are passive: they offset passive income freely, and up to $25,000/yr can offset ordinary (W-2) income if you actively participate and your MAGI is under $100k (phasing out to $0 by $150k); unused losses carry forward. On sale, claimed depreciation is recaptured at up to 25%, and gains may owe capital-gains tax (a 1031 exchange can defer both). Figures are a year-1 estimate at your 24.0% rate — not tax advice; consult a CPA.
Schools (NCES district)
- District
- Putnam
- NCES district ID
- 1201620
- Math proficiency
- 34% ▼ -10.00%
- Reading proficiency
- 39% ▼ -4.00%
- Median HH income
- $33,350
- Composite
- 29.99/100
- National rank
- #6361
- State rank
- #66 of 73 in FL
Livability — Hawthorne
- Score
- 71/100
- State rank
- #376
- US rank
- #6630
Category grades
Schools grade is shown separately in the Schools card above.
Census & demographics
- Population (ZIP)
- 10,780
Population outlook (Putnam County) Hauer SSP2
- Today (2025)
- 65,299 people
- By 2030
- 61,255 · -6.2%
- By 2040
- 52,930 · -18.9%
- By 2050
- 45,051 · -31.0%
- By 2075
- 28,720 · -56.0%
- By 2100
- 15,852 · -75.7%
Race, ethnicity, and origin ACS 2023
- Neighborhood character
- Predominantly White (69%)
- Race & ethnicity
- White 69% Black 24% Two or more races 4% Hispanic / Latino 4%
- Common ancestry
- Slovak 2% Lithuanian 2% Serbian 1%
- Foreign-born
- 3% · Canada
- Languages at home
- 98% English-only · Spanish 2%
Political lean MEDSL · Putnam
- 2024 margin
- Solid R (+47.8) · D 25.8% · R 73.6%
- 2008→2024 swing
- -28.5pp toward R · 2008: -19.3pp · 2024: -47.8pp
- All cycles
- 2024: R+47.8 2020: R+41.2 2016: R+36.6 2012: R+24.5 2008: R+19.3
Not yet ingested
- Civics
- —
Market trends
- HPI YoY
- ▼ -15.68%
- Current HPI
- 278.0079
- Rent YoY
- —
- Metro
- —
- State GDP YoY
- ▲ 3.28%
- F500 in state
- 36
Industry mix (Fortune 500 HQ in FL)
| Industry | F500 HQs | Revenue |
|---|---|---|
| Industrial Technology | 2 | $29B |
|
||
| Insurance | 2 | $17B |
|
||
| Retail | 1 | $60B |
|
||
| Technology Distribution | 1 | $58B |
|
||
| Homebuilding | 1 | $35B |
|
||
| Technology Manufacturing | 1 | $35B |
|
||
Price history
+393.3% since first listed4 events — show timeline
- 2026-02-23 Listed $147,500 realMLS
- 2004-12-01 Listing Removed — realMLS
- 2004-11-30 Sold (MLS) $20,500 realMLS
- 2004-04-08 Listed $29,900 realMLS
Property tax history
+6.3%/yrLatest (2025): $1,831 · -0.9% YoY. Source: county tax records.
Cash-flow waterfall
monthlySold comps — $/sqft
last 12 mo · ≤1 miLoading sold comps…