10 Lake Shore Rd · Franklin, NJ
Flood risk 1/10 · Minimal
- FEMA flood zone
- X (unshaded)
- Chance of flooding over 30 yrs
- 0.0%
- Est. flood insurance / yr
- $507 – $1,088
Fire risk 6/10 · Moderate
- Est. fire insurance / yr
- $526 – $976
Heat risk 3/10 · Minor
- Hot days now (above 95°F)
- 7 days/yr
- Hot days in 30 yrs
- 15 days/yr
Wind risk 4/10 · Minor
- Chance of severe wind over 30 yrs
- 17.0%
Air-quality risk 2/10 · Minimal
- Unhealthy air days now
- 1 days/yr
- Unhealthy air days in 30 yrs
- 2 days/yr
Risk factors via First Street. Map © Google.
Why this score? — see what drove the B- grade
The composite is a weighted blend of 9 inputs, each scored 0–100. Each bar is that input's sub-score; the figure is the points it added to the 100-point composite (weight × sub-score).
- Cash flow +25.5/30.0
- DSCR +8.5/10.0
- ARV discount +7.5/15.0
- 1% rule +7.3/10.0
- Appreciation +5.0/10.0
- Schools +3.9/10.0
- Livability +3.2/5.0
- Rent growth +2.5/5.0
- Condition / age +2.5/5.0
$325,000
🖨 Deal sheet (PDF) 📄 Offer letter ✓ Due diligence
Listing remarks
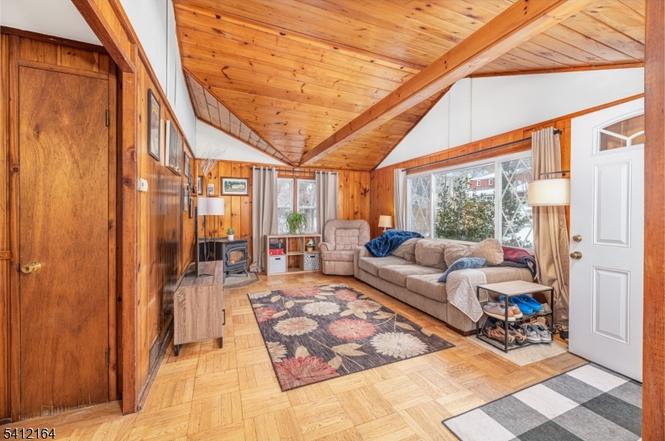
Price Reduction and septic work just done. This wonderfully charming Ranch sits right around the corner from Lake Tamarack! The living room has a unique high ceiling and a pellet stove making it warm and cozy. The basement is a walkout with high ceilings creating so much potential for finishing! Located 2 minutes from the park and ride to port authority in NYC. Enjoy fishing, canoeing, kayaking, and swimming and everything Sussex county has to offer. Property being sold as is at this price.
Key facts
- High ceiling
- Walkout basement
- Pellet stove
Tags
Property features AI
Finance
- HOA & community: Annual association fee; Association fee covers snow removal; Lake privileges; Pets allowed; Community living
Exterior
- Parking: 3 parking spaces
- Utilities: Electric service; Septic sewer; Association water
- Home design: Ranch style; Single-story entry; Approximate year built
- Construction: Vinyl siding; Asphalt shingle roof
- Exterior features: Deck; Blacktop driveway
Interior
- Kitchen: Eat-in kitchen; Separate dining area; Electric range/oven; Refrigerator
- Bedrooms: 2 bedrooms on the main level
- Flooring: Wood floors
- Bathrooms: 1 full bathroom
- Heating & cooling: Forced hot air heating; Wall A/C unit(s)
- Interior features: Carbon monoxide detector; Pellet stove fireplace
- Laundry & utility: Basement laundry room; Unfinished walkout basement
Neighborhood map
What this means for you Summary
Snapshot
- This is a 2-bed/1.0-bath single-family listed at $325k.
Deal economics
- At list price, monthly cash flow is $759 ($9k/yr) — positive.
- The deal already cash-flows at list — no discount required.
- Meets the 1% rule at list price ($4k rent vs $325k).
- Recommended offer: $306k (6.0% below list) — sets the bar for market timing.
Location & tenants
- Location reads 64/100 on livability (#410 in NJ) — a middle-class / working-renter tenant base. Strengths: crime A+, housing A+, employment A-; Watch: cost of living D+, health & safety D, amenities F.
- Wallkill Valley Regional High School (rural): math 27% / reading 50% proficiency, ranked #462 of 612 in NJ (top 76%) — families likely to look elsewhere, expect single-tenant / working-renter base with shorter leases.
- Market conditions: 1 active listings in the ZIP; 1 comparable units currently listed for rent nearby; 184 units permitted in Sussex County in 2024 (18 in 5+ unit buildings).
Forward outlook
- In year one you build about $12k of equity ($2k loan paydown + $10k appreciation (3.0% local appreciation)).
- Sussex County population projected at -25% by 2050 — secular population decline; favor cash flow + early exit over multi-decade hold.
- At projected returns (3.0% appreciation + 3.0% rent growth), your $91k cash investment doubles in ~4 years — after that, you're playing with house money.
- By year 4, paydown + projected appreciation supports a ~$41k cash-out refi (75% LTV) — recoverable capital for the next deal without selling this one.
Negotiation context
- It's been on market 67 days — a 6% lower offer ($306k) is reasonable based on typical stale-listing flexibility.
- 2 sale attempts; this cycle's ask has dropped $25k (7%) from the opening price — seller is motivated, your offer sets the floor, not the list.
- Current owner paid $129k; list at $325k implies a 152% gain — meaningful room to come down on a strong offer.
Risks & watch-outs
- Watch-outs: built in 1950 — expect roof / HVAC / electrical / plumbing capex.
- Climate carrying-cost: major wildfire risk — expect insurance premiums to compound above CPI over the hold.
Questions for the listing agent
- It's been on market 67 days. Have you received any prior offers? Is the seller open to a 6% concession, seller financing, or rate buy-down credit?
- Built in 1950 — when were the roof, HVAC, electrical panel, plumbing, and water heater last replaced?
- What does the HOA fee cover, when was the last increase, and are there any pending special assessments or reserve-fund shortfalls?
- Why hasn't it sold? Are there any deal-killer items the seller is aware of (foundation, flood, title, zoning, code violations)?
- Is there a deadline driving the sale (1031 exchange, divorce, estate, relocation)? That informs how much negotiation room exists.
- What's the average days-on-market for RENTAL listings here right now (not sales)? A rising rental-DOM trend means longer vacancies and softer asking-rent achievability than the comps imply.
- What's the recent tenant-quality profile in this submarket — average credit score on applications, eviction rate, late-payment / NSF rate, and stable-employment percentage? A property-management company in the area should have these aggregated.
- How much new for-sale + rental construction is in the pipeline within 1–3 miles? Heavy new supply typically softens prices + rents 12–24 months out; constrained supply supports both.
Investment metrics
- 1% rule
- 1.23% ✓
- Cap rate
- 9.09%
- Cash-on-cash
- 10.01%
- DSCR
- 1.45
- GRM
- 6.8
CMA / ARV
No comps found within radius.
Projected returns pro-forma
3.0% appreciation · 3.0% rent growth · sell at horizon
- IRR
- 16.9%
- Equity multiple
- 1.96×
- Total profit
- $87,637
- Equity at exit
- $146,134
- IRR
- 18.4%
- Equity multiple
- 3.69×
- Total profit
- $244,511
- Equity at exit
- $225,210
Cash invested: $91,000 (down + closing). Projections, not guarantees.
Landlord ↔ Tenant lean methodology
- Overall (STATE)
- 21 Tenant-Leaning
- State New Jersey
- 21 Tenant-Leaning · D+6
- County
- — inherits STATE
- City
- — inherits STATE
ZIP-level market 07460-1216
- Active inventory
- 1
- Price-to-rent
- 6.8×
Monthly cashflow live
- Estimated rent
- $4,000 medium interval (Pro) →
- Mortgage (P&I)
- −$1,704
- Tax from tax record
- −$509 /mo · $6,113/yr
- Insurance
- −$135
- HOA
- −$52
- Vacancy / Maint / Mgmt
- −$840
- Net cashflow
- $759
Break-even live
Sensitivity live
| Price | -10% $943 | -5% $851 | +0% $759 | +5% $667 | +10% $575 |
|---|---|---|---|---|---|
| Rent | -10% $443 | -5% $601 | +0% $759 | +5% $917 | +10% $1,075 |
| Rate | -1.0pp $923 | -0.5pp $841 | base $759 | +0.5pp $675 | +1.0pp $589 |
UW: 25.0% down · 7.5% · 30yr · 1.5% tax · 5.0% vac · 8.0% maint · 8.0% mgmt
Financing live
Cash to close
- Down payment
- $81,250
- Closing costs
- $9,750
- Reserves months
- —
- Total cash needed
- —
Loan-product check · same deal, 3 products live
Conventional
25% down · 7.5% · 30yr
- Down + closing
- —
- Monthly P&I
- —
- Monthly cashflow
- —
- DSCR
- —
- Eligible?
- —
Personal DTI + credit; lowest rate.
DSCR
20% down · 8.5% · 30yr
- Down + closing
- —
- Monthly P&I
- —
- Monthly cashflow
- —
- DSCR
- —
- Eligible?
- —
No personal income docs; deal must DSCR.
Hard money
10% down · 12.0% · 12mo
- Down + closing
- —
- Monthly P&I
- —
- Monthly cashflow
- —
- DSCR
- —
- Eligible?
- —
Short-term bridge; refi at stabilization.
Rent comps 1 comps
| Address | Beds | Baths | Sqft | Rent | $/sqft | DOM | Units | Dist |
|---|---|---|---|---|---|---|---|---|
| 232 W Shore Dr Hardyston, NJ | 2.0 | 1.0 | 930 | $4,000 | $4.30 | 0d | 1 | 0.59mi |
HOA detail
- Monthly dues
- $52 · $624/yr
Listing history 24 events
-
2026-06-21days on market $325,000 Active 67 DOM
-
2026-06-18days on market $325,000 Active 64 DOM
-
2026-06-17days on market $325,000 Active 63 DOM
-
2026-06-16days on market $325,000 Active 62 DOM
-
2026-06-15days on market $325,000 Active 61 DOM
-
2026-06-13days on market $325,000 Active 59 DOM
-
2026-06-13days on market $325,000 Active 58 DOM
-
2026-06-10remarks 498-char remark
-
2026-06-10price $325,000 Active 55 DOM
-
2026-06-09days on market $350,000 Active 55 DOM
-
2026-06-08days on market $350,000 Active 54 DOM
-
2026-06-07days on market $350,000 Active 53 DOM
-
2026-06-04days on market $350,000 Active 50 DOM
-
2026-06-03days on market $350,000 Active 49 DOM
-
2026-06-02days on market $350,000 Active 48 DOM
-
2026-06-01days on market $350,000 Active 47 DOM
-
2026-05-31days on market $350,000 Active 46 DOM
-
2026-05-15status Active
-
2026-05-15historical Under Contract Cont. to Show
-
2026-03-20status Under Contract
-
2026-02-18$350,000 Active
-
2001-04-24soldstatus $129,000
-
1987-11-17soldstatus $155,000
-
1979-06-01soldstatus $62,000
ⓘ Source: listings_history table (triggers on properties + properties_extension) + one-shot
backfill from property_details.listing_events for pre-trigger history.
Tax reassessment forecast NJ · Partial reset (capped growth)
- Current annual tax
- $6,113 · $509/mo
- Projected year-2 tax
- $7,103 · $592/mo
- Expected delta
- +$990/yr (+$82/mo · 16.2%)
ⓘ Screening estimate from a state-policy table — verify with the county assessor before closing.
Climate risk First Street
- Flood 1/10 Low FEMA zone X (unshaded) · 0% chance over 30 yrs
- Wildfire 6/10 Major
- Heat 3/10 Moderate 7 d/yr ≥95°F today · 15 d/yr by 30 yrs out
- Wind 4/10 Moderate 17% chance of damaging wind over 30 yrs
- Air quality 2/10 Low 1 unhealthy d/yr today · 2 by 30 yrs out
Nearby sold comps map
Loading sold comps map…
Walkable amenities ~0.75 mi
Loading nearby amenities…
Taxation est. · year 1
- Rental income
- $48,000
- − Mortgage interest
- −$18,205
- − Property taxes
- −$6,113
- − Insurance
- −$1,625
- − Repairs & maintenance
- −$3,840
- − Management
- −$3,840
- − HOA
- −$624
- − Depreciation
- −$9,455
- Taxable income
- $4,298
- Est. tax owed @ 24.0%
- −$1,032
- After-tax cash flow
- $8,074/yr
For passive investors: Depreciation is non-cash, so a rental often shows a tax loss while cash-flowing — sheltering income. Rental losses are passive: they offset passive income freely, and up to $25,000/yr can offset ordinary (W-2) income if you actively participate and your MAGI is under $100k (phasing out to $0 by $150k); unused losses carry forward. On sale, claimed depreciation is recaptured at up to 25%, and gains may owe capital-gains tax (a 1031 exchange can defer both). Figures are a year-1 estimate at your 24.0% rate — not tax advice; consult a CPA.
Schools (NCES district)
- District
- Wallkill Valley Regional High School
- NCES district ID
- 3416870
- Math proficiency
- 27% ▲ 9.00%
- Reading proficiency
- 50% ▲ 10.00%
- Median HH income
- $88,530
- Composite
- 39.37/100
- National rank
- #8148
- State rank
- #462 of 612 in NJ
Livability — Franklin
- Score
- 64/100
- State rank
- #410
- US rank
- #14317
Category grades
Schools grade is shown separately in the Schools card above.
Census & demographics
No demographic data for this ZIP.
Market trends
- HPI YoY
- —
- Current HPI
- —
- Rent YoY
- —
- Metro
- —
- State GDP YoY
- ▲ 2.05%
- F500 in state
- 34
Industry mix (Fortune 500 HQ in NJ)
| Industry | F500 HQs | Revenue |
|---|---|---|
| Consumer Goods | 3 | $31B |
|
||
| Pharmaceuticals | 2 | $153B |
|
||
| Technology | 2 | $21B |
|
||
| Insurance | 2 | $20B |
|
||
| Healthcare | 2 | $19B |
|
||
| Financial Services | 1 | $70B |
|
||
Price history
+464.5% since first listed7 events — show timeline
- 2026-05-15 Relisted — GSMLS
- 2026-05-15 Contingent — GSMLS
- 2026-03-20 Pending — GSMLS
- 2026-02-18 Listed $350,000 GSMLS
- 2001-04-24 Sold (Public Records) $129,000 Public Records
- 1987-11-17 Sold (Public Records) $155,000 Public Records
- 1979-06-01 Sold (Public Records) $62,000 Public Records
Property tax history
+2.4%/yrLatest (2025): $6,113 · +8.8% YoY. Source: county tax records.
Cash-flow waterfall
monthlySold comps — $/sqft
last 12 mo · ≤1 miLoading sold comps…