 🏗️ New Construction
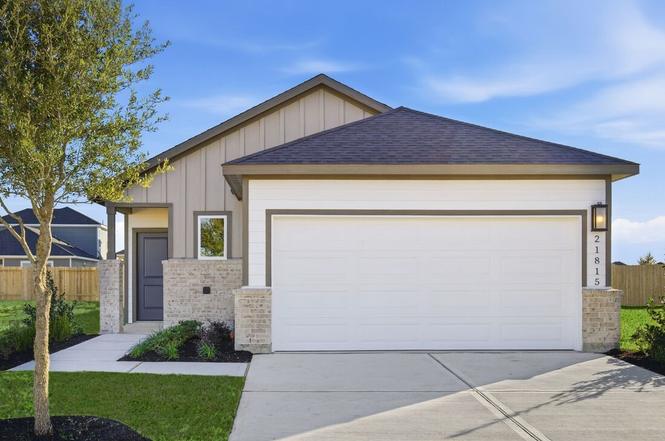
21815 Coral Mist Dr · Houston, TX
Flood risk 4/10 · Minor
- FEMA flood zone
- X (unshaded)
- Chance of flooding over 30 yrs
- 0.2%
- Est. flood insurance / yr
- $507 – $1,088
Fire risk 4/10 · Minor
- Est. fire insurance / yr
- $1,222 – $2,270
Heat risk 9/10 · Severe
- Hot days now (above 110°F)
- 7 days/yr
- Hot days in 30 yrs
- 22 days/yr
Wind risk 9/10 · Severe
- Chance of severe wind over 30 yrs
- 99.0%
Air-quality risk 2/10 · Minimal
- Unhealthy air days now
- 2 days/yr
- Unhealthy air days in 30 yrs
- 2 days/yr
Risk factors via First Street. Map © Google.
Why this score? — see what drove the D- grade
The composite is a weighted blend of 9 inputs, each scored 0–100. Each bar is that input's sub-score; the figure is the points it added to the 100-point composite (weight × sub-score).
- Cash flow +10.0/30.0
- ARV discount +7.5/15.0
- Schools +4.4/10.0
- Livability +3.7/5.0
- 1% rule +3.3/10.0
- DSCR +2.9/10.0
- Condition / age +2.5/5.0
- Rent growth +2.2/5.0
- Appreciation +0.0/10.0
$309,138
🖨 Deal sheet 📄 Offer letter ✓ Due diligence
Listing remarks
New Construction - Ready Now! Built by Taylor Morrison, America's Most Trusted Homebuilder. Welcome to the Dylan at 21815 Coral Mist Drive in Mason Woods. This charming single-story home features four spacious bedrooms and a bright, open layout that seamlessly connects the dining area, great room, and kitchen with a central island. Step outside to enjoy a large, covered patio! The generous primary suite offers a peaceful retreat, as well. Located in Mason Woods 40s, this thoughtfully designed community offers unique floor plans that blend style and flexibility. These low-maintenance homes showcase clean lines, open-concept living, and natural light, creating a space that feels both luxuriou
Key facts
- Unique floor plans
- Open layout
- Large covered patio
Tags
Property features AI
Finance
- HOA & community: Community association managed by Crest Management; Annual association fee; Association amenities include fitness center, playground, pool, and trails; Association fee covers common areas; Curbs in the community
Exterior
- Parking: Attached 2-car garage
- Security: Prewired for security
- Utilities: Public water
- Home design: Residential property; New construction (2025); Faces north; Slab foundation
- Construction: Brick construction; Composition roof; Built in 2025
- Exterior features: Covered patio; Porch; Deck; Patio; Fence (partial); Sprinkler/irrigation; Cul-de-sac lot; Subdivision setting
Interior
- Kitchen: Dishwasher; Electric oven; Gas cooktop; Microwave; Disposal; Oven; Kitchen island; Pantry; Granite counters
- Bedrooms: Primary bedroom on the first floor; Additional bedrooms on the first floor
- Flooring: Carpet; Plank; Vinyl
- Bathrooms: 2 full bathrooms; Primary bathroom on the first floor
- Heating & cooling: Central heating (gas); Central air (electric); Programmable thermostat
- Interior features: Double vanity; Granite counters; Kitchen island; Kitchen/family room combo; Pantry; Tub/shower; Kitchen/dining combo; Living/dining room; Programmable thermostat
- Laundry & utility: Washer hookup; Electric dryer hookup; Tankless water heater
Neighborhood map
What this means for you Summary
Snapshot
- This is a 4-bed/2.0-bath single-family listed at $309k.
Deal economics
- At list price, monthly cash flow is $-190 ($-2k/yr) — negative.
- To cash-flow at today's rent, offer at most $291k (5.9% below list).
- To meet the 1% rule (rent ≥ 1% of price), the offer needs to be $263k (14.8% below list).
- Recommended offer: $263k (14.8% below list) — sets the bar for 1% rule.
- Cap rate 5.6% vs local median 3.2% in Houston — top-decile yield for the area; either an underpriced asset or a hidden risk that comps aren't pricing in. Stress-test before assuming the spread holds.
Location & tenants
- Location reads 74/100 on livability (#184 in TX, #4,771 nationally) — a middle-class / working-renter tenant base. Strengths: amenities A+, cost of living A+, housing A+; Watch: crime F.
- Cypress-Fairbanks ISD (suburban): math 45% / reading 52% proficiency, ranked #161 of 826 in TX (top 20%) — families likely to look elsewhere, expect single-tenant / working-renter base with shorter leases.
- Zoned schools: Rowe Middle (math 26% / reading 44%, grade F, #842 of 1,662 statewide, top 51%, 1,310 students, 80% FRL); Cypress Park H S (math 41% / reading 49%, grade D-, #643 of 1,632 statewide, top 40%, 2,960 students, 75% FRL) — zoned schools average 78% FRL vs 43% district-wide (35 pts higher); higher-poverty schools than district average — tighter screening recommended.
- Market conditions: Rents soft (-1.3%/yr); 2034 active listings in the ZIP; 17 comparable units currently listed for rent nearby; rentals lingering (median 44d on market — plan ~5-8 weeks vacancy on turnover, expect pricing pressure); 76% of comp listings sitting > 30 days — soft ceiling on asking rent; high-income renter base; 29,883 units permitted in Harris County in 2024 (8,621 in 5+ unit buildings).
Forward outlook
- Local home prices are declining (-3.0%/yr); year-one equity from $2k of loan paydown is wiped out by about $10k of value loss. Plan a longer hold.
- Harris County population projected at +47% by 2050 — long-run rental-demand tailwind backs the buy-and-hold thesis.
Negotiation context
- It's been on market 114 days — a 9% lower offer ($281k) is reasonable based on typical stale-listing flexibility.
- 3 sale attempts with the ask held roughly flat each time — persistent listings suggest the price (not the market) is what's stuck; bring a comps-based counter.
Risks & watch-outs
- Climate carrying-cost: severe wind risk, 99% chance of damaging wind over 30y; extreme-heat days projected 7→22/yr by 2055 (HVAC capex compounding) — expect insurance premiums to compound above CPI over the hold.
Questions for the listing agent
- What do current leases actually rent for vs. the listed asking? Can we see a recent rent roll and the last 12 months of T-12 income?
- It's been on market 114 days. Have you received any prior offers? Is the seller open to a 15% concession, seller financing, or rate buy-down credit?
- What does the HOA fee cover, when was the last increase, and are there any pending special assessments or reserve-fund shortfalls?
- Why hasn't it sold? Are there any deal-killer items the seller is aware of (foundation, flood, title, zoning, code violations)?
- Is there a deadline driving the sale (1031 exchange, divorce, estate, relocation)? That informs how much negotiation room exists.
- Schools are D-rated, which usually means shorter tenancies and higher turnover. Who's the typical renter profile here, and what's been the actual vacancy rate?
- Crime grade is F in this area — have there been break-ins, vandalism, or insurance claims at this property in the last 3 years? What carrier currently insures it and at what premium?
- The area grade is low — what's the realistic commute time and amenity access for the typical tenant pool here? Any planned neighborhood developments (good or bad) we should know about?
- What's the average days-on-market for RENTAL listings here right now (not sales)? A rising rental-DOM trend means longer vacancies and softer asking-rent achievability than the comps imply.
- What's the recent tenant-quality profile in this submarket — average credit score on applications, eviction rate, late-payment / NSF rate, and stable-employment percentage? A property-management company in the area should have these aggregated.
- How much new for-sale + rental construction is in the pipeline within 1–3 miles? Heavy new supply typically softens prices + rents 12–24 months out; constrained supply supports both.
Investment metrics
- 1% rule
- 0.83% ✗
- Cap rate
- 5.58%
- Cash-on-cash
- -2.55%
- DSCR
- 0.89
- GRM
- 10.1
CMA / ARV
- ARV (on-the-fly)
- $318,250
- Comps found
- 12
Show comp detail 12 sales within ~0.75 mi
| Address | Dist | Beds/Ba | Sqft | Sold | Price | $/sf | Match |
|---|---|---|---|---|---|---|---|
| 21815 Coral Mist Dr | 0.00mi | 4/2.0 | 1,675 (0%) | 1mo | $309,138 | $185 | 99 |
| 8102 Magnolia Prairie Ln | 0.06mi | 4/2.0 | 1,675 (0%) | 1mo | $324,890 | $194 | 96 |
| 8122 Kay Harbor Dr | 0.12mi | 4/2.0 | 1,744 (+4%) | 0mo | $346,990 | $199 | 87 |
| 8218 Blue Shell Ln | 0.16mi | 3/2.0 (-1) | 1,673 (-0%) | 1mo | $340,990 | $204 | 87 |
| 8214 Blue Shell Ln | 0.15mi | 4/2.0 | 1,756 (+5%) | 0mo | $324,990 | $185 | 84 |
| 21822 Black Tulip Ln | 0.14mi | 3/2.0 (-1) | 1,631 (-3%) | 1mo | $309,605 | $190 | 84 |
| 21807 Honey Scent Ln | 0.11mi | 4/2.0 | 1,840 (+10%) | 1mo | $334,935 | $182 | 78 |
| 7919 Sunny Lily Loop | 0.38mi | 3/2.0 (-1) | 1,622 (-3%) | 1mo | $319,925 | $197 | 71 |
| 7811 Summer Solstice St | 0.44mi | 3/2.0 (-1) | 1,612 (-4%) | 1mo | $331,190 | $205 | 67 |
| 7846 Summer Solstice St | 0.35mi | 4/2.0 | 1,850 (+10%) | 0mo | $337,290 | $182 | 66 |
| 7530 Primrose Myrtle Ln | 0.64mi | 4/2.5 | 1,825 (+9%) | 1mo | $312,845 | $171 | 52 |
| 21815 White Bellflower Ln | 0.53mi | 3/2.0 (-1) | 1,479 (-12%) | 1mo | $275,000 | $186 | 50 |
Match score weights: distance 35% · size 25% · config 20% · recency 20%. Top-matched comps best support the ARV.
Projected returns pro-forma
-3.0% appreciation · 0.0% rent growth · sell at horizon
- IRR
- -24.0%
- Equity multiple
- 0.20×
- Total profit
- $-71,285
- Equity at exit
- $47,452
- IRR
- -31.4%
- Equity multiple
- -0.20×
- Total profit
- $-107,120
- Equity at exit
- $27,516
Cash invested: $89,110 (down + closing). Projections, not guarantees.
Landlord ↔ Tenant lean methodology
- Overall (STATE)
- 87 Strongly Landlord-Friendly
- State Texas
- 87 Strongly Landlord-Friendly · R+5
- County
- — inherits STATE
- City
- — inherits STATE
ZIP-level market 77433
- Home prices YoY
- -28.5%
- Rents YoY
- -1.3%
- Active inventory
- 2034
- Price-to-rent
- 9.8×
Monthly cashflow live
- Estimated rent
- $2,634 high interval (Pro) →
- Mortgage (P&I)
- −$1,669
- Tax est. 1.5%
- −$398 /mo · $4,774/yr
- Insurance
- −$133
- HOA
- −$71
- Vacancy / Maint / Mgmt
- −$553
- Net cashflow
- $-190
Break-even live
UW: 25.0% down · 7.5% · 30yr · 1.5% tax · 5.0% vac · 8.0% maint · 8.0% mgmt
Financing live
Cash to close
- Down payment
- $79,562
- Closing costs
- $9,548
- Reserves months
- —
- Total cash needed
- —
Loan-product check · same deal, 3 products live
Conventional
25% down · 7.5% · 30yr
- Down + closing
- —
- Monthly P&I
- —
- Monthly cashflow
- —
- DSCR
- —
- Eligible?
- —
Personal DTI + credit; lowest rate.
DSCR
20% down · 8.5% · 30yr
- Down + closing
- —
- Monthly P&I
- —
- Monthly cashflow
- —
- DSCR
- —
- Eligible?
- —
No personal income docs; deal must DSCR.
Hard money
10% down · 12.0% · 12mo
- Down + closing
- —
- Monthly P&I
- —
- Monthly cashflow
- —
- DSCR
- —
- Eligible?
- —
Short-term bridge; refi at stabilization.
Rent comps 17 comps
| Address | Beds | Baths | Sqft | Rent | $/sqft | DOM | Units | Dist |
|---|---|---|---|---|---|---|---|---|
| 7911 Tuscan Cypress Dr Cypress, TX | 4.0 | 3.0 | 1730 | $2,475 | $1.43 | 43d | 1 | 0.53mi |
| 7558 Magnolia Orchid Ln Cypress, TX | 4.0 | 2.5 | 1743 | $2,390 | $1.37 | 43d | 1 | 0.65mi |
| 7546 Coral Terrace Dr Cypress, TX | 3.0 | 2.5 | 2050 | $2,699 | $1.32 | 43d | 1 | 0.84mi |
| 21114 Montego Bay Dr Cypress, TX | 3.0 | 2.5 | 2124 | $2,499 | $1.18 | 43d | 1 | 0.92mi |
| 22025 Avalon Landing Ln Cypress, TX | 1.0–3.0 | 1.0–2.0 | 954 | $2,663 | $2.79 | 2d | 12 | 0.97mi |
| 21054 Montego Breeze Ln Cypress, TX | 3.0–5.0 | 2.0–3.5 | 1935 | $2,622 | $1.35 | 12d | 21 | 0.98mi |
| 21038 Treasure Gate Ln Cypress, TX | 4.0 | 2.5 | 1804 | $2,676 | $1.48 | 43d | 1 | 1.03mi |
| 21235 Catalina Palm Dr Cypress, TX | 4.0 | 2.0 | 1756 | $2,600 | $1.48 | 43d | 1 | 1.06mi |
| 21010 Treasure Gate Ln Cypress, TX | 4.0 | 2.0 | 2157 | $2,768 | $1.28 | 43d | 1 | 1.09mi |
| 21031 Sandestin Ridge Dr Cypress, TX | 5.0 | 3.5 | 2099 | $2,861 | $1.36 | 43d | 1 | 1.16mi |
| 21034 Shore Oak Dr Cypress, TX | 4.0 | 3.0 | 2110 | $2,950 | $1.40 | 43d | 1 | 1.19mi |
| 21038 Bay Village Dr Cypress, TX | 4.0 | 2.5 | 1904 | $2,491 | $1.31 | 43d | 1 | 1.23mi |
| 21447 FM 529 Rd Cypress, TX | 1.0–3.0 | 1.0–2.0 | 996 | $2,205 | $2.21 | 3d | 26 | 1.24mi |
| 21815 Sunshine Cove Ln Cypress, TX | 3.0 | 2.0 | 1780 | $2,650 | $1.49 | 43d | 1 | 1.25mi |
| 21054 Breezeway Cove Dr Bridgeland, TX | 3.0–4.0 | 2.5–3.5 | 1784 | $3,258 | $1.83 | 3d | 41 | 1.32mi |
| 7310 Coconut Bay Dr Cypress, TX | 4.0 | 2.0 | 1620 | $2,307 | $1.42 | 43d | 1 | 1.32mi |
| 20519 Keegans Ledge Ln Cypress, TX | 4.0 | 3.0 | 1907 | $2,100 | $1.10 | 43d | 1 | 1.50mi |
HOA detail
- Monthly dues
- $71 · $852/yr
Listing history 10 events
-
2026-04-17status Pending
-
2026-04-10price $309,138
-
2026-04-07status Active
-
2026-04-07price $319,138
-
2026-02-24status Pending
-
2026-01-23price $307,890
-
2025-12-29price $314,890
-
2025-11-11$315,890 Active
-
2025-11-11historical
-
2025-08-07$315,890 Active
ⓘ Source: listings_history table (triggers on properties + properties_extension) + one-shot
backfill from property_details.listing_events for pre-trigger history.
Climate risk First Street
- Flood 4/10 Moderate FEMA zone X (unshaded) · 20% chance over 30 yrs
- Wildfire 4/10 Moderate
- Heat 9/10 Extreme 7 d/yr ≥110°F today · 22 d/yr by 30 yrs out
- Wind 9/10 Extreme 99% chance of damaging wind over 30 yrs
- Air quality 2/10 Low 2 unhealthy d/yr today · 2 by 30 yrs out
Nearby sold comps map
Loading sold comps map…
Walkable amenities ~0.75 mi
Loading nearby amenities…
Taxation est. · year 1
- Rental income
- $31,605
- − Mortgage interest
- −$17,827
- − Property taxes
- −$4,774
- − Insurance
- −$1,591
- − Repairs & maintenance
- −$2,528
- − Management
- −$2,528
- − HOA
- −$852
- − Depreciation
- −$9,258
- Taxable loss
- −$7,754
- Est. tax savings @ 24.0%
- +$1,861
- After-tax cash flow
- $-415/yr
For passive investors: Depreciation is non-cash, so a rental often shows a tax loss while cash-flowing — sheltering income. Rental losses are passive: they offset passive income freely, and up to $25,000/yr can offset ordinary (W-2) income if you actively participate and your MAGI is under $100k (phasing out to $0 by $150k); unused losses carry forward. On sale, claimed depreciation is recaptured at up to 25%, and gains may owe capital-gains tax (a 1031 exchange can defer both). Figures are a year-1 estimate at your 24.0% rate — not tax advice; consult a CPA.
Schools (NCES district)
- District
- Cypress-Fairbanks ISD
- NCES district ID
- 4816110
- Math proficiency
- 45% ▼ -12.00%
- Reading proficiency
- 52% ▼ -2.00%
- Median HH income
- $72,025
- Composite
- 43.63/100
- National rank
- #2968
- State rank
- #161 of 826 in TX
Livability — Houston
- Score
- 74/100
- State rank
- #184
- US rank
- #4771
Category grades
Schools grade is shown separately in the Schools card above.
Census & demographics
- County
- Harris County · 4,702,590 people
- City population
- 3,226,434
- Metro
- Houston-The Woodlands-Sugar Land, TX
- Population (ZIP)
- 116,550
- Household income
- $143,934
- Rent vs Own
- Severe rent burden
- 1700.0
Population outlook (Harris County) Hauer SSP2
- Today (2025)
- 5,571,493 people
- By 2030
- 6,089,821 · +9.3%
- By 2040
- 7,142,806 · +28.2%
- By 2050
- 8,185,864 · +46.9%
- By 2075
- 10,574,329 · +89.8%
- By 2100
- 12,109,958 · +117.4%
Race, ethnicity, and origin ACS 2023
- Neighborhood character
- Highly diverse neighborhood (Simpson 0.73)
- Race & ethnicity
- White 39% Hispanic / Latino 27% Black 17% Two or more races 14% Asian 13%
- Hispanic origin (detail)
- Mexican 16%
- Common ancestry
- Lithuanian 2% Romanian 1% Italian 1%
- Foreign-born
- 21% · Canada, Vietnam, China
- Languages at home
- 66% English-only · Spanish 19% Other Indo-European 4% Vietnamese 4%
Political lean MEDSL · Harris
- 2024 margin
- Lean D (+5.5) · D 52.0% · R 46.4% · Other 1.6%
- 2008→2024 swing
- +3.9pp toward D · 2008: 1.6pp · 2024: 5.5pp
- All cycles
- 2024: D+5.5 2020: D+13.3 2016: D+12.4 2012: D+0.1 2008: D+1.6
Not yet ingested
- Civics
- —
Market trends
- HPI YoY
- ▼ -87.83%
- Current HPI
- 220.2136
- Rent YoY
- ▼ -1.27%
- Metro
- Houston-The Woodlands-Sugar Land, TX
- State GDP YoY
- ▲ 3.95%
- F500 in state
- 110
Industry mix (Fortune 500 HQ in TX)
| Industry | F500 HQs | Revenue |
|---|---|---|
| Energy | 16 | $1,198B |
|
||
| Technology | 5 | $198B |
|
||
| Engineering / Construction | 4 | $72B |
|
||
| Energy Services | 3 | $60B |
|
||
| Utilities | 3 | $41B |
|
||
| Healthcare | 2 | $330B |
|
||
Price history
-2.1% since first listed10 events — show timeline
- 2026-04-17 Pending — HARMLS
- 2026-04-10 Price Changed $309,138 HARMLS
- 2026-04-07 Relisted — HARMLS
- 2026-04-07 Price Changed $319,138 HARMLS
- 2026-02-24 Pending — HARMLS
- 2026-01-23 Price Changed $307,890 HARMLS
- 2025-12-29 Price Changed $314,890 HARMLS
- 2025-11-11 Listing Removed — HARMLS
- 2025-11-11 Listed $315,890 HARMLS
- 2025-08-07 Listed $315,890 HARMLS
Cash-flow waterfall
monthlySold comps — $/sqft
last 12 mo · ≤1 miLoading sold comps…