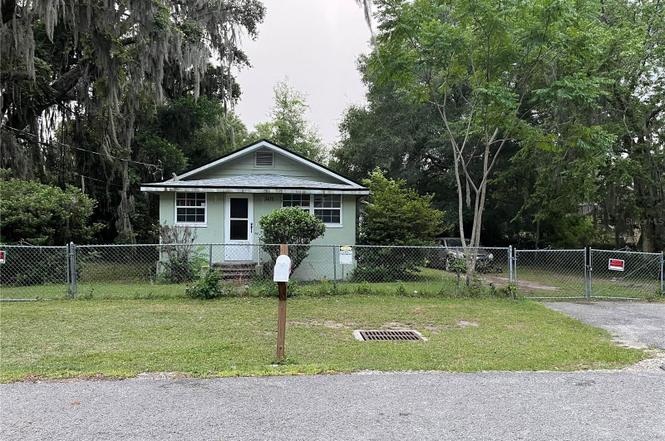
2432 SW 1st St · Ocala, FL
Flood risk 1/10 · Minimal
- FEMA flood zone
- X (unshaded)
- Chance of flooding over 30 yrs
- 0.0%
- Est. flood insurance / yr
- $507 – $1,088
Fire risk 2/10 · Minimal
- Est. fire insurance / yr
- $947 – $1,759
Heat risk 8/10 · Major
- Hot days now (above 107°F)
- 7 days/yr
- Hot days in 30 yrs
- 21 days/yr
Wind risk 9/10 · Severe
- Chance of severe wind over 30 yrs
- 99.0%
Air-quality risk 3/10 · Minor
- Unhealthy air days now
- 3 days/yr
- Unhealthy air days in 30 yrs
- 3 days/yr
Risk factors via First Street. Map © Google.
Why this score? — see what drove the C- grade
The composite is a weighted blend of 9 inputs, each scored 0–100. Each bar is that input's sub-score; the figure is the points it added to the 100-point composite (weight × sub-score).
- Cash flow +17.8/30.0
- ARV discount +11.1/15.0
- DSCR +5.6/10.0
- 1% rule +4.1/10.0
- Schools +3.6/10.0
- Livability +3.5/5.0
- Rent growth +2.5/5.0
- Condition / age +2.5/5.0
- Appreciation +0.0/10.0
$141,000
🖨 Deal sheet 📄 Offer letter ✓ Due diligence
Listing remarks MLS
Come check out this 3/1 near the Ocala Historic District. This is the last house located on a dead end street. 1950's Florida cottage style home in need of someone to love it back to its glory! Chain link fenced yard with c \ drive through gates on both sides. Shed in back yard for extra storage. Large open living room / dining room area with large kitchen. In-side laundry. Enjoy you time in the large backyard or in your glass enclosed front porch.
Key facts
- Brand new roof
- Updating bathroom
- Private
Tags
Property features AI
Finance
- Other: Property type: Residential — Single Family Residence; Zoning: RO; Not in a development; Furnished: Negotiable
- Financial info: No investor or income/expense details provided
- HOA & community: No association; Pets allowed (maximum pet weight 50 lbs)
Exterior
- Parking: No parking details provided
- Security: No security details provided
- Utilities: Public water; Public sewer; Electricity connected; Water connected
- Home design: Single family residence; One story; North-facing
- Construction: Frame construction; Shingle roof; Pillar/post/pier foundation; Completed condition; Built on a lot of approximately 0.18 acres
- Exterior features: Private mailbox; Asphalt road access
Interior
- Kitchen: Range; Range hood; Microwave; Refrigerator; Exhaust fan; Electric water heater
- Bedrooms: Three bedrooms
- Flooring: Carpet; Linoleum
- Bathrooms: One full bathroom
- Heating & cooling: Central heating (electric); Central air conditioning
- Interior features: Open floorplan with living room/dining room combo; Split bedroom layout; Thermostat; Non-wood burning fireplace
- Laundry & utility: Laundry area inside the home, located in the kitchen
Neighborhood map
What this means for you Summary
Snapshot
- This is a 3-bed/1.0-bath single-family listed at $141k.
Deal economics
- At list price, monthly cash flow is $116 ($1k/yr) — positive.
- The deal already cash-flows at list — no discount required.
- To meet the 1% rule (rent ≥ 1% of price), the offer needs to be $129k (8.5% below list).
- Recommended offer: $129k (8.5% below list) — sets the bar for 1% rule.
- Cap rate 7.3% vs local median 4.2% in Ocala — top-decile yield for the area; either an underpriced asset or a hidden risk that comps aren't pricing in. Stress-test before assuming the spread holds.
Location & tenants
- Location reads 69/100 on livability (#476 in FL) — a middle-class / working-renter tenant base. Strengths: cost of living A+, housing A+, health & safety A+; Watch: crime F, amenities F, commute F.
- Marion (rural): math 42% / reading 43% proficiency, ranked #61 of 73 in FL (top 84%) — families likely to look elsewhere, expect single-tenant / working-renter base with shorter leases; 61% free/reduced lunch — lower-income household profile, screen leases tightly.
- Zoned schools: College Park Elementary School (math 46% / reading 37%, grade F, #1,437 of 2,144 statewide, top 68%, 840 students, 78% FRL); Forest High School (math 36% / reading 54%, grade D-, #228 of 667 statewide, top 35%, 2,325 students, 42% FRL) — zoned schools at 60% FRL track the district average.
- Market conditions: 199 active listings in the ZIP; 15 comparable units currently listed for rent nearby; rentals leasing fast (median 14d on market — plan ~1-2 weeks tenant-placement turnaround); lower-income renter base — watch delinquency; 7,071 units permitted in Marion County in 2024 (534 in 5+ unit buildings).
- At $1,290/mo this rent would consume 51% of the median local household income ($30k/yr) (locally 923% of renters already pay >50% of income on rent) — very limited rent-growth headroom before tenants either downsize or default.
Forward outlook
- Local home prices are declining (-3.0%/yr); year-one equity from $975 of loan paydown is wiped out by about $4k of value loss. Plan a longer hold.
- Marion County population projected at +13% by 2050 — modest demand growth; plan on rents tracking national, not racing it.
Negotiation context
- Only 7 days on market — expect competitive offers; lowballing is unlikely to land.
- 3 sale attempts since 3y ago with the ask held roughly flat each time — persistent listings suggest the price (not the market) is what's stuck; bring a comps-based counter.
- Current owner paid $80k; list at $141k implies a 76% gain — meaningful room to come down on a strong offer.
Risks & watch-outs
- Watch-outs: built in 1956 — expect roof / HVAC / electrical / plumbing capex.
- Climate carrying-cost: severe wind risk, 99% chance of damaging wind over 30y; extreme-heat days projected 7→21/yr by 2055 (HVAC capex compounding) — expect insurance premiums to compound above CPI over the hold.
Questions for the listing agent
- Built in 1956 — when were the roof, HVAC, electrical panel, plumbing, and water heater last replaced?
- Is there a deadline driving the sale (1031 exchange, divorce, estate, relocation)? That informs how much negotiation room exists.
- Crime grade is F in this area — have there been break-ins, vandalism, or insurance claims at this property in the last 3 years? What carrier currently insures it and at what premium?
- What's the average days-on-market for RENTAL listings here right now (not sales)? A rising rental-DOM trend means longer vacancies and softer asking-rent achievability than the comps imply.
- What's the recent tenant-quality profile in this submarket — average credit score on applications, eviction rate, late-payment / NSF rate, and stable-employment percentage? A property-management company in the area should have these aggregated.
- How much new for-sale + rental construction is in the pipeline within 1–3 miles? Heavy new supply typically softens prices + rents 12–24 months out; constrained supply supports both.
Investment metrics
- 1% rule
- 0.91% ✗
- Cap rate
- 7.28%
- Cash-on-cash
- 3.54%
- DSCR
- 1.16
- GRM
- 9.1
CMA / ARV
- ARV (on-the-fly)
- $153,272
- Comps found
- 4
Show comp detail 4 sales within ~0.75 mi
| Address | Dist | Beds/Ba | Sqft | Sold | Price | $/sf | Match |
|---|---|---|---|---|---|---|---|
| 1937 SW 5 St | 0.53mi | 3/2.0 | 1,056 (+11%) | 9mo | $181,000 | $171 | 46 |
| 2023 NW 2nd St | 0.39mi | 3/2.0 | 1,092 (+15%) | 16mo | $145,000 | $133 | 40 |
| 761 NW 23rd Ave | 0.57mi | 3/2.0 | 1,054 (+11%) | 17mo | $170,000 | $161 | 38 |
| 1748 SW 5th St | 0.65mi | 2/1.0 (-1) | 819 (-14%) | 7mo | $105,000 | $128 | 35 |
Match score weights: distance 35% · size 25% · config 20% · recency 20%. Top-matched comps best support the ARV.
Projected returns pro-forma
-3.0% appreciation · 3.0% rent growth · sell at horizon
- IRR
- -10.8%
- Equity multiple
- 0.61×
- Total profit
- $-15,457
- Equity at exit
- $21,024
- IRR
- -1.5%
- Equity multiple
- 0.90×
- Total profit
- $-4,012
- Equity at exit
- $12,191
Cash invested: $39,480 (down + closing). Projections, not guarantees.
Landlord ↔ Tenant lean methodology
- Overall (STATE)
- 87 Strongly Landlord-Friendly
- State Florida
- 87 Strongly Landlord-Friendly · R+3
- County
- — inherits STATE
- City
- — inherits STATE
ZIP-level market 34475
- Home prices YoY
- -8.0%
- Active inventory
- 199
- Price-to-rent
- 9.1×
Monthly cashflow live
- Estimated rent
- $1,290 high interval (Pro) →
- Mortgage (P&I)
- −$739
- Tax from tax record
- −$104 /mo · $1,251/yr
- Insurance
- −$59
- HOA
- −$0
- Vacancy / Maint / Mgmt
- −$271
- Net cashflow
- $116
Break-even live
UW: 25.0% down · 7.5% · 30yr · 1.5% tax · 5.0% vac · 8.0% maint · 8.0% mgmt
Financing live
Cash to close
- Down payment
- $35,250
- Closing costs
- $4,230
- Reserves months
- —
- Total cash needed
- —
Loan-product check · same deal, 3 products live
Conventional
25% down · 7.5% · 30yr
- Down + closing
- —
- Monthly P&I
- —
- Monthly cashflow
- —
- DSCR
- —
- Eligible?
- —
Personal DTI + credit; lowest rate.
DSCR
20% down · 8.5% · 30yr
- Down + closing
- —
- Monthly P&I
- —
- Monthly cashflow
- —
- DSCR
- —
- Eligible?
- —
No personal income docs; deal must DSCR.
Hard money
10% down · 12.0% · 12mo
- Down + closing
- —
- Monthly P&I
- —
- Monthly cashflow
- —
- DSCR
- —
- Eligible?
- —
Short-term bridge; refi at stabilization.
Rent comps 15 comps
| Address | Beds | Baths | Sqft | Rent | $/sqft | DOM | Units | Dist |
|---|---|---|---|---|---|---|---|---|
| 2305 SW 2nd St Unit A Ocala, FL | 2.0 | 1.0 | 676 | $1,175 | $1.74 | 21d | 1 | 0.20mi |
| 1809 SW 3rd St Ocala, FL | 2.0 | 1.0 | 600 | $1,025 | $1.71 | 13d | 1 | 0.60mi |
| 2006 SW 7th St Ocala, FL | 2.0 | 1.0 | 700 | $1,050 | $1.50 | 21d | 1 | 0.60mi |
| 1911 NW 6th St Ocala, FL | 3.0 | 1.0 | 877 | $1,400 | $1.60 | 13d | 1 | 0.60mi |
| 708 SW 20th Ave Ocala, FL | 2.0 | 1.0 | 700 | $999 | $1.43 | 21d | 1 | 0.61mi |
| 12 NW 16th Ct Ocala, FL | 2.0 | 1.0 | 576 | $1,050 | $1.82 | 21d | 1 | 0.70mi |
| 1421 SW 27th Ave Ocala, FL | 2.0–4.0 | 1.0–2.0 | 1228 | $1,489 | $1.21 | 13d | 19 | 0.88mi |
| 1601 SW 27th Ave Ocala, FL | 1.0–2.0 | 1.0–2.0 | 754 | $1,357 | $1.80 | 13d | 18 | 0.99mi |
| 1908 NW 13th Pl Ocala, FL | 3.0 | 1.0 | 1000 | $1,325 | $1.32 | 21d | 1 | 1.01mi |
| 717 W Silver Springs Pl Ocala, FL | 3.0 | 2.0 | 1000 | $1,445 | $1.45 | 13d | 1 | 1.18mi |
| 1949 SW 30th Ct Apt 202 Ocala, FL | 2.0 | 1.0 | 882 | $1,050 | $1.19 | 21d | 1 | 1.30mi |
| 1949 SW 30th Ct Apt 201 Ocala, FL | 2.0 | 1.0 | 882 | $1,050 | $1.19 | 13d | 1 | 1.30mi |
| 1920 SW 31st Ave Ocala, FL | 1.0–2.0 | 1.0–1.5 | 800 | $1,495 | $1.87 | 13d | 8 | 1.36mi |
| 3041 SW 20th St Unit 5 Ocala, FL | 2.0 | 1.5 | 1055 | $1,075 | $1.02 | 21d | 1 | 1.37mi |
| NW 40th Avenue Rd Ocala, FL | 2.0 | 1.0 | 1050 | $1,050 | $1.00 | 13d | 1 | 1.46mi |
Listing history 7 events
-
2026-06-18days on market $141,000 Active 7 DOM
-
2026-06-17days on market $141,000 Active 6 DOM
-
2026-06-16days on market $141,000 Active 5 DOM
-
2026-06-15days on market $141,000 Active 4 DOM
-
2026-06-14days on market $141,000 Active 2 DOM
-
2026-06-13remarks 693-char remark
-
2026-06-13$141,000 Active 1 DOM
ⓘ Source: listings_history table (triggers on properties + properties_extension) + one-shot
backfill from property_details.listing_events for pre-trigger history.
Tax reassessment forecast FL · Resets to sale price
- Current annual tax
- $1,251 · $104/mo
- Projected year-2 tax
- $1,251 · $104/mo
- Expected delta
- $0/yr ($0/mo · 0.0%)
ⓘ Screening estimate from a state-policy table — verify with the county assessor before closing.
Climate risk First Street
- Flood 1/10 Low FEMA zone X (unshaded) · 0% chance over 30 yrs
- Wildfire 2/10 Low
- Heat 8/10 Severe 7 d/yr ≥107°F today · 21 d/yr by 30 yrs out
- Wind 9/10 Extreme 99% chance of damaging wind over 30 yrs
- Air quality 3/10 Moderate 3 unhealthy d/yr today · 3 by 30 yrs out
Nearby sold comps map
Loading sold comps map…
Walkable amenities ~0.75 mi
Loading nearby amenities…
Taxation est. · year 1
- Rental income
- $15,476
- − Mortgage interest
- −$7,898
- − Property taxes
- −$1,251
- − Insurance
- −$705
- − Repairs & maintenance
- −$1,238
- − Management
- −$1,238
- − Depreciation
- −$4,102
- Taxable loss
- −$956
- Est. tax savings @ 24.0%
- +$229
- After-tax cash flow
- $1,627/yr
For passive investors: Depreciation is non-cash, so a rental often shows a tax loss while cash-flowing — sheltering income. Rental losses are passive: they offset passive income freely, and up to $25,000/yr can offset ordinary (W-2) income if you actively participate and your MAGI is under $100k (phasing out to $0 by $150k); unused losses carry forward. On sale, claimed depreciation is recaptured at up to 25%, and gains may owe capital-gains tax (a 1031 exchange can defer both). Figures are a year-1 estimate at your 24.0% rate — not tax advice; consult a CPA.
Schools (NCES district)
- District
- Marion
- NCES district ID
- 1201260
- Math proficiency
- 42% ▼ -7.00%
- Reading proficiency
- 43% ▼ -4.00%
- Median HH income
- $40,015
- Composite
- 35.61/100
- National rank
- #4890
- State rank
- #61 of 73 in FL
Livability — Ocala
- Score
- 69/100
- State rank
- #476
- US rank
- #8461
Category grades
Schools grade is shown separately in the Schools card above.
Census & demographics
- Census place
- Ocala, FL
- County
- Marion County · 315,796 people
- City population
- 263,375
- Metro
- Ocala, FL
- Population (ZIP)
- 14,301
- Household income
- $30,174
- Rent vs Own
- Severe rent burden
- 923.0
Population outlook (Marion County) Hauer SSP2
- Today (2025)
- 365,905 people
- By 2030
- 376,768 · +3.0%
- By 2040
- 396,555 · +8.4%
- By 2050
- 412,723 · +12.8%
- By 2075
- 446,090 · +21.9%
- By 2100
- 436,193 · +19.2%
Race, ethnicity, and origin ACS 2023
- Neighborhood character
- Diverse neighborhood (Simpson 0.68)
- Race & ethnicity
- Black 44% White 30% Hispanic / Latino 19% Two or more races 11%
- Hispanic origin (detail)
- Mexican 1% Puerto Rican 8% Cuban 3%
- Common ancestry
- Serbian 2% Hispanic 1% Lithuanian 1%
- Foreign-born
- 8% · Canada, China, Jamaica
- Languages at home
- 84% English-only · Spanish 13% French/Haitian/Cajun 2%
Political lean MEDSL · Marion
- 2024 margin
- Solid R (+31.6) · D 33.8% · R 65.5%
- 2008→2024 swing
- -20.0pp toward R · 2008: -11.6pp · 2024: -31.6pp
- All cycles
- 2024: R+31.6 2020: R+25.9 2016: R+26.2 2012: R+16.2 2008: R+11.6
Not yet ingested
- Civics
- —
Market trends
- HPI YoY
- ▼ -22.26%
- Current HPI
- 254.6319
- Rent YoY
- —
- Metro
- Ocala, FL
- State GDP YoY
- ▲ 3.28%
- F500 in state
- 36
Industry mix (Fortune 500 HQ in FL)
| Industry | F500 HQs | Revenue |
|---|---|---|
| Industrial Technology | 2 | $29B |
|
||
| Insurance | 2 | $17B |
|
||
| Retail | 1 | $60B |
|
||
| Technology Distribution | 1 | $58B |
|
||
| Homebuilding | 1 | $35B |
|
||
| Technology Manufacturing | 1 | $35B |
|
||
Price history
+41.1% since first listed10 events — show timeline
- 2026-06-11 Listed $141,000 Stellar MLS as Distributed by MLS Grid
- 2024-08-19 Pending — Stellar MLS as Distributed by MLS Grid
- 2024-07-31 Price Changed $99,500 Stellar MLS as Distributed by MLS Grid
- 2024-07-31 Price Changed $110,000 Stellar MLS as Distributed by MLS Grid
- 2024-07-24 Listed $100,000 Stellar MLS as Distributed by MLS Grid
- 2024-01-29 Sold (MLS) $80,000 Stellar MLS as Distributed by MLS Grid
- 2024-01-12 Pending — Stellar MLS as Distributed by MLS Grid
- 2023-12-20 Price Changed $84,900 Stellar MLS as Distributed by MLS Grid
- 2023-11-21 Price Changed $94,900 Stellar MLS as Distributed by MLS Grid
- 2023-10-10 Listed $99,900 Stellar MLS as Distributed by MLS Grid
Property tax history
+244.4%/yrLatest (2025): $1,251 · -1.2% YoY. Source: county tax records.
Cash-flow waterfall
monthlySold comps — $/sqft
last 12 mo · ≤1 miLoading sold comps…