10114 Whistling Pine Ct · Jacksonville, FL
Flood risk No data
- FEMA flood zone
- —
- Chance of flooding over 30 yrs
- —
- Est. flood insurance / yr
- —
Fire risk No data
- Est. fire insurance / yr
- —
Heat risk No data
- Hot days now (above threshold)
- —
- Hot days in 30 yrs
- —
Wind risk No data
- Chance of severe wind over 30 yrs
- —
Air-quality risk No data
- Unhealthy air days now
- —
- Unhealthy air days in 30 yrs
- —
Risk factors via First Street. Map © Google.
Why this score? — see what drove the D- grade
The composite is a weighted blend of 9 inputs, each scored 0–100. Each bar is that input's sub-score; the figure is the points it added to the 100-point composite (weight × sub-score).
- Cash flow +11.3/30.0
- ARV discount +6.9/15.0
- Livability +4.2/5.0
- Condition / age +4.0/5.0
- Schools +3.9/10.0
- 1% rule +3.3/10.0
- DSCR +3.3/10.0
- Rent growth +3.0/5.0
- Appreciation +0.0/10.0
$240,990
🖨 Deal sheet 📄 Offer letter ✓ Due diligence
Listing remarks
Contact Sales for Details
Key facts
- Garage
- Built 2026
- Listed 38 days
Property features AI
Finance
- Financial info: List price $248,890
Exterior
- Parking: 1 garage space (1 total parking space)
- Home design: Spec home — Landmark plan
Interior
- Bedrooms: 3 bedrooms
- Bathrooms: 2 full bathrooms, 1 half bathroom
- Interior features: Living area approximately 1,526
Neighborhood map
What this means for you Summary
Snapshot
- This is a 3-bed/2.5-bath townhouse listed at $241k. Condition is rated good.
Deal economics
- At list price, monthly cash flow is $-87 ($-1k/yr) — negative.
- To cash-flow at today's rent, offer at most $228k (5.2% below list).
- To meet the 1% rule (rent ≥ 1% of price), the offer needs to be $200k (17.1% below list).
- Recommended offer: $200k (17.1% below list) — sets the bar for 1% rule.
- Cap rate 5.9% vs local median 4.0% in Jacksonville — top-decile yield for the area; either an underpriced asset or a hidden risk that comps aren't pricing in. Stress-test before assuming the spread holds.
Location & tenants
- Location reads 83/100 on livability (#50 in FL, #911 nationally) — a professional / high-income tenant draw. Strengths: amenities A+, commute A+, housing A+.
- Duval (urban): math 46% / reading 45% proficiency, ranked #48 of 73 in FL (top 66%) — families likely to look elsewhere, expect single-tenant / working-renter base with shorter leases.
- Market conditions: Rents rising (+2.1%/yr); 217 active listings in the ZIP; 13 comparable units currently listed for rent nearby; rentals at typical pace (median 16d on market — plan ~3-4 weeks tenant-placement turnaround); solid renter incomes; 6,503 units permitted in Duval County in 2024 (1,131 in 5+ unit buildings).
Forward outlook
- Local home prices are declining (-3.0%/yr); year-one equity from $2k of loan paydown is wiped out by about $7k of value loss. Plan a longer hold.
- Duval County population projected at +19% by 2050 — long-run rental-demand tailwind backs the buy-and-hold thesis.
Negotiation context
- It's been on market 39 days — a 3% lower offer ($234k) is reasonable based on typical stale-listing flexibility.
Questions for the listing agent
- What do current leases actually rent for vs. the listed asking? Can we see a recent rent roll and the last 12 months of T-12 income?
- It's been on market 39 days. Have you received any prior offers? Is the seller open to a 17% concession, seller financing, or rate buy-down credit?
- Is there a deadline driving the sale (1031 exchange, divorce, estate, relocation)? That informs how much negotiation room exists.
- Schools are B-rated — typically a magnet for longer-tenancy family renters. What's the average tenant stay here, and is there a school-zone premium baked into asking?
- The area grade is low — what's the realistic commute time and amenity access for the typical tenant pool here? Any planned neighborhood developments (good or bad) we should know about?
- What's the average days-on-market for RENTAL listings here right now (not sales)? A rising rental-DOM trend means longer vacancies and softer asking-rent achievability than the comps imply.
- What's the recent tenant-quality profile in this submarket — average credit score on applications, eviction rate, late-payment / NSF rate, and stable-employment percentage? A property-management company in the area should have these aggregated.
- How much new for-sale + rental construction is in the pipeline within 1–3 miles? Heavy new supply typically softens prices + rents 12–24 months out; constrained supply supports both.
Investment metrics
- 1% rule
- 0.83% ✗
- Cap rate
- 5.86%
- Cash-on-cash
- -1.55%
- DSCR
- 0.93
- GRM
- 10.1
CMA / ARV
- ARV (on-the-fly)
- $238,056
- Comps found
- 12
Show comp detail 12 sales within ~0.75 mi
| Address | Dist | Beds/Ba | Sqft | Sold | Price | $/sf | Match |
|---|---|---|---|---|---|---|---|
| 10130 Whistling Pne Ct | 0.03mi | 3/2.5 | 1,526 (0%) | 1mo | $238,390 | $156 | 98 |
| 10126 Whistling Pne Ct | 0.02mi | 3/2.5 | 1,526 (0%) | 1mo | $242,890 | $159 | 98 |
| 10124 Whistling Pne Ct | 0.02mi | 3/2.5 | 1,536 (+1%) | 1mo | $257,000 | $167 | 97 |
| 1880 Normandy Pines Ln | 0.06mi | 3/2.5 | 1,526 (0%) | 1mo | $239,390 | $157 | 96 |
| 1856 Normandy Pines Ln | 0.07mi | 3/2.5 | 1,526 (0%) | 1mo | $238,390 | $156 | 96 |
| 10129 Treasure Oaks Ct | 0.03mi | 3/2.5 | 1,526 (0%) | 4mo | $227,890 | $149 | 95 |
| 10113 Treasure Oaks Ct | 0.02mi | 3/2.5 | 1,526 (0%) | 4mo | $227,000 | $149 | 95 |
| 1876 Normandy Pines Ln | 0.06mi | 3/2.5 | 1,526 (0%) | 3mo | $231,000 | $151 | 95 |
| 1872 Normandy Pines Ln | 0.06mi | 3/2.5 | 1,526 (0%) | 3mo | $228,000 | $149 | 95 |
| 1860 Normandy Pines Ln | 0.07mi | 3/2.5 | 1,526 (0%) | 2mo | $241,390 | $158 | 95 |
| 1874 Normandy Pines Ln | 0.06mi | 3/2.5 | 1,526 (0%) | 3mo | $232,890 | $153 | 94 |
| 1870 Normandy Pines Ln | 0.06mi | 3/2.5 | 1,526 (0%) | 5mo | $236,000 | $155 | 93 |
Match score weights: distance 35% · size 25% · config 20% · recency 20%. Top-matched comps best support the ARV.
Projected returns pro-forma
-3.0% appreciation · 2.12% rent growth · sell at horizon
- IRR
- -19.8%
- Equity multiple
- 0.31×
- Total profit
- $-46,319
- Equity at exit
- $35,932
- IRR
- -14.7%
- Equity multiple
- 0.19×
- Total profit
- $-54,421
- Equity at exit
- $20,836
Cash invested: $67,477 (down + closing). Projections, not guarantees.
Landlord ↔ Tenant lean methodology
- Overall (STATE)
- 87 Strongly Landlord-Friendly
- State Florida
- 87 Strongly Landlord-Friendly · R+3
- County
- — inherits STATE
- City
- — inherits STATE
ZIP-level market 32221
- Home prices YoY
- -19.2%
- Rents YoY
- 2.1%
- Active inventory
- 217
- Price-to-rent
- 10.1×
Monthly cashflow live
- Estimated rent
- $1,998 high interval (Pro) →
- Mortgage (P&I)
- −$1,264
- Tax est. 1.5%
- −$301 /mo · $3,615/yr
- Insurance
- −$100
- HOA
- −$0
- Vacancy / Maint / Mgmt
- −$420
- Net cashflow
- $-87
Break-even live
UW: 25.0% down · 7.5% · 30yr · 1.5% tax · 5.0% vac · 8.0% maint · 8.0% mgmt
Financing live
Cash to close
- Down payment
- $60,248
- Closing costs
- $7,230
- Reserves months
- —
- Total cash needed
- —
Loan-product check · same deal, 3 products live
Conventional
25% down · 7.5% · 30yr
- Down + closing
- —
- Monthly P&I
- —
- Monthly cashflow
- —
- DSCR
- —
- Eligible?
- —
Personal DTI + credit; lowest rate.
DSCR
20% down · 8.5% · 30yr
- Down + closing
- —
- Monthly P&I
- —
- Monthly cashflow
- —
- DSCR
- —
- Eligible?
- —
No personal income docs; deal must DSCR.
Hard money
10% down · 12.0% · 12mo
- Down + closing
- —
- Monthly P&I
- —
- Monthly cashflow
- —
- DSCR
- —
- Eligible?
- —
Short-term bridge; refi at stabilization.
Rent comps 13 comps
| Address | Beds | Baths | Sqft | Rent | $/sqft | DOM | Units | Dist |
|---|---|---|---|---|---|---|---|---|
| 2120 Blair Rd Jacksonville, FL | 3.0 | 2.0 | 1272 | $1,675 | $1.32 | 23d | 1 | 0.36mi |
| 2514 Paris Mill Rd Jacksonville, FL | 3.0 | 2.0 | 1974 | $2,096 | $1.06 | 7d | 1 | 0.62mi |
| 10355 Shelby Creek Rd S Jacksonville, FL | 4.0 | 2.0 | 1917 | $2,100 | $1.10 | 20d | 1 | 0.65mi |
| 9670 Freefall Rd Jacksonville, FL | 3.0 | 2.5 | 2109 | $2,300 | $1.09 | 14d | 1 | 0.74mi |
| 2081 Chaffee Rd S #19 Jacksonville, FL | 3.0 | 2.0 | 1152 | $1,619 | $1.41 | 23d | 1 | 0.81mi |
| 2081 Chaffee Rd S Unit 43 Jacksonville, FL | 4.0 | 2.0 | 1904 | $1,829 | $0.96 | 4d | 1 | 0.82mi |
| 2081 Chaffee Rd S #72 Jacksonville, FL | 2.0 | 2.0 | 1216 | $1,309 | $1.08 | 23d | 1 | 0.82mi |
| 2625 Fox Creek Dr Jacksonville, FL | 4.0 | 2.0 | 2018 | $2,040 | $1.01 | 23d | 1 | 0.89mi |
| 10161 Meadow Pointe Dr Jacksonville, FL | 3.0 | 2.0 | 1810 | $2,035 | $1.12 | 16d | 1 | 1.12mi |
| 2167 Kistlers Ridge Way Jacksonville, FL | 4.0 | 2.0 | 1456 | $1,900 | $1.30 | 14d | 1 | 1.22mi |
| 2210 Kistlers Ridge Way Jacksonville, FL | 4.0 | 2.0 | 1456 | $1,846 | $1.27 | 23d | 1 | 1.27mi |
| 9183 Raptor Dr Jacksonville, FL | 3.0 | 2.0 | 1091 | $1,724 | $1.58 | 4d | 1 | 1.33mi |
| 9101 Normandy Blvd Jacksonville, FL | 2.0–3.0 | 1.0–2.0 | 994 | $1,629 | $1.64 | 3d | 1 | 1.40mi |
Listing history 10 events
-
2026-06-18days on market $240,990 Active 39 DOM
-
2026-06-17days on market $240,990 Active 38 DOM
-
2026-06-16days on market $240,990 Active 37 DOM
-
2026-06-15days on market $240,990 Active 36 DOM
-
2026-06-10days on market $240,990 Active 30 DOM
-
2026-06-08pricedays on market $240,990 Active 29 DOM
-
2026-06-03days on market $244,990 Active 24 DOM
-
2026-06-02days on market $244,990 Active 23 DOM
-
2026-06-01days on market $244,990 Active 22 DOM
-
2026-05-31pricedays on market $244,990 Active 21 DOM
ⓘ Source: listings_history table (triggers on properties + properties_extension) + one-shot
backfill from property_details.listing_events for pre-trigger history.
Nearby sold comps map
Loading sold comps map…
Walkable amenities ~0.75 mi
Loading nearby amenities…
Taxation est. · year 1
- Rental income
- $23,975
- − Mortgage interest
- −$13,499
- − Property taxes
- −$3,615
- − Insurance
- −$1,205
- − Repairs & maintenance
- −$1,918
- − Management
- −$1,918
- − Depreciation
- −$7,011
- Taxable loss
- −$5,190
- Est. tax savings @ 24.0%
- +$1,246
- After-tax cash flow
- $201/yr
For passive investors: Depreciation is non-cash, so a rental often shows a tax loss while cash-flowing — sheltering income. Rental losses are passive: they offset passive income freely, and up to $25,000/yr can offset ordinary (W-2) income if you actively participate and your MAGI is under $100k (phasing out to $0 by $150k); unused losses carry forward. On sale, claimed depreciation is recaptured at up to 25%, and gains may owe capital-gains tax (a 1031 exchange can defer both). Figures are a year-1 estimate at your 24.0% rate — not tax advice; consult a CPA.
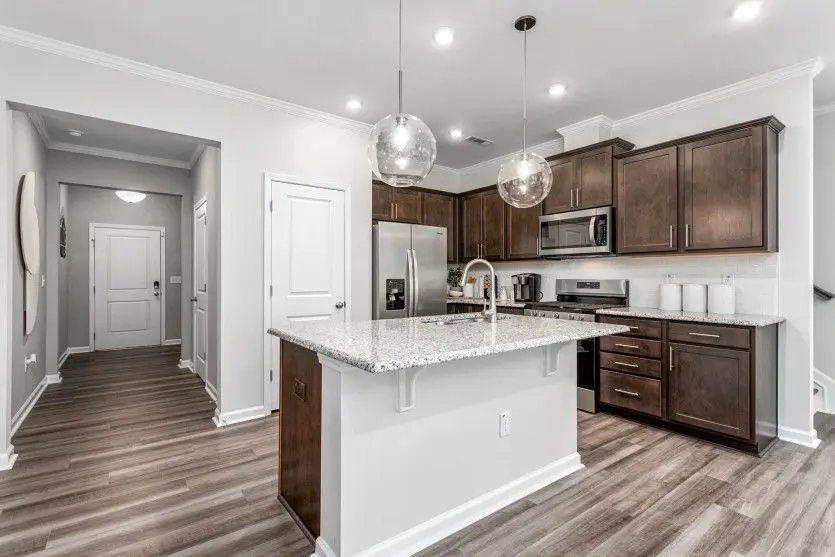
Condition & rehab AI · 1 photo
This townhouse is in good condition with a modern kitchen and neutral interior. It has potential for further value increases through cosmetic upgrades and smart home features.
Value-add opportunities
- Both Painting the exterior and interior walls — Fresh paint can enhance curb appeal and interior aesthetics.
- Both Landscaping improvements — Enhanced landscaping can boost curb appeal and attract more potential buyers/tenants.
- Resale Upgrading the kitchen appliances — Modernizing the kitchen appliances can increase the home's appeal to buyers.
- Both Adding smart home features — Smart home features can increase convenience and appeal to both buyers and tenants.
- Resale Upgrading the flooring in bathrooms — Upgrading to higher-end flooring can enhance the home's value and appeal to buyers.
- Rental Adding a smart thermostat — A smart thermostat can improve energy efficiency and attract tenants who value smart home technology.
Renovation cost estimate screening
Value-add ROI direction
- Both Painting the exterior and interior walls — Fresh paint can enhance curb appeal and interior aesthetics. ↑
- Both Landscaping improvements — Enhanced landscaping can boost curb appeal and attract more potential buyers/tenants. ↑
- Resale Upgrading the kitchen appliances — Modernizing the kitchen appliances can increase the home's appeal to buyers. ↑
- Both Adding smart home features — Smart home features can increase convenience and appeal to both buyers and tenants. ↑
- Resale Upgrading the flooring in bathrooms — Upgrading to higher-end flooring can enhance the home's value and appeal to buyers. ↑
- Rental Adding a smart thermostat — A smart thermostat can improve energy efficiency and attract tenants who value smart home technology. ↑
ⓘ Cost ranges are severity-bucket heuristics (US national rule-of-thumb). Get contractor quotes + a written scope before underwriting a rehab budget.
Schools (NCES district)
- District
- Duval
- NCES district ID
- 1200480
- Math proficiency
- 46% ▼ -11.00%
- Reading proficiency
- 45% ▼ -4.00%
- Median HH income
- $48,987
- Composite
- 38.97/100
- National rank
- #4076
- State rank
- #48 of 73 in FL
Livability — Jacksonville
- Score
- 83/100
- State rank
- #50
- US rank
- #911
Category grades
Schools grade is shown separately in the Schools card above.
Census & demographics
- Census place
- Jacksonville, FL
- County
- Duval County · 1,015,274 people
- City population
- 979,034
- Metro
- Jacksonville, FL
- Population (ZIP)
- 32,833
- Household income
- $82,969
- Rent vs Own
- Severe rent burden
- 516.0
Population outlook (Duval County) Hauer SSP2
- Today (2025)
- 1,013,010 people
- By 2030
- 1,059,228 · +4.6%
- By 2040
- 1,141,439 · +12.7%
- By 2050
- 1,205,258 · +19.0%
- By 2075
- 1,324,282 · +30.7%
- By 2100
- 1,319,620 · +30.3%
Race, ethnicity, and origin ACS 2023
- Neighborhood character
- Diverse neighborhood (Simpson 0.65)
- Race & ethnicity
- White 48% Black 33% Hispanic / Latino 9% Two or more races 6% Asian 4%
- Hispanic origin (detail)
- Mexican 2% Puerto Rican 5%
- Common ancestry
- Italian 3% Slovak 2% Hispanic 1%
- Foreign-born
- 9% · Canada, Vietnam
- Languages at home
- 88% English-only · Spanish 6% French/Haitian/Cajun 2% Vietnamese 2%
Political lean MEDSL · Duval
- 2024 margin
- Toss-up / Even · D 48.7% · R 50.1% · Other 1.2%
- 2008→2024 swing
- +0.4pp no change · 2008: -1.9pp · 2024: -1.5pp
- All cycles
- 2024: R+1.5 2020: D+3.8 2016: R+1.5 2012: R+3.6 2008: R+1.9
Not yet ingested
- Civics
- —
Market trends
- HPI YoY
- ▼ -62.74%
- Current HPI
- 263.7591
- Rent YoY
- ▲ 2.12%
- Metro
- Jacksonville, FL
- State GDP YoY
- ▲ 3.28%
- F500 in state
- 36
Industry mix (Fortune 500 HQ in FL)
| Industry | F500 HQs | Revenue |
|---|---|---|
| Industrial Technology | 2 | $29B |
|
||
| Insurance | 2 | $17B |
|
||
| Retail | 1 | $60B |
|
||
| Technology Distribution | 1 | $58B |
|
||
| Homebuilding | 1 | $35B |
|
||
| Technology Manufacturing | 1 | $35B |
|
||
Cash-flow waterfall
monthlySold comps — $/sqft
last 12 mo · ≤1 miLoading sold comps…