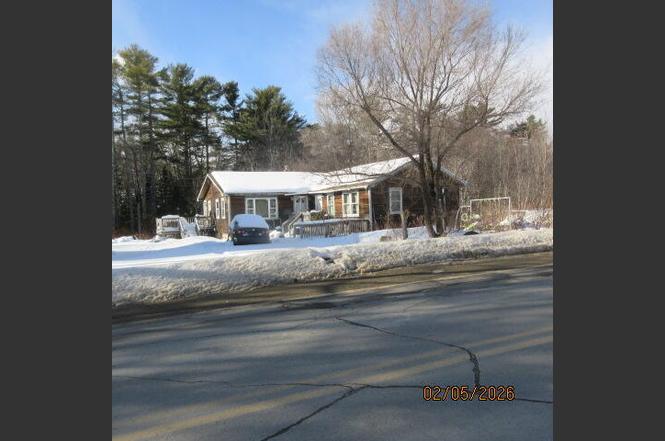
66 North St · Ellsworth, ME
Flood risk 1/10 · Minimal
- FEMA flood zone
- X (unshaded)
- Chance of flooding over 30 yrs
- 0.0%
- Est. flood insurance / yr
- $473 – $860
Fire risk 1/10 · Minimal
- Est. fire insurance / yr
- $669 – $1,243
Heat risk 3/10 · Minor
- Hot days now (above 88°F)
- 7 days/yr
- Hot days in 30 yrs
- 15 days/yr
Wind risk 6/10 · Moderate
- Chance of severe wind over 30 yrs
- 27.0%
Air-quality risk 1/10 · Minimal
- Unhealthy air days now
- 0 days/yr
- Unhealthy air days in 30 yrs
- 0 days/yr
Risk factors via First Street. Map © Google.
Why this score? — see what drove the C+ grade
The composite is a weighted blend of 9 inputs, each scored 0–100. Each bar is that input's sub-score; the figure is the points it added to the 100-point composite (weight × sub-score).
- Cash flow +22.9/30.0
- ARV discount +7.5/15.0
- DSCR +7.4/10.0
- 1% rule +7.2/10.0
- Schools +6.9/10.0
- Livability +3.9/5.0
- Rent growth +2.5/5.0
- Condition / age +2.5/5.0
- Appreciation +0.0/10.0
$150,000
🖨 Deal sheet 📄 Offer letter ✓ Due diligence
Listing remarks
1972 +/- 2 bedroom, 2 bath, ranch , deck. ,2 story 2 car garage on 1.07 acre lot, Close to town amenities, Sold As Is. It has been condemned by the town due to a fire in the back part of house And the unsanitary conditions, inside and out.
Key facts
- 1.07 acre lot
- 2 garage spots
- Built 1972
Neighborhood map
What this means for you Summary
Snapshot
- This is a 2-bed/2.0-bath single-family listed at $150k.
Deal economics
- At list price, monthly cash flow is $264 ($3k/yr) — positive.
- The deal already cash-flows at list — no discount required.
- Meets the 1% rule at list price ($2k rent vs $150k).
- Recommended offer: $148k (1.5% below list) — sets the bar for market timing.
- Cap rate 8.4% vs local median 2.4% in Ellsworth — top-decile yield for the area; either an underpriced asset or a hidden risk that comps aren't pricing in. Stress-test before assuming the spread holds.
Location & tenants
- Location reads 77/100 on livability (#32 in ME, #3,210 nationally) — a middle-class / working-renter tenant base. Strengths: cost of living A+, health & safety A+, housing A; Watch: amenities D+, commute F.
- Ellsworth Public Schools (town): math 79% / reading 85% proficiency, ranked #75 of 112 in ME (top 67%) — strong family-tenant draw, lease renewals of 3-5y typical.
- Market conditions: 152 active listings in the ZIP; 270 units permitted in Hancock County in 2024 (0 in 5+ unit buildings).
Forward outlook
- Local home prices are declining (-3.0%/yr); year-one equity from $1k of loan paydown is wiped out by about $4k of value loss. Plan a longer hold.
- Hancock County population projected at -14% by 2050 — secular population decline; favor cash flow + early exit over multi-decade hold.
Negotiation context
- It's been on market 18 days — a 2% lower offer ($148k) is reasonable based on typical stale-listing flexibility.
Risks & watch-outs
- Watch-outs: property tax is 2.7% of price.
- Climate carrying-cost: major wind risk, 27% chance of damaging wind over 30y — expect insurance premiums to compound above CPI over the hold.
Questions for the listing agent
- Built in 1972 — when were the roof, HVAC, electrical panel, plumbing, and water heater last replaced?
- Property tax is high relative to price — has the assessment been appealed recently, and will the sale trigger a re-assessment?
- Is there a deadline driving the sale (1031 exchange, divorce, estate, relocation)? That informs how much negotiation room exists.
- What's the average days-on-market for RENTAL listings here right now (not sales)? A rising rental-DOM trend means longer vacancies and softer asking-rent achievability than the comps imply.
- What's the recent tenant-quality profile in this submarket — average credit score on applications, eviction rate, late-payment / NSF rate, and stable-employment percentage? A property-management company in the area should have these aggregated.
- How much new for-sale + rental construction is in the pipeline within 1–3 miles? Heavy new supply typically softens prices + rents 12–24 months out; constrained supply supports both.
Investment metrics
- 1% rule
- 1.22% ✓
- Cap rate
- 8.40%
- Cash-on-cash
- 7.54%
- DSCR
- 1.34
- GRM
- 6.8
CMA / ARV
- ARV (on-the-fly)
- $386,880
- Comps found
- 3
Show comp detail 3 sales within ~0.75 mi
| Address | Dist | Beds/Ba | Sqft | Sold | Price | $/sf | Match |
|---|---|---|---|---|---|---|---|
| 37 Sennett Way | 0.23mi | 3/2.0 (+1) | 1,440 (-11%) | 1mo | $345,000 | $240 | 66 |
| 361 Shore Rd | 0.32mi | 3/2.0 (+1) | 1,715 (+6%) | 18mo | $285,000 | $166 | 55 |
| 167 Lakes Ln | 0.63mi | 3/2.0 (+1) | 1,488 (-8%) | 2mo | $402,205 | $270 | 52 |
Match score weights: distance 35% · size 25% · config 20% · recency 20%. Top-matched comps best support the ARV.
Projected returns pro-forma
-3.0% appreciation · 3.0% rent growth · sell at horizon
- IRR
- -4.7%
- Equity multiple
- 0.82×
- Total profit
- $-7,383
- Equity at exit
- $22,365
- IRR
- 5.1%
- Equity multiple
- 1.37×
- Total profit
- $15,693
- Equity at exit
- $12,969
Cash invested: $42,000 (down + closing). Projections, not guarantees.
Landlord ↔ Tenant lean methodology
- Overall (STATE)
- 41 Moderately Tenant-Leaning
- State Maine
- 41 Moderately Tenant-Leaning · D+2
- County
- — inherits STATE
- City
- — inherits STATE
ZIP-level market 04605
- Home prices YoY
- -27.0%
- Active inventory
- 152
- Price-to-rent
- 6.8×
Monthly cashflow live
- Estimated rent
- $1,835 medium interval (Pro) →
- Mortgage (P&I)
- −$787
- Tax from tax record
- −$337 /mo · $4,041/yr
- Insurance
- −$62
- HOA
- −$0
- Vacancy / Maint / Mgmt
- −$385
- Net cashflow
- $264
Break-even live
UW: 25.0% down · 7.5% · 30yr · 1.5% tax · 5.0% vac · 8.0% maint · 8.0% mgmt
Financing live
Cash to close
- Down payment
- $37,500
- Closing costs
- $4,500
- Reserves months
- —
- Total cash needed
- —
Loan-product check · same deal, 3 products live
Conventional
25% down · 7.5% · 30yr
- Down + closing
- —
- Monthly P&I
- —
- Monthly cashflow
- —
- DSCR
- —
- Eligible?
- —
Personal DTI + credit; lowest rate.
DSCR
20% down · 8.5% · 30yr
- Down + closing
- —
- Monthly P&I
- —
- Monthly cashflow
- —
- DSCR
- —
- Eligible?
- —
No personal income docs; deal must DSCR.
Hard money
10% down · 12.0% · 12mo
- Down + closing
- —
- Monthly P&I
- —
- Monthly cashflow
- —
- DSCR
- —
- Eligible?
- —
Short-term bridge; refi at stabilization.
Listing history 2 events
-
2026-04-01status Pending
-
2026-03-14$150,000 Active
ⓘ Source: listings_history table (triggers on properties + properties_extension) + one-shot
backfill from property_details.listing_events for pre-trigger history.
Tax reassessment forecast ME · Partial reset (capped growth)
- Current annual tax
- $4,041 · $337/mo
- Projected year-2 tax
- $4,041 · $337/mo
- Expected delta
- $0/yr ($0/mo · 0.0%)
ⓘ Screening estimate from a state-policy table — verify with the county assessor before closing.
Climate risk First Street
- Flood 1/10 Low FEMA zone X (unshaded) · 0% chance over 30 yrs
- Wildfire 1/10 Low
- Heat 3/10 Moderate 7 d/yr ≥88°F today · 15 d/yr by 30 yrs out
- Wind 6/10 Major 27% chance of damaging wind over 30 yrs
- Air quality 1/10 Low 0 unhealthy d/yr today · 0 by 30 yrs out
Nearby sold comps map
Loading sold comps map…
Walkable amenities ~0.75 mi
Loading nearby amenities…
Taxation est. · year 1
- Rental income
- $22,021
- − Mortgage interest
- −$8,402
- − Property taxes
- −$4,041
- − Insurance
- −$750
- − Repairs & maintenance
- −$1,762
- − Management
- −$1,762
- − Depreciation
- −$4,364
- Taxable income
- $940
- Est. tax owed @ 24.0%
- −$226
- After-tax cash flow
- $2,940/yr
For passive investors: Depreciation is non-cash, so a rental often shows a tax loss while cash-flowing — sheltering income. Rental losses are passive: they offset passive income freely, and up to $25,000/yr can offset ordinary (W-2) income if you actively participate and your MAGI is under $100k (phasing out to $0 by $150k); unused losses carry forward. On sale, claimed depreciation is recaptured at up to 25%, and gains may owe capital-gains tax (a 1031 exchange can defer both). Figures are a year-1 estimate at your 24.0% rate — not tax advice; consult a CPA.
Schools (NCES district)
- District
- Ellsworth Public Schools
- NCES district ID
- 2305500
- Math proficiency
- 79% ▲ 42.00%
- Reading proficiency
- 85% ▲ 29.00%
- Median HH income
- $47,000
- Composite
- 69.01/100
- National rank
- #325
- State rank
- #75 of 112 in ME
Livability — Ellsworth
- Score
- 77/100
- State rank
- #32
- US rank
- #3210
Category grades
Schools grade is shown separately in the Schools card above.
Census & demographics
- Census place
- Ellsworth, ME
- Population (ZIP)
- 14,695
Population outlook (Hancock County) Hauer SSP2
- Today (2025)
- 53,608 people
- By 2030
- 52,594 · -1.9%
- By 2040
- 49,556 · -7.6%
- By 2050
- 46,152 · -13.9%
- By 2075
- 39,678 · -26.0%
- By 2100
- 33,690 · -37.2%
Race, ethnicity, and origin ACS 2023
- Neighborhood character
- Predominantly White (91%)
- Race & ethnicity
- White 91% Two or more races 4% Hispanic / Latino 2% Asian 1% Black 1%
- Common ancestry
- Lithuanian 9% Slovak 5% Romanian 3%
- Foreign-born
- 3% · Canada, South Korea
- Languages at home
- 97% English-only · German/W. Germanic 1% Other Indo-European 1%
Political lean MEDSL · Hancock
- 2024 margin
- D (+11.8) · D 54.7% · R 42.9% · Other 2.4%
- 2008→2024 swing
- -7.5pp toward R · 2008: 19.3pp · 2024: 11.8pp
- All cycles
- 2024: D+11.8 2020: D+12.4 2016: D+7.6 2012: D+16.7 2008: D+19.3
Not yet ingested
- Civics
- —
Market trends
- HPI YoY
- ▼ -69.32%
- Current HPI
- 187.7717
- Rent YoY
- —
- Metro
- —
- State GDP YoY
- —
- F500 in state
- 0
Price history
2 events — show timeline
- 2026-04-01 Pending — MREIS
- 2026-03-14 Listed $150,000 MREIS
Property tax history
+4.3%/yrLatest (2024): $4,041 · +19.0% YoY. Source: county tax records.
Cash-flow waterfall
monthlySold comps — $/sqft
last 12 mo · ≤1 miLoading sold comps…