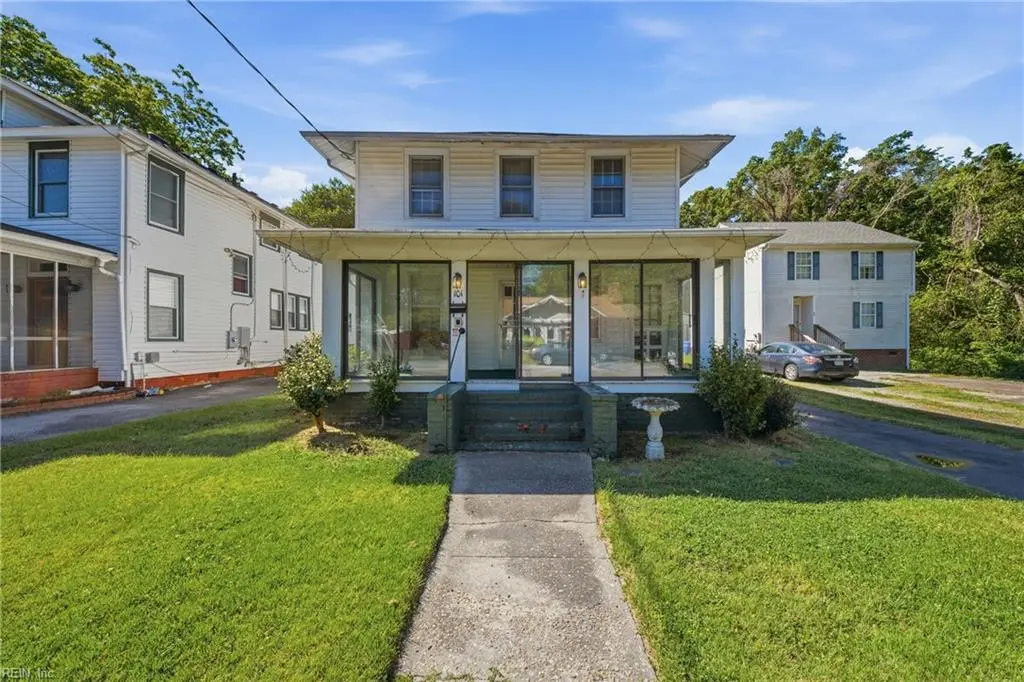
101 Highland Ave · Suffolk, VA
Flood risk 1/10 · Minimal
- FEMA flood zone
- X (unshaded)
- Chance of flooding over 30 yrs
- 0.0%
- Est. flood insurance / yr
- $507 – $1,088
Fire risk 1/10 · Minimal
- Est. fire insurance / yr
- $666 – $1,236
Heat risk 8/10 · Major
- Hot days now (above 107°F)
- 7 days/yr
- Hot days in 30 yrs
- 16 days/yr
Wind risk 8/10 · Major
- Chance of severe wind over 30 yrs
- 80.0%
Air-quality risk 2/10 · Minimal
- Unhealthy air days now
- 0 days/yr
- Unhealthy air days in 30 yrs
- 1 days/yr
Risk factors via First Street. Map © Google.
Why this score? — see what drove the C grade
The composite is a weighted blend of 9 inputs, each scored 0–100. Each bar is that input's sub-score; the figure is the points it added to the 100-point composite (weight × sub-score).
- Cash flow +17.0/30.0
- ARV discount +15.0/15.0
- DSCR +5.3/10.0
- Schools +4.8/10.0
- 1% rule +4.2/10.0
- Rent growth +4.0/5.0
- Livability +3.9/5.0
- Condition / age +2.5/5.0
- Appreciation +0.0/10.0
$240,000
🖨 Deal sheet 📄 Offer letter ✓ Due diligence
Listing remarks
Just minutes from downtown Suffolk, this charming home is full of possibilities. Whether you’re looking for a spacious single family home, investment opportunity, or potential rental property, this one is worth a look. With possible duplex potential, the options are there for the next owner. This home is full of character featuring hardwood flooring, a cozy front porch for relaxing, and a classic claw foot tub that adds to the charm. Out back you’ll find a large 3-bay garage with plenty of room for storage, hobbies, or a workshop. Half pipe in the backyard to convey with the property for anyone wanting a fun bonus feature. Great opportunity for an investor or someone looking to
Key facts
- Hardwood flooring
- Large 3-bay garage
- Cozy front porch
Tags
Property features AI
Finance
- Other: Fixer upper
- HOA & community: No HOA (N/A)
Exterior
- Parking: Has garage; Oversized garage; 4 parking spaces; Driveway parking
- Utilities: City/County water; City/County sewer; Electric water heater; Electric power
- Home design: Detached traditional home; 2 stories; 2 living levels; Crawl foundation
- Construction: Asphalt shingle roof
- Exterior features: Vinyl siding; Partial fence; Screened porch; Storage shed
Interior
- Kitchen: Electric range; Refrigerator
- Bedrooms: First-floor bedroom (with full bathroom on first floor not present)
- Flooring: Laminate flooring; Wood flooring
- Bathrooms: 2 full bathrooms
- Heating & cooling: Baseboard heating; Window/wall air conditioning
- Interior features: Decorative fireplace; Window treatments; Cable hookup
- Laundry & utility: Washer hookup; Dryer hookup; Utility room; Workshop
Neighborhood map
What this means for you Summary
Snapshot
- This is a 3-bed/2.0-bath single-family listed at $240k.
Deal economics
- At list price, monthly cash flow is $162 ($2k/yr) — positive.
- The deal already cash-flows at list — no discount required.
- To meet the 1% rule (rent ≥ 1% of price), the offer needs to be $220k (8.3% below list).
- Recommended offer: $220k (8.3% below list) — sets the bar for 1% rule.
- Cap rate 7.1% vs local median 3.5% in Suffolk — top-decile yield for the area; either an underpriced asset or a hidden risk that comps aren't pricing in. Stress-test before assuming the spread holds.
Location & tenants
- Location reads 77/100 on livability (#88 in VA, #2,896 nationally) — a middle-class / working-renter tenant base. Strengths: housing A+, health & safety A+, employment A-; Watch: crime C-, commute F.
- Suffolk City Public School District (suburban): math 41% / reading 69% proficiency, ranked #72 of 131 in VA (top 55%) — acceptable for families but not a draw, mixed tenant base, ~2y average lease.
- Zoned schools: Mack Benn Jr. Elementary (math 27% / reading 50%, grade F, #924 of 1,108 statewide, top 84%, 684 students, 66% FRL); King'S Fork High (math 44% / reading 77%, grade C+, #244 of 319 statewide, top 77%, 1,697 students, 63% FRL) — zoned schools average 64% FRL vs 39% district-wide (25 pts higher); higher-poverty schools than district average — tighter screening recommended.
- Market conditions: Rents rising fast (+5.8%/yr); 536 active listings in the ZIP; 8 comparable units currently listed for rent nearby; rentals at typical pace (median 24d on market — plan ~3-4 weeks tenant-placement turnaround); solid renter incomes; 680 units permitted in Suffolk city in 2024 (0 in 5+ unit buildings).
- This rent runs 33% of the median local income ($80k/yr) — at the standard rent-burdened threshold; future hikes will face affordability resistance.
Forward outlook
- Local home prices are declining (-3.0%/yr); year-one equity from $2k of loan paydown is wiped out by about $7k of value loss. Plan a longer hold.
- Suffolk County population projected at +11% by 2050 — modest demand growth; plan on rents tracking national, not racing it.
Negotiation context
- It's been on market 38 days — a 3% lower offer ($233k) is reasonable based on typical stale-listing flexibility.
- 8 sale attempts since 5y ago with the ask held roughly flat each time — persistent listings suggest the price (not the market) is what's stuck; bring a comps-based counter.
Risks & watch-outs
- Watch-outs: built in 1916 — expect roof / HVAC / electrical / plumbing capex.
- Climate carrying-cost: severe wind risk, 80% chance of damaging wind over 30y; extreme-heat days projected 7→16/yr by 2055 (HVAC capex compounding) — expect insurance premiums to compound above CPI over the hold.
Questions for the listing agent
- It's been on market 38 days. Have you received any prior offers? Is the seller open to a 8% concession, seller financing, or rate buy-down credit?
- Built in 1916 — when were the roof, HVAC, electrical panel, plumbing, and water heater last replaced?
- Is there a deadline driving the sale (1031 exchange, divorce, estate, relocation)? That informs how much negotiation room exists.
- Schools are A-rated — typically a magnet for longer-tenancy family renters. What's the average tenant stay here, and is there a school-zone premium baked into asking?
- What's the average days-on-market for RENTAL listings here right now (not sales)? A rising rental-DOM trend means longer vacancies and softer asking-rent achievability than the comps imply.
- What's the recent tenant-quality profile in this submarket — average credit score on applications, eviction rate, late-payment / NSF rate, and stable-employment percentage? A property-management company in the area should have these aggregated.
- How much new for-sale + rental construction is in the pipeline within 1–3 miles? Heavy new supply typically softens prices + rents 12–24 months out; constrained supply supports both.
Investment metrics
- 1% rule
- 0.92% ✗
- Cap rate
- 7.11%
- Cash-on-cash
- 2.90%
- DSCR
- 1.13
- GRM
- 9.1
CMA / ARV
- ARV (median comp)
- $310,000
- List price
- $240,000
- Delta
- -22.58%
- Verdict
- UNDERPRICED
- Comps
- 20 within 1.0 mi
Show comp detail 12 sales within ~0.75 mi
| Address | Dist | Beds/Ba | Sqft | Sold | Price | $/sf | Match |
|---|---|---|---|---|---|---|---|
| 413 Henry St | 0.35mi | 4/2.5 (+1) | 2,194 (+6%) | 5mo | $380,000 | $173 | 62 |
| 217 N Saratoga St | 0.49mi | 3/3.0 | 1,936 (-6%) | 2mo | $297,500 | $154 | 61 |
| 1201 Coastline Ave | 0.51mi | 4/3.5 (+1) | 2,165 (+5%) | 2mo | $362,000 | $167 | 56 |
| 107 Day St | 0.51mi | 3/2.5 | 1,840 (-11%) | 2mo | $310,000 | $168 | 54 |
| 318 Goodman St | 0.68mi | 4/2.5 (+1) | 2,160 (+5%) | 1mo | $365,999 | $169 | 53 |
| 121 Pinner St | 0.53mi | 4/3.5 (+1) | 2,194 (+6%) | 4mo | $255,000 | $116 | 50 |
| 209 Pinner St | 0.45mi | 4/2.5 (+1) | 2,236 (+8%) | 10mo | $340,000 | $152 | 50 |
| 214 Grace St | 0.42mi | 3/2.0 | 1,762 (-15%) | 9mo | $279,900 | $159 | 48 |
| 119 N Lloyd St | 0.74mi | 4/2.5 (+1) | 2,160 (+5%) | 4mo | $365,999 | $169 | 47 |
| 315 Goodman St | 0.66mi | 4/2.5 (+1) | 1,819 (-12%) | 1mo | $355,000 | $195 | 42 |
| 329 Briggs St | 0.69mi | 3/2.5 | 1,840 (-11%) | 9mo | $321,000 | $174 | 40 |
| 208 Beech St | 0.64mi | 3/2.5 | 1,800 (-13%) | 10mo | $324,300 | $180 | 38 |
Match score weights: distance 35% · size 25% · config 20% · recency 20%. Top-matched comps best support the ARV.
Projected returns pro-forma
-3.0% appreciation · 5.84% rent growth · sell at horizon
- IRR
- -8.7%
- Equity multiple
- 0.67×
- Total profit
- $-22,093
- Equity at exit
- $35,785
- IRR
- 4.0%
- Equity multiple
- 1.33×
- Total profit
- $22,146
- Equity at exit
- $20,751
Cash invested: $67,200 (down + closing). Projections, not guarantees.
Landlord ↔ Tenant lean methodology
- Overall (STATE)
- 55 Moderately Landlord-Leaning
- State Virginia
- 55 Moderately Landlord-Leaning · D+2
- County
- — inherits STATE
- City
- — inherits STATE
ZIP-level market 23434
- Rents YoY
- 5.8%
- Active inventory
- 536
- Price-to-rent
- 9.1×
Monthly cashflow live
- Estimated rent
- $2,201 high interval (Pro) →
- Mortgage (P&I)
- −$1,259
- Tax from tax record
- −$217 /mo · $2,610/yr
- Insurance
- −$100
- HOA
- −$0
- Vacancy / Maint / Mgmt
- −$462
- Net cashflow
- $162
Break-even live
UW: 25.0% down · 7.5% · 30yr · 1.5% tax · 5.0% vac · 8.0% maint · 8.0% mgmt
Financing live
Cash to close
- Down payment
- $60,000
- Closing costs
- $7,200
- Reserves months
- —
- Total cash needed
- —
Loan-product check · same deal, 3 products live
Conventional
25% down · 7.5% · 30yr
- Down + closing
- —
- Monthly P&I
- —
- Monthly cashflow
- —
- DSCR
- —
- Eligible?
- —
Personal DTI + credit; lowest rate.
DSCR
20% down · 8.5% · 30yr
- Down + closing
- —
- Monthly P&I
- —
- Monthly cashflow
- —
- DSCR
- —
- Eligible?
- —
No personal income docs; deal must DSCR.
Hard money
10% down · 12.0% · 12mo
- Down + closing
- —
- Monthly P&I
- —
- Monthly cashflow
- —
- DSCR
- —
- Eligible?
- —
Short-term bridge; refi at stabilization.
Rent comps 8 comps
| Address | Beds | Baths | Sqft | Rent | $/sqft | DOM | Units | Dist |
|---|---|---|---|---|---|---|---|---|
| 315 Highland Ave Suffolk, VA | 3.0 | 2.0 | 1580 | $2,050 | $1.30 | 23d | 1 | 0.20mi |
| 307 N 4th St Suffolk, VA | 4.0 | 2.0 | 1600 | $1,800 | $1.12 | 7d | 1 | 0.65mi |
| 124 Halifax St Suffolk, VA | 4.0 | 2.0 | 1728 | $2,100 | $1.22 | 43d | 1 | 0.75mi |
| 223 N 7th St Suffolk, VA | 3.0 | 2.5 | 1495 | $2,300 | $1.54 | 43d | 1 | 0.82mi |
| 621 Butler Ave Suffolk, VA | 3.0 | 2.5 | 1760 | $2,500 | $1.42 | 23d | 1 | 0.93mi |
| 124 Linden Ave Suffolk, VA | 4.0 | 2.5 | 2568 | $2,795 | $1.09 | 43d | 1 | 1.01mi |
| 808 Gittings St Suffolk, VA | 4.0 | 2.5 | 2187 | $2,500 | $1.14 | 23d | 1 | 1.18mi |
| 525 Kilby Ave Suffolk, VA | 3.0 | 2.5 | 1776 | $2,500 | $1.41 | 23d | 1 | 1.42mi |
Listing history 31 events
-
2026-06-18days on market $240,000 Active 38 DOM
-
2026-06-17days on market $240,000 Active 37 DOM
-
2026-06-16days on market $240,000 Active 36 DOM
-
2026-06-15days on market $240,000 Active 35 DOM
-
2026-06-13days on market $240,000 Active 33 DOM
-
2026-06-09days on market $240,000 Active 29 DOM
-
2026-06-08days on market $240,000 Active 28 DOM
-
2026-06-07pricedays on market $240,000 Active 27 DOM
-
2026-06-03days on market $250,000 Active 23 DOM
-
2026-06-02days on market $250,000 Active 22 DOM
-
2026-06-01days on market $250,000 Active 21 DOM
-
2026-05-31days on market $250,000 Active 20 DOM
-
2026-05-11$250,000 Active 729-char remark
-
2022-07-11soldstatus $215,000
-
2022-06-17status Under Contract
-
2022-06-08historical Active Under Contract
-
2022-05-23status Active
-
2022-05-16historical Active Under Contract
-
2022-05-06$215,000 Active
-
2022-03-21historical
-
2022-03-11historical Active Under Contract
-
2022-03-07status Active
-
2022-02-28historical Active Under Contract
-
2022-02-11$212,500 Active
-
2022-02-10historical
-
2022-01-07status Active Under Contract
-
2021-12-31historical
-
2021-11-08price $215,000
-
2021-10-22status Active
-
2021-10-15historical Active Under Contract
-
2021-10-06$220,000 Active
ⓘ Source: listings_history table (triggers on properties + properties_extension) + one-shot
backfill from property_details.listing_events for pre-trigger history.
Tax reassessment forecast VA · Resets to sale price
- Current annual tax
- $2,610 · $217/mo
- Projected year-2 tax
- $2,610 · $217/mo
- Expected delta
- $0/yr ($0/mo · 0.0%)
ⓘ Screening estimate from a state-policy table — verify with the county assessor before closing.
Climate risk First Street
- Flood 1/10 Low FEMA zone X (unshaded) · 0% chance over 30 yrs
- Wildfire 1/10 Low
- Heat 8/10 Severe 7 d/yr ≥107°F today · 16 d/yr by 30 yrs out
- Wind 8/10 Severe 80% chance of damaging wind over 30 yrs
- Air quality 2/10 Low 0 unhealthy d/yr today · 1 by 30 yrs out
Nearby sold comps map
Loading sold comps map…
Walkable amenities ~0.75 mi
Loading nearby amenities…
Taxation est. · year 1
- Rental income
- $26,408
- − Mortgage interest
- −$13,444
- − Property taxes
- −$2,610
- − Insurance
- −$1,200
- − Repairs & maintenance
- −$2,113
- − Management
- −$2,113
- − Depreciation
- −$6,982
- Taxable loss
- −$2,052
- Est. tax savings @ 24.0%
- +$493
- After-tax cash flow
- $2,442/yr
For passive investors: Depreciation is non-cash, so a rental often shows a tax loss while cash-flowing — sheltering income. Rental losses are passive: they offset passive income freely, and up to $25,000/yr can offset ordinary (W-2) income if you actively participate and your MAGI is under $100k (phasing out to $0 by $150k); unused losses carry forward. On sale, claimed depreciation is recaptured at up to 25%, and gains may owe capital-gains tax (a 1031 exchange can defer both). Figures are a year-1 estimate at your 24.0% rate — not tax advice; consult a CPA.
Schools (NCES district)
- District
- Suffolk City Public School District
- NCES district ID
- 5103710
- Math proficiency
- 41% ▼ -43.00%
- Reading proficiency
- 69% ▼ -8.00%
- Median HH income
- $65,573
- Composite
- 48.31/100
- National rank
- #2151
- State rank
- #72 of 131 in VA
Livability — Suffolk
- Score
- 77/100
- State rank
- #88
- US rank
- #2896
Category grades
Schools grade is shown separately in the Schools card above.
Census & demographics
- Census place
- Suffolk, VA
- County
- Suffolk City · 88,108 people
- City population
- 88,108
- Metro
- Virginia Beach-Norfolk-Newport News, VA-NC
- Population (ZIP)
- 54,387
- Household income
- $79,877
- Rent vs Own
- Severe rent burden
- 1934.0
Population outlook (Suffolk County) Hauer SSP2
- Today (2025)
- 95,269 people
- By 2030
- 98,269 · +3.1%
- By 2040
- 103,177 · +8.3%
- By 2050
- 105,777 · +11.0%
- By 2075
- 110,963 · +16.5%
- By 2100
- 103,711 · +8.9%
Race, ethnicity, and origin ACS 2023
- Neighborhood character
- Diverse neighborhood (Simpson 0.58)
- Race & ethnicity
- Black 49% White 41% Two or more races 5% Hispanic / Latino 4% Asian 1%
- Common ancestry
- Lithuanian 1% Slovak 1% Italian 1%
- Foreign-born
- 3% · Canada
- Languages at home
- 96% English-only · Spanish 2%
Political lean MEDSL · Suffolk
- 2024 margin
- D (+15.9) · D 57.4% · R 41.5% · Other 1.2%
- 2008→2024 swing
- +2.7pp toward D · 2008: 13.2pp · 2024: 15.9pp
- All cycles
- 2024: D+15.9 2020: D+17.3 2016: D+13.8 2012: D+15.1 2008: D+13.2
Not yet ingested
- Civics
- —
Market trends
- HPI YoY
- ▼ -383.80%
- Current HPI
- 158.5866
- Rent YoY
- ▲ 5.84%
- Metro
- Virginia Beach-Norfolk-Newport News, VA-NC
- State GDP YoY
- ▲ 2.40%
- F500 in state
- 50
Industry mix (Fortune 500 HQ in VA)
| Industry | F500 HQs | Revenue |
|---|---|---|
| Aerospace / Defense | 4 | $236B |
|
||
| Technology / Defense | 3 | $32B |
|
||
| Financial Services | 2 | $176B |
|
||
| Utilities | 2 | $27B |
|
||
| Insurance | 2 | $25B |
|
||
| Technology | 2 | $15B |
|
||
Price history
+9.1% since first listed20 events — show timeline
- 2026-06-05 Price Changed $240,000 REINMLS
- 2026-05-11 Listed $250,000 REINMLS
- 2022-07-11 Sold (Public Records) $215,000 Public Records
- 2022-06-17 Pending — REINMLS
- 2022-06-08 Contingent — REINMLS
- 2022-05-23 Relisted — REINMLS
- 2022-05-16 Contingent — REINMLS
- 2022-05-06 Listed $215,000 REINMLS
- 2022-03-21 Listing Removed — REINMLS
- 2022-03-11 Contingent — REINMLS
- 2022-03-07 Relisted — REINMLS
- 2022-02-28 Contingent — REINMLS
- 2022-02-11 Listed $212,500 REINMLS
- 2022-02-10 Listing Removed — REINMLS
- 2022-01-07 Relisted — REINMLS
- 2021-12-31 Listing Removed — REINMLS
- 2021-11-08 Price Changed $215,000 REINMLS
- 2021-10-22 Relisted — REINMLS
- 2021-10-15 Contingent — REINMLS
- 2021-10-06 Listed $220,000 REINMLS
Property tax history
+6.6%/yrLatest (2025): $2,610 · +9.7% YoY. Source: county tax records.
Cash-flow waterfall
monthlySold comps — $/sqft
last 12 mo · ≤1 miLoading sold comps…