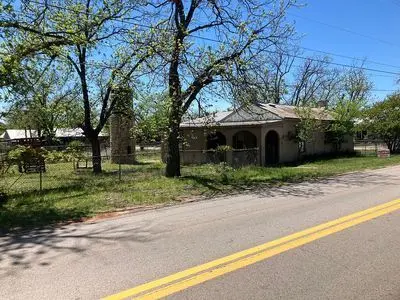
415 El Paso St · Mason, TX
Flood risk 1/10 · Minimal
- FEMA flood zone
- —
- Chance of flooding over 30 yrs
- 0.0%
- Est. flood insurance / yr
- —
Fire risk 7/10 · Major
- Est. fire insurance / yr
- $1,222 – $2,270
Heat risk 7/10 · Major
- Hot days now (above 104°F)
- 7 days/yr
- Hot days in 30 yrs
- 22 days/yr
Wind risk 6/10 · Moderate
- Chance of severe wind over 30 yrs
- 27.0%
Air-quality risk 1/10 · Minimal
- Unhealthy air days now
- 0 days/yr
- Unhealthy air days in 30 yrs
- 0 days/yr
Risk factors via First Street. Map © Google.
Why this score? — see what drove the C+ grade
The composite is a weighted blend of 9 inputs, each scored 0–100. Each bar is that input's sub-score; the figure is the points it added to the 100-point composite (weight × sub-score).
- Cash flow +20.8/30.0
- ARV discount +7.5/15.0
- Appreciation +7.3/10.0
- DSCR +6.6/10.0
- 1% rule +5.5/10.0
- Schools +5.0/10.0
- Livability +3.2/5.0
- Rent growth +2.5/5.0
- Condition / age +2.5/5.0
$95,000
🖨 Deal sheet 📄 Offer letter ✓ Due diligence
Listing remarks
Old Rock home covered with stucco. This was my mothers home and has not been lived in for over 5 years. It is one block west from the Mason square on a farm to market road with a great location. Easy to find. Would make a great B& amp; B or home. Now the bad. .. it has had or still does have termites that have ruined the floors and some of the walls. It needs total restoration inside and out. It does have a fenced yard. and a couple of large pecan trees. Very old standing seem roof that as far as know does not leak. Needs electric, plumbing, and floors Has an older ac but it works. Asking 95,000 but will entertain all offers. This would be an as is purchase with no warranties or guar
Key facts
- Large pecan trees
- Standing seam roof
- Fenced yard
Tags
Neighborhood map
What this means for you Summary
Snapshot
- This is a 3-bed/1.0-bath single-family listed at $95k.
Deal economics
- At list price, monthly cash flow is $130 ($2k/yr) — positive.
- The deal already cash-flows at list — no discount required.
- Meets the 1% rule at list price ($1k rent vs $95k).
- Recommended offer: $92k (3.0% below list) — sets the bar for market timing.
Location & tenants
- Location reads 65/100 on livability (#662 in TX) — a middle-class / working-renter tenant base. Strengths: crime A+, cost of living A+, housing A+; Watch: amenities F, commute F, employment F.
- Mason ISD (rural): math 57% / reading 63% proficiency, ranked #76 of 826 in TX (top 9%) — acceptable for families but not a draw, mixed tenant base, ~2y average lease.
- Market conditions: 99 active listings in the ZIP; 4 units permitted in Mason County in 2024 (0 in 5+ unit buildings).
Forward outlook
- In year one you build about $5k of equity ($657 loan paydown + $4k appreciation (4.6% local appreciation)).
- Mason County population projected to shrink 4% by 2050 — rents likely to lag national; underwrite the cash flow, not the appreciation.
- At projected returns (4.6% appreciation + 3.0% rent growth), your $27k cash investment doubles in ~4 years — after that, you're playing with house money.
- By year 7, paydown + projected appreciation supports a ~$32k cash-out refi (75% LTV) — recoverable capital for the next deal without selling this one.
Negotiation context
- It's been on market 38 days — a 3% lower offer ($92k) is reasonable based on typical stale-listing flexibility.
Risks & watch-outs
- Watch-outs: built in 1900 — expect roof / HVAC / electrical / plumbing capex.
- Climate carrying-cost: major wind risk, 27% chance of damaging wind over 30y; major wildfire risk; extreme-heat days projected 7→22/yr by 2055 (HVAC capex compounding) — expect insurance premiums to compound above CPI over the hold.
Questions for the listing agent
- It's been on market 38 days. Have you received any prior offers? Is the seller open to a 3% concession, seller financing, or rate buy-down credit?
- Built in 1900 — when were the roof, HVAC, electrical panel, plumbing, and water heater last replaced?
- Is there a deadline driving the sale (1031 exchange, divorce, estate, relocation)? That informs how much negotiation room exists.
- What's the average days-on-market for RENTAL listings here right now (not sales)? A rising rental-DOM trend means longer vacancies and softer asking-rent achievability than the comps imply.
- What's the recent tenant-quality profile in this submarket — average credit score on applications, eviction rate, late-payment / NSF rate, and stable-employment percentage? A property-management company in the area should have these aggregated.
- How much new for-sale + rental construction is in the pipeline within 1–3 miles? Heavy new supply typically softens prices + rents 12–24 months out; constrained supply supports both.
Investment metrics
- 1% rule
- 1.05% ✓
- Cap rate
- 7.93%
- Cash-on-cash
- 5.85%
- DSCR
- 1.26
- GRM
- 7.9
CMA / ARV
No comps found within radius.
Projected returns pro-forma
4.62% appreciation · 3.0% rent growth · sell at horizon
- IRR
- 17.0%
- Equity multiple
- 2.06×
- Total profit
- $28,134
- Equity at exit
- $51,670
- IRR
- 17.4%
- Equity multiple
- 3.97×
- Total profit
- $78,971
- Equity at exit
- $87,434
Cash invested: $26,600 (down + closing). Projections, not guarantees.
Landlord ↔ Tenant lean methodology
- Overall (STATE)
- 87 Strongly Landlord-Friendly
- State Texas
- 87 Strongly Landlord-Friendly · R+5
- County
- — inherits STATE
- City
- — inherits STATE
ZIP-level market 76856
- Home prices YoY
- 2.3%
- Active inventory
- 99
- Price-to-rent
- 7.9×
Monthly cashflow live
- Estimated rent
- $1,001 medium interval (Pro) →
- Mortgage (P&I)
- −$498
- Tax from tax record
- −$124 /mo · $1,484/yr
- Insurance
- −$40
- HOA
- −$0
- Vacancy / Maint / Mgmt
- −$210
- Net cashflow
- $130
Break-even live
UW: 25.0% down · 7.5% · 30yr · 1.5% tax · 5.0% vac · 8.0% maint · 8.0% mgmt
Financing live
Cash to close
- Down payment
- $23,750
- Closing costs
- $2,850
- Reserves months
- —
- Total cash needed
- —
Loan-product check · same deal, 3 products live
Conventional
25% down · 7.5% · 30yr
- Down + closing
- —
- Monthly P&I
- —
- Monthly cashflow
- —
- DSCR
- —
- Eligible?
- —
Personal DTI + credit; lowest rate.
DSCR
20% down · 8.5% · 30yr
- Down + closing
- —
- Monthly P&I
- —
- Monthly cashflow
- —
- DSCR
- —
- Eligible?
- —
No personal income docs; deal must DSCR.
Hard money
10% down · 12.0% · 12mo
- Down + closing
- —
- Monthly P&I
- —
- Monthly cashflow
- —
- DSCR
- —
- Eligible?
- —
Short-term bridge; refi at stabilization.
Listing history 17 events
-
2026-06-19days on market $95,000 Active 38 DOM
-
2026-06-18days on market $95,000 Active 37 DOM
-
2026-06-17days on market $95,000 Active 36 DOM
-
2026-06-16days on market $95,000 Active 35 DOM
-
2026-06-15days on market $95,000 Active 34 DOM
-
2026-06-14days on market $95,000 Active 32 DOM
-
2026-06-12days on market $95,000 Active 31 DOM
-
2026-06-09days on market $95,000 Active 28 DOM
-
2026-06-08days on market $95,000 Active 27 DOM
-
2026-06-07days on market $95,000 Active 26 DOM
-
2026-06-07days on market $95,000 Active 25 DOM
-
2026-06-03days on market $95,000 Active 22 DOM
-
2026-06-02days on market $95,000 Active 21 DOM
-
2026-06-01days on market $95,000 Active 20 DOM
-
2026-05-31days on market $95,000 Active 19 DOM
-
2026-05-30days on market $95,000 Active 18 DOM
-
2026-05-12$95,000 Active 870-char remark
ⓘ Source: listings_history table (triggers on properties + properties_extension) + one-shot
backfill from property_details.listing_events for pre-trigger history.
Tax reassessment forecast TX · Resets to sale price
- Current annual tax
- $1,484 · $124/mo
- Projected year-2 tax
- $1,738 · $145/mo
- Expected delta
- +$254/yr (+$21/mo · 17.1%)
ⓘ Screening estimate from a state-policy table — verify with the county assessor before closing.
Climate risk First Street
- Flood 1/10 Low 0% chance over 30 yrs
- Wildfire 7/10 Severe
- Heat 7/10 Severe 7 d/yr ≥104°F today · 22 d/yr by 30 yrs out
- Wind 6/10 Major 27% chance of damaging wind over 30 yrs
- Air quality 1/10 Low 0 unhealthy d/yr today · 0 by 30 yrs out
Nearby sold comps map
Loading sold comps map…
Walkable amenities ~0.75 mi
Loading nearby amenities…
Taxation est. · year 1
- Rental income
- $12,016
- − Mortgage interest
- −$5,321
- − Property taxes
- −$1,484
- − Insurance
- −$475
- − Repairs & maintenance
- −$961
- − Management
- −$961
- − Depreciation
- −$2,764
- Taxable income
- $49
- Est. tax owed @ 24.0%
- −$12
- After-tax cash flow
- $1,544/yr
For passive investors: Depreciation is non-cash, so a rental often shows a tax loss while cash-flowing — sheltering income. Rental losses are passive: they offset passive income freely, and up to $25,000/yr can offset ordinary (W-2) income if you actively participate and your MAGI is under $100k (phasing out to $0 by $150k); unused losses carry forward. On sale, claimed depreciation is recaptured at up to 25%, and gains may owe capital-gains tax (a 1031 exchange can defer both). Figures are a year-1 estimate at your 24.0% rate — not tax advice; consult a CPA.
Schools (NCES district)
- District
- Mason ISD
- NCES district ID
- 4829280
- Math proficiency
- 57% ▲ 2.00%
- Reading proficiency
- 63% ▲ 1.00%
- Median HH income
- $40,797
- Composite
- 50.18/100
- National rank
- #1898
- State rank
- #76 of 826 in TX
Livability — Mason
- Score
- 65/100
- State rank
- #662
- US rank
- #12456
Category grades
Schools grade is shown separately in the Schools card above.
Census & demographics
- Census place
- Mason, TX
- Population (ZIP)
- 3,525
Population outlook (Mason County) Hauer SSP2
- Today (2025)
- 3,979 people
- By 2030
- 3,930 · -1.2%
- By 2040
- 3,836 · -3.6%
- By 2050
- 3,838 · -3.5%
- By 2075
- 4,230 · +6.3%
- By 2100
- 4,260 · +7.1%
Race, ethnicity, and origin ACS 2023
- Neighborhood character
- Predominantly White (76%)
- Race & ethnicity
- White 76% Hispanic / Latino 23% Two or more races 8%
- Hispanic origin (detail)
- Mexican 23%
- Common ancestry
- Lithuanian 4% Slovak 2% Italian 2%
- Foreign-born
- 4% · Canada
- Languages at home
- 81% English-only · Spanish 18% Other Indo-European 1%
Political lean MEDSL · Mason
- 2024 margin
- Solid R (+65.0) · D 17.2% · R 82.2%
- 2008→2024 swing
- -18.0pp toward R · 2008: -47.1pp · 2024: -65.0pp
- All cycles
- 2024: R+65.0 2020: R+62.0 2016: R+63.5 2012: R+60.1 2008: R+47.1
Not yet ingested
- Civics
- —
Market trends
- HPI YoY
- ▲ 4.62%
- Current HPI
- 206.7593
- Rent YoY
- —
- Metro
- —
- State GDP YoY
- ▲ 3.95%
- F500 in state
- 110
Industry mix (Fortune 500 HQ in TX)
| Industry | F500 HQs | Revenue |
|---|---|---|
| Energy | 16 | $1,198B |
|
||
| Technology | 5 | $198B |
|
||
| Engineering / Construction | 4 | $72B |
|
||
| Energy Services | 3 | $60B |
|
||
| Utilities | 3 | $41B |
|
||
| Healthcare | 2 | $330B |
|
||
Price history
1 event — show timeline
- 2026-05-12 Listed $95,000 FSBO.com
Property tax history
+0.1%/yrLatest (2025): $1,484 · -14.4% YoY. Source: county tax records.
Cash-flow waterfall
monthlySold comps — $/sqft
last 12 mo · ≤1 miLoading sold comps…