404 Midway St · Midfield, AL
Flood risk 1/10 · Minimal
- FEMA flood zone
- X (unshaded)
- Chance of flooding over 30 yrs
- 0.0%
- Est. flood insurance / yr
- $507 – $1,088
Fire risk 1/10 · Minimal
- Est. fire insurance / yr
- $916 – $1,700
Heat risk 6/10 · Moderate
- Hot days now (above 108°F)
- 7 days/yr
- Hot days in 30 yrs
- 19 days/yr
Wind risk 6/10 · Moderate
- Chance of severe wind over 30 yrs
- 27.0%
Air-quality risk 4/10 · Minor
- Unhealthy air days now
- 5 days/yr
- Unhealthy air days in 30 yrs
- 5 days/yr
Risk factors via First Street. Map © Google.
Why this score? — see what drove the C grade
The composite is a weighted blend of 9 inputs, each scored 0–100. Each bar is that input's sub-score; the figure is the points it added to the 100-point composite (weight × sub-score).
- Cash flow +24.8/30.0
- ARV discount +9.0/15.0
- DSCR +8.0/10.0
- 1% rule +6.5/10.0
- Livability +3.2/5.0
- Appreciation +2.6/10.0
- Condition / age +2.5/5.0
- Rent growth +2.1/5.0
- Schools +0.7/10.0
$99,900
🖨 Deal sheet 📄 Offer letter ✓ Due diligence
Listing remarks MLS
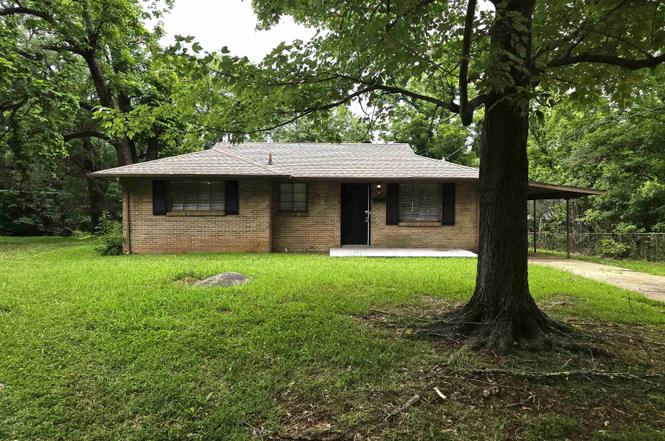
Three bedroom home located in Midfield; great curb appeal. Level lot with flat backyard. Great home for an investor or do it yourself individual
Key facts
- 0.28 acre lot
- Built 1954
- Listed 4 days
Neighborhood map
What this means for you Summary
Snapshot
- This is a 3-bed/1.0-bath single-family listed at $100k.
Deal economics
- At list price, monthly cash flow is $210 ($3k/yr) — positive.
- The deal already cash-flows at list — no discount required.
- Meets the 1% rule at list price ($1k rent vs $100k).
Location & tenants
- Location reads 64/100 on livability (#164 in AL) — a middle-class / working-renter tenant base. Strengths: commute A+, cost of living A+, housing A+; Watch: amenities F, employment F, health & safety F.
- Midfield City (suburban): math 2% / reading 14% proficiency, ranked #126 of 129 in AL (top 98%) — low school quality limits family demand, transient renter base, plan for 1-2y turnover; 83% free/reduced lunch — lower-income household profile, screen leases tightly.
- Zoned schools: Midfield Elementary School (math 2% / reading 17%, grade F, #568 of 627 statewide, top 94%, 390 students, 84% FRL); Midfield High School (math 2% / reading 2%, grade F, #291 of 305 statewide, top 100%, 340 students, 87% FRL) — zoned schools at 86% FRL track the district average.
- Market conditions: Rents soft (-1.5%/yr); 87 active listings in the ZIP; 40 comparable units currently listed for rent nearby; rentals lingering (median 44d on market — plan ~5-8 weeks vacancy on turnover, expect pricing pressure); 60% of comp listings sitting > 30 days — soft ceiling on asking rent; 2,114 units permitted in Jefferson County in 2024 (556 in 5+ unit buildings).
Forward outlook
- Local home prices are declining (-3.0%/yr); year-one equity from $691 of loan paydown is wiped out by about $3k of value loss. Plan a longer hold.
- Jefferson County population projected to shrink 4% by 2050 — rents likely to lag national; underwrite the cash flow, not the appreciation.
Negotiation context
- Only 4 days on market — expect competitive offers; lowballing is unlikely to land.
- 2 sale attempts since 13y ago with the ask held roughly flat each time — persistent listings suggest the price (not the market) is what's stuck; bring a comps-based counter.
Risks & watch-outs
- Watch-outs: built in 1954 — expect roof / HVAC / electrical / plumbing capex.
- Climate carrying-cost: major wind risk, 27% chance of damaging wind over 30y; extreme-heat days projected 7→19/yr by 2055 (HVAC capex compounding) — expect insurance premiums to compound above CPI over the hold.
Questions for the listing agent
- Built in 1954 — when were the roof, HVAC, electrical panel, plumbing, and water heater last replaced?
- Is there a deadline driving the sale (1031 exchange, divorce, estate, relocation)? That informs how much negotiation room exists.
- Schools are F-rated, which usually means shorter tenancies and higher turnover. Who's the typical renter profile here, and what's been the actual vacancy rate?
- What's the average days-on-market for RENTAL listings here right now (not sales)? A rising rental-DOM trend means longer vacancies and softer asking-rent achievability than the comps imply.
- What's the recent tenant-quality profile in this submarket — average credit score on applications, eviction rate, late-payment / NSF rate, and stable-employment percentage? A property-management company in the area should have these aggregated.
- How much new for-sale + rental construction is in the pipeline within 1–3 miles? Heavy new supply typically softens prices + rents 12–24 months out; constrained supply supports both.
Investment metrics
- 1% rule
- 1.15% ✓
- Cap rate
- 8.82%
- Cash-on-cash
- 9.02%
- DSCR
- 1.40
- GRM
- 7.2
CMA / ARV
- ARV (on-the-fly)
- $103,320
- Comps found
- 12
Show comp detail 12 sales within ~0.75 mi
| Address | Dist | Beds/Ba | Sqft | Sold | Price | $/sf | Match |
|---|---|---|---|---|---|---|---|
| 1240 Rayfield Dr | 0.10mi | 3/1.0 | 1,192 (-3%) | 2mo | $75,313 | $63 | 88 |
| 1412 Woodward Rd | 0.24mi | 3/1.0 | 1,220 (-1%) | 2mo | $65,000 | $53 | 86 |
| 1356 Woodward Rd | 0.14mi | 3/1.0 | 1,164 (-5%) | 1mo | $98,000 | $84 | 84 |
| 1205 Brighton Rd | 0.37mi | 3/1.5 | 1,147 (-7%) | 3mo | $93,000 | $81 | 68 |
| 913 Daniel Cir | 0.35mi | 3/1.5 | 1,317 (+7%) | 6mo | $75,000 | $57 | 65 |
| 349 Midwood Ave | 0.16mi | 4/2.0 (+1) | 1,160 (-6%) | 12mo | $165,000 | $142 | 64 |
| 6632 Avenue K | 0.40mi | 3/2.0 | 1,161 (-6%) | 11mo | $97,500 | $84 | 59 |
| 1409 66th St W | 0.67mi | 3/1.5 | 1,161 (-6%) | 4mo | $95,000 | $82 | 54 |
| 6633 Avenue | 0.54mi | 3/2.0 | 1,107 (-10%) | 2mo | $99,900 | $90 | 52 |
| 6636 Avenue | 0.51mi | 3/2.0 | 1,134 (-8%) | 9mo | $165,000 | $146 | 52 |
| 1417 Brighton Rd | 0.55mi | 3/1.5 | 1,048 (-15%) | 6mo | $110,000 | $105 | 43 |
| 1432 Brighton Rd | 0.63mi | 3/2.0 | 1,062 (-14%) | 11mo | $89,900 | $85 | 35 |
Match score weights: distance 35% · size 25% · config 20% · recency 20%. Top-matched comps best support the ARV.
Projected returns pro-forma
-3.0% appreciation · 0.0% rent growth · sell at horizon
- IRR
- -6.1%
- Equity multiple
- 0.78×
- Total profit
- $-6,143
- Equity at exit
- $14,895
- IRR
- -0.6%
- Equity multiple
- 0.96×
- Total profit
- $-1,043
- Equity at exit
- $8,638
Cash invested: $27,972 (down + closing). Projections, not guarantees.
Landlord ↔ Tenant lean methodology
- Overall (STATE)
- 90 Strongly Landlord-Friendly
- State Alabama
- 90 Strongly Landlord-Friendly · R+15
- County
- — inherits STATE
- City
- — inherits STATE
ZIP-level market 35228
- Home prices YoY
- -3.5%
- Rents YoY
- -1.5%
- Active inventory
- 87
- Price-to-rent
- 7.2×
Monthly cashflow live
- Estimated rent
- $1,151 high interval (Pro) →
- Mortgage (P&I)
- −$524
- Tax from tax record
- −$133 /mo · $1,600/yr
- Insurance
- −$42
- HOA
- −$0
- Vacancy / Maint / Mgmt
- −$242
- Net cashflow
- $210
Break-even live
UW: 25.0% down · 7.5% · 30yr · 1.5% tax · 5.0% vac · 8.0% maint · 8.0% mgmt
Financing live
Cash to close
- Down payment
- $24,975
- Closing costs
- $2,997
- Reserves months
- —
- Total cash needed
- —
Loan-product check · same deal, 3 products live
Conventional
25% down · 7.5% · 30yr
- Down + closing
- —
- Monthly P&I
- —
- Monthly cashflow
- —
- DSCR
- —
- Eligible?
- —
Personal DTI + credit; lowest rate.
DSCR
20% down · 8.5% · 30yr
- Down + closing
- —
- Monthly P&I
- —
- Monthly cashflow
- —
- DSCR
- —
- Eligible?
- —
No personal income docs; deal must DSCR.
Hard money
10% down · 12.0% · 12mo
- Down + closing
- —
- Monthly P&I
- —
- Monthly cashflow
- —
- DSCR
- —
- Eligible?
- —
Short-term bridge; refi at stabilization.
Rent comps 40 comps
| Address | Beds | Baths | Sqft | Rent | $/sqft | DOM | Units | Dist |
|---|---|---|---|---|---|---|---|---|
| 408 Midway St Birmingham, AL | 3.0 | 1.0 | 1301 | $1,075 | $0.83 | 19d | 1 | 0.01mi |
| 1376 Creel Ct Birmingham, AL | 3.0 | 1.0 | 1008 | $1,000 | $0.99 | 43d | 1 | 0.11mi |
| 1112 S Gale Dr Birmingham, AL | 3.0 | 1.5 | 1053 | $1,175 | $1.12 | 43d | 1 | 0.20mi |
| 1441 Creel St Birmingham, AL | 3.0 | 2.0 | 1319 | $1,275 | $0.97 | 3d | 1 | 0.20mi |
| 1412 Woodward Rd Birmingham, AL | 3.0 | 1.0 | 1220 | $1,203 | $0.99 | 16d | 1 | 0.24mi |
| 340 McPherson Ave Birmingham, AL | 2.0 | 1.0 | 924 | $910 | $0.98 | 43d | 1 | 0.26mi |
| 336 McPherson Ave Birmingham, AL | 3.0 | 1.0 | 1094 | $1,100 | $1.01 | 23d | 1 | 0.26mi |
| 1433 Rayfield Dr Birmingham, AL | 3.0 | 1.0 | 1064 | $950 | $0.89 | 43d | 1 | 0.27mi |
| 373 Belcher Dr Birmingham, AL | 4.0 | 1.0 | 1255 | $1,100 | $0.88 | 43d | 1 | 0.28mi |
| 913 Daniel Cir Birmingham, AL | 4.0 | 2.0 | 1317 | $1,300 | $0.99 | 43d | 1 | 0.35mi |
| 1417 Brighton Rd Birmingham, AL | 3.0 | 2.0 | 1048 | $1,200 | $1.15 | 43d | 1 | 0.55mi |
| 120 Parkwood St Birmingham, AL | 3.0 | 1.5 | 1224 | $1,150 | $0.94 | 16d | 1 | 0.57mi |
| 1272 Meadow Ln Birmingham, AL | 2.0 | 1.0 | 744 | $800 | $1.08 | 43d | 1 | 0.70mi |
| 537 Grant St Birmingham, AL | 3.0 | 1.0 | 1444 | $1,200 | $0.83 | 23d | 1 | 0.78mi |
| 517 Grant St Birmingham, AL | 3.0 | 1.0 | 912 | $850 | $0.93 | 23d | 1 | 0.80mi |
| 1721 Collier Dr Birmingham, AL | 2.0 | 1.0 | 925 | $800 | $0.86 | 43d | 1 | 0.80mi |
| 3729 Maple Ave SW Birmingham, AL | 3.0 | 2.0 | 1008 | $1,200 | $1.19 | 43d | 1 | 0.82mi |
| 3736 Oak Ave SW Birmingham, AL | 3.0 | 2.0 | 984 | $1,050 | $1.07 | 23d | 1 | 0.83mi |
| 3400 Walnut Ave SW Birmingham, AL | 3.0 | 1.0 | 1133 | $1,200 | $1.06 | 43d | 1 | 0.89mi |
| 3417 Park Ave SW Birmingham, AL | 4.0 | 1.0 | 1402 | $900 | $0.64 | 43d | 1 | 0.89mi |
| 1341 Pineview Rd Birmingham, AL | 4.0 | 2.0 | 1409 | $1,300 | $0.92 | 43d | 1 | 0.89mi |
| 3616 Maple Ave SW Birmingham, AL | 2.0 | 1.0 | 1488 | $950 | $0.64 | 43d | 1 | 0.89mi |
| 502 64th St Fairfield, AL | 3.0 | 1.0 | 1250 | $695 | $0.56 | 43d | 1 | 0.91mi |
| 3332 Walnut Ave SW Birmingham, AL | 3.0 | 1.0 | 1339 | $750 | $0.56 | 19d | 1 | 0.91mi |
| 1340 Pineview Rd Birmingham, AL | 3.0 | 2.0 | 1116 | $1,075 | $0.96 | 43d | 1 | 0.92mi |
| 3729 Pine Ave SW Birmingham, AL | 3.0 | 1.0 | 1067 | $1,100 | $1.03 | 21d | 1 | 0.93mi |
| 5710 Monte Sano Dr Birmingham, AL | 2.0 | 1.0 | 700 | $950 | $1.36 | 43d | 1 | 1.01mi |
| 5709 Court H Birmingham, AL | 4.0 | 1.5 | 1455 | $1,400 | $0.96 | 1d | 1 | 1.01mi |
| 435 62nd St Fairfield, AL | 3.0 | 2.0 | 1249 | $985 | $0.79 | 43d | 1 | 1.02mi |
| 4029 Walnut Ave SW Birmingham, AL | 2.0 | 1.0 | 1300 | $1,369 | $1.05 | 3d | 1 | 1.02mi |
| 5712 Monte Sano Rd Birmingham, AL | 2.0 | 1.0 | 700 | $900 | $1.29 | 43d | 1 | 1.02mi |
| 704 61st St Fairfield, AL | 3.0 | 1.0 | 1184 | $1,050 | $0.89 | 23d | 1 | 1.02mi |
| 2804 32nd Way SW Birmingham, AL | 3.0 | 1.0 | 840 | $900 | $1.07 | 43d | 1 | 1.07mi |
| 2805 32nd Way SW Birmingham, AL | 3.0 | 1.0 | 792 | $900 | $1.14 | 43d | 1 | 1.09mi |
| 5808 Court O Birmingham, AL | 3.0 | 1.5 | 1227 | $1,100 | $0.90 | 43d | 1 | 1.11mi |
| 125 Jerry Coleman St Fairfield, AL | 2.0 | 1.0 | 715 | $725 | $1.01 | 43d | 1 | 1.14mi |
| 2300 31st St SW Unit ENSLEY2316 A Birmingham, AL | 2.0 | 1.0 | 750 | $1,000 | $1.33 | 3d | 1 | 1.15mi |
| 5725 Avenue O Unit O Birmingham, AL | 3.0 | 1.0 | 957 | $1,073 | $1.12 | 23d | 1 | 1.15mi |
| 1012 33rd St SW Birmingham, AL | 1.0–2.0 | 1.0–2.0 | 800 | $750 | $0.94 | 3d | 1 | 1.15mi |
| 5503 Myron Massey Blvd Fairfield, AL | 3.0 | 2.0 | 1119 | $1,200 | $1.07 | 43d | 1 | 1.16mi |
Listing history 7 events
-
2025-06-24soldstatus $97,500
-
2025-06-12status Pending
-
2025-06-08$99,900 Active
-
2013-07-19soldstatus $45,000
-
2013-06-27soldstatus $15,500 144-char remark
Show marketing remark (144 chars)
Three bedroom home located in Midfield; great curb appeal. Level lot with flat backyard. Great home for an investor or do it yourself individual
-
2013-04-18$17,900 144-char remark
Show marketing remark (144 chars)
Three bedroom home located in Midfield; great curb appeal. Level lot with flat backyard. Great home for an investor or do it yourself individual
-
2006-07-07soldstatus $69,500
ⓘ Source: listings_history table (triggers on properties + properties_extension) + one-shot
backfill from property_details.listing_events for pre-trigger history.
Tax reassessment forecast AL · Resets to sale price
- Current annual tax
- $1,600 · $133/mo
- Projected year-2 tax
- $1,600 · $133/mo
- Expected delta
- $0/yr ($0/mo · 0.0%)
ⓘ Screening estimate from a state-policy table — verify with the county assessor before closing.
Climate risk First Street
- Flood 1/10 Low FEMA zone X (unshaded) · 0% chance over 30 yrs
- Wildfire 1/10 Low
- Heat 6/10 Major 7 d/yr ≥108°F today · 19 d/yr by 30 yrs out
- Wind 6/10 Major 27% chance of damaging wind over 30 yrs
- Air quality 4/10 Moderate 5 unhealthy d/yr today · 5 by 30 yrs out
Nearby sold comps map
Loading sold comps map…
Walkable amenities ~0.75 mi
Loading nearby amenities…
Taxation est. · year 1
- Rental income
- $13,811
- − Mortgage interest
- −$5,596
- − Property taxes
- −$1,600
- − Insurance
- −$500
- − Repairs & maintenance
- −$1,105
- − Management
- −$1,105
- − Depreciation
- −$2,906
- Taxable income
- $999
- Est. tax owed @ 24.0%
- −$240
- After-tax cash flow
- $2,284/yr
For passive investors: Depreciation is non-cash, so a rental often shows a tax loss while cash-flowing — sheltering income. Rental losses are passive: they offset passive income freely, and up to $25,000/yr can offset ordinary (W-2) income if you actively participate and your MAGI is under $100k (phasing out to $0 by $150k); unused losses carry forward. On sale, claimed depreciation is recaptured at up to 25%, and gains may owe capital-gains tax (a 1031 exchange can defer both). Figures are a year-1 estimate at your 24.0% rate — not tax advice; consult a CPA.
Schools (NCES district)
- District
- Midfield City
- NCES district ID
- 0102350
- Math proficiency
- 2% ▼ -18.00%
- Reading proficiency
- 14% ▼ -5.00%
- Median HH income
- $39,267
- Composite
- 6.89/100
- National rank
- #9978
- State rank
- #126 of 129 in AL
Livability — Midfield
- Score
- 64/100
- State rank
- #164
- US rank
- #14536
Category grades
Schools grade is shown separately in the Schools card above.
Census & demographics
- Census place
- Midfield, AL
- County
- Jefferson County · 527,445 people
- City population
- 10,216
- Metro
- Birmingham-Hoover, AL
- Population (ZIP)
- 10,216
- Household income
- $50,815
- Rent vs Own
- Severe rent burden
- 456.0
Population outlook (Jefferson County) Hauer SSP2
- Today (2025)
- 669,185 people
- By 2030
- 669,694 · +0.1%
- By 2040
- 661,388 · -1.2%
- By 2050
- 643,086 · -3.9%
- By 2075
- 577,267 · -13.7%
- By 2100
- 474,758 · -29.1%
Race, ethnicity, and origin ACS 2023
- Neighborhood character
- Predominantly Black (89%)
- Race & ethnicity
- Black 89% Hispanic / Latino 5% Two or more races 5% White 5%
- Foreign-born
- 2% · Canada
- Languages at home
- 95% English-only · Spanish 5%
Political lean MEDSL · Jefferson
- 2024 margin
- D (+10.4) · D 54.6% · R 44.2% · Other 1.2%
- 2008→2024 swing
- +5.4pp toward D · 2008: 5.1pp · 2024: 10.4pp
- All cycles
- 2024: D+10.4 2020: D+13.2 2016: D+7.2 2012: D+6.0 2008: D+5.1
Not yet ingested
- Civics
- —
Market trends
- HPI YoY
- ▼ -4.84%
- Current HPI
- 134.8633
- Rent YoY
- ▼ -1.47%
- Metro
- Birmingham-Hoover, AL
- State GDP YoY
- ▲ 2.94%
- F500 in state
- 4
Industry mix (Fortune 500 HQ in AL)
| Industry | F500 HQs | Revenue |
|---|---|---|
| Financial Services | 1 | $8B |
|
||
| Healthcare | 1 | $5B |
|
||
Price history
+40.3% since first listed7 events — show timeline
- 2025-06-24 Sold (Public Records) $97,500 Public Records
- 2025-06-12 Pending — Greater Alabama MLS
- 2025-06-08 Listed $99,900 Greater Alabama MLS
- 2013-07-19 Sold (Public Records) $45,000 Public Records
- 2013-06-27 Sold (MLS) $15,500 Greater Alabama MLS
- 2013-04-18 Listed $17,900 Greater Alabama MLS
- 2006-07-07 Sold (Public Records) $69,500 Public Records
Property tax history
+4.5%/yrLatest (2025): $1,600 · +6.9% YoY. Source: county tax records.
Cash-flow waterfall
monthlySold comps — $/sqft
last 12 mo · ≤1 miLoading sold comps…