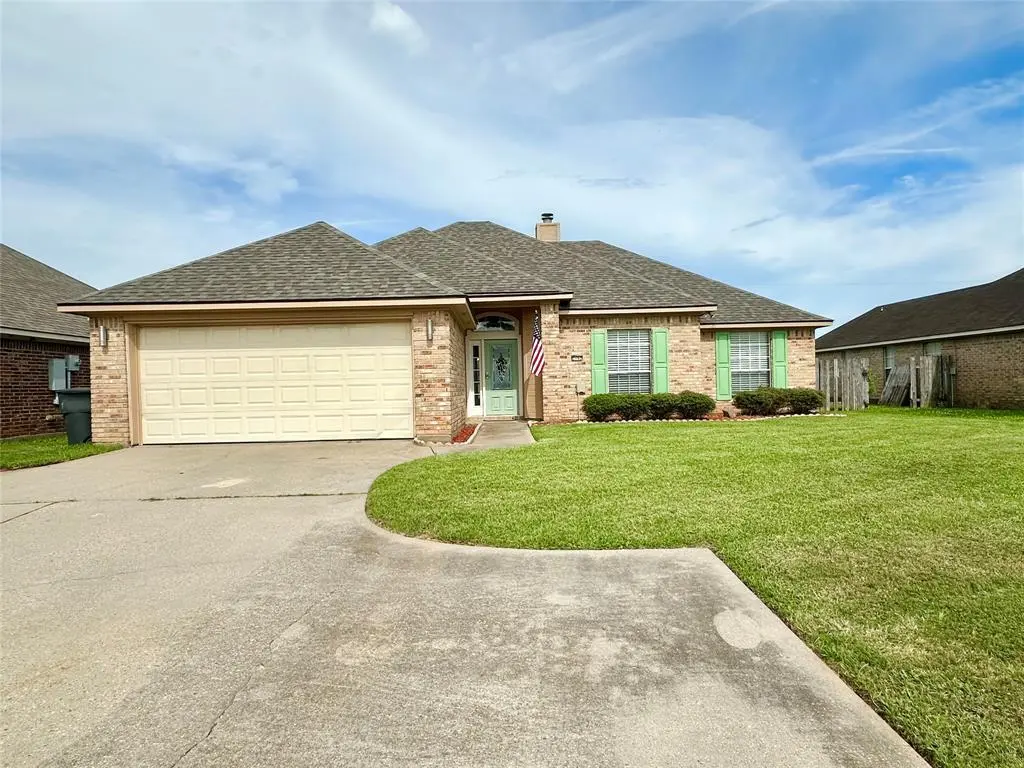
2192 Stockwell Rd · Bossier City, LA
Flood risk 1/10 · Minimal
- FEMA flood zone
- X (shaded)
- Chance of flooding over 30 yrs
- 0.0%
- Est. flood insurance / yr
- $507 – $1,088
Fire risk 3/10 · Minor
- Est. fire insurance / yr
- $1,269 – $2,357
Heat risk 7/10 · Major
- Hot days now (above 110°F)
- 7 days/yr
- Hot days in 30 yrs
- 22 days/yr
Wind risk 6/10 · Moderate
- Chance of severe wind over 30 yrs
- 70.0%
Air-quality risk 2/10 · Minimal
- Unhealthy air days now
- 1 days/yr
- Unhealthy air days in 30 yrs
- 1 days/yr
Risk factors via First Street. Map © Google.
Why this score? — see what drove the D grade
The composite is a weighted blend of 9 inputs, each scored 0–100. Each bar is that input's sub-score; the figure is the points it added to the 100-point composite (weight × sub-score).
- Cash flow +13.8/30.0
- ARV discount +6.8/15.0
- DSCR +4.2/10.0
- Rent growth +4.1/5.0
- Schools +3.8/10.0
- Livability +3.6/5.0
- 1% rule +2.9/10.0
- Condition / age +2.5/5.0
- Appreciation +0.0/10.0
$267,000
🖨 Deal sheet (PDF) 📄 Offer letter ✓ Due diligence
Listing remarks MLS
PRICE IMPROVEMENT! Welcome to this exceptional 4-bedroom, 2-bathroom home In Stockwell Place! Step into the open floor plan creating a spacious and inviting atmosphere. The remote primary bedroom offers a private sanctuary with an en-suite bathroom featuring a whirlpool tub and a separate shower, providing a blissful retreat. The kitchen features granite countertops and a convenient bar area for entertaining. Conveniently located near Barksdale AFB, shopping, restaurants, and major interstates, this home provides unparalleled convenience. Excellent schools in the area ensure a top-notch education! Indulge in outdoor relaxation on the covered back patio, complete with a gas connection for grilling and gatherings. No back yard neighbors, ensuring privacy and serenity. This home presents an exceptional blend of comfort, style, and convenience, offering an ideal living experience. Don't miss out on the opportunity to make this extraordinary property yours. No flood insurance required!
Key facts
- Open floor plan
- Fairly new roof
- New water heater
Tags
Property features AI
Finance
- HOA & community: No association
Exterior
- Parking: Attached 2-car garage with garage door opener; Covered parking for 2 vehicles; Additional parking, concrete driveway, enclosed parking; garage faces front
- Utilities: City water; City sewer; No municipal utility district
- Home design: Single family residence; One story; Built in 2003; Residential property
- Construction: Year built 2003
- Exterior features: Lot less than 0.5 acre (approximately 0.226 acres); Subdivision: Stockwell Place Un 10
Interior
- Kitchen: Dishwasher; Electric range; Eat-in kitchen; Granite counters
- Bedrooms: 4 bedrooms total; Primary bedroom on main level with ensuite bath, dual sinks, separate shower, separate vanities, and walk-in closet
- Bathrooms: 2 full bathrooms
- Interior features: Built-in features; Cable TV available; Chandelier and decorative lighting; Eat-in kitchen; Granite counters; High-speed internet available; One living area; One dining area; Gas fireplace in living area
- Laundry & utility: Washer/dryer hookups available
Neighborhood map
What this means for you Summary
Snapshot
- This is a 4-bed/2.0-bath single-family listed at $267k.
Deal economics
- At list price, monthly cash flow is $24 ($286/yr) — positive.
- The deal already cash-flows at list — no discount required.
- To meet the 1% rule (rent ≥ 1% of price), the offer needs to be $211k (20.8% below list).
- Recommended offer: $211k (20.8% below list) — sets the bar for 1% rule.
- Cap rate 6.4% vs local median 4.7% in Bossier City — top-decile yield for the area; either an underpriced asset or a hidden risk that comps aren't pricing in. Stress-test before assuming the spread holds.
Location & tenants
- Location reads 71/100 on livability (#47 in LA) — a middle-class / working-renter tenant base. Strengths: commute A+, cost of living A+, housing A+; Watch: employment D+, crime F, amenities F.
- Bossier Parish (urban): math 40% / reading 47% proficiency, ranked #17 of 98 in LA (top 17%) — families likely to look elsewhere, expect single-tenant / working-renter base with shorter leases.
- Zoned schools: Stockwell Place Elementary School (math 72% / reading 67%, grade A-, #27 of 646 statewide, top 5%, 594 students, 45% FRL); Cope Middle School (math 42% / reading 54%, grade C-, #35 of 218 statewide, top 16%, 836 students, 58% FRL); Airline High School (math 49% / reading 56%, grade C-, #30 of 265 statewide, top 12%, 2,021 students, 56% FRL).
- Zoned-school proficiency averages 57% at this address vs 44% district-wide (+13 pts) — the actual schools serving this property are materially stronger than the Bossier Parish average implies; a family-tenant draw the district grade alone would hide.
- Market conditions: Rents rising fast (+6.6%/yr); 426 active listings in the ZIP; 8 comparable units currently listed for rent nearby; rentals at typical pace (median 23d on market — plan ~3-4 weeks tenant-placement turnaround); 716 units permitted in Bossier Parish in 2024 (0 in 5+ unit buildings).
- This rent runs 39% of the median local income ($65k/yr) — at the standard rent-burdened threshold; future hikes will face affordability resistance.
Forward outlook
- Local home prices are declining (-3.0%/yr); year-one equity from $2k of loan paydown is wiped out by about $8k of value loss. Plan a longer hold.
- Bossier County population projected at +28% by 2050 — long-run rental-demand tailwind backs the buy-and-hold thesis.
Negotiation context
- Only 9 days on market — expect competitive offers; lowballing is unlikely to land.
- 3 sale attempts since 10y ago with the ask held roughly flat each time — persistent listings suggest the price (not the market) is what's stuck; bring a comps-based counter.
- Current owner paid $20k; list at $267k implies a 1238% gain — meaningful room to come down on a strong offer.
Risks & watch-outs
- Climate carrying-cost: major wind risk, 70% chance of damaging wind over 30y; extreme-heat days projected 7→22/yr by 2055 (HVAC capex compounding) — expect insurance premiums to compound above CPI over the hold.
Questions for the listing agent
- Is there a deadline driving the sale (1031 exchange, divorce, estate, relocation)? That informs how much negotiation room exists.
- Schools are B-rated — typically a magnet for longer-tenancy family renters. What's the average tenant stay here, and is there a school-zone premium baked into asking?
- Crime grade is F in this area — have there been break-ins, vandalism, or insurance claims at this property in the last 3 years? What carrier currently insures it and at what premium?
- The area grade is low — what's the realistic commute time and amenity access for the typical tenant pool here? Any planned neighborhood developments (good or bad) we should know about?
- What's the average days-on-market for RENTAL listings here right now (not sales)? A rising rental-DOM trend means longer vacancies and softer asking-rent achievability than the comps imply.
- What's the recent tenant-quality profile in this submarket — average credit score on applications, eviction rate, late-payment / NSF rate, and stable-employment percentage? A property-management company in the area should have these aggregated.
- How much new for-sale + rental construction is in the pipeline within 1–3 miles? Heavy new supply typically softens prices + rents 12–24 months out; constrained supply supports both.
Investment metrics
- 1% rule
- 0.79% ✗
- Cap rate
- 6.40%
- Cash-on-cash
- 0.38%
- DSCR
- 1.02
- GRM
- 10.5
CMA / ARV
- ARV (on-the-fly)
- $262,854
- Comps found
- 12
Show comp detail 12 sales within ~0.75 mi
| Address | Dist | Beds/Ba | Sqft | Sold | Price | $/sf | Match |
|---|---|---|---|---|---|---|---|
| 2200 Middle Creek Blvd | 0.25mi | 3/2.0 (-1) | 1,768 (+3%) | 2mo | $279,000 | $158 | 77 |
| 6012 Pepperwood Cir | 0.33mi | 4/2.0 | 1,772 (+3%) | 3mo | $269,900 | $152 | 77 |
| 2186 Stockwell Rd | 0.04mi | 3/2.0 (-1) | 1,541 (-10%) | 1mo | $297,500 | $193 | 76 |
| 5900 Stockwood St | 0.39mi | 3/2.0 (-1) | 1,728 (+1%) | 3mo | $245,000 | $142 | 73 |
| 6014 Ellington Way | 0.15mi | 3/2.0 (-1) | 1,901 (+11%) | 2mo | $268,000 | $141 | 68 |
| 2409 Stockwell Rd | 0.58mi | 3/2.0 (-1) | 1,667 (-3%) | 1mo | $165,000 | $99 | 62 |
| 2103 Sandhurst St | 0.46mi | 3/2.0 (-1) | 1,610 (-6%) | 2mo | $220,000 | $137 | 62 |
| 516 Dogwood South Ln | 0.54mi | 4/2.0 | 1,860 (+8%) | 3mo | $319,500 | $172 | 59 |
| 113 Red Fox Cir | 0.71mi | 3/2.0 (-1) | 1,645 (-4%) | 1mo | $244,500 | $149 | 54 |
| 476 Dogwood South Ln | 0.71mi | 3/2.0 (-1) | 1,814 (+6%) | 2mo | $310,000 | $171 | 51 |
| 2308 Stockwell Rd | 0.46mi | 3/2.0 (-1) | 1,501 (-13%) | 3mo | $230,000 | $153 | 50 |
| 519 Dogwood South Ln | 0.56mi | 3/2.0 (-1) | 1,953 (+14%) | 2mo | $345,000 | $177 | 45 |
Match score weights: distance 35% · size 25% · config 20% · recency 20%. Top-matched comps best support the ARV.
Projected returns pro-forma
-3.0% appreciation · 6.56% rent growth · sell at horizon
- IRR
- -12.2%
- Equity multiple
- 0.55×
- Total profit
- $-33,999
- Equity at exit
- $39,811
- IRR
- 1.1%
- Equity multiple
- 1.09×
- Total profit
- $6,600
- Equity at exit
- $23,085
Cash invested: $74,760 (down + closing). Projections, not guarantees.
Landlord ↔ Tenant lean methodology
- Overall (STATE)
- 90 Strongly Landlord-Friendly
- State Louisiana
- 90 Strongly Landlord-Friendly · R+12
- County
- — inherits STATE
- City
- — inherits STATE
ZIP-level market 71111
- Home prices YoY
- -34.8%
- Rents YoY
- 6.6%
- Active inventory
- 426
- Price-to-rent
- 10.5×
Monthly cashflow live
- Estimated rent
- $2,114 high interval (Pro) →
- Mortgage (P&I)
- −$1,400
- Tax from tax record
- −$134 /mo · $1,613/yr
- Insurance
- −$111
- HOA
- −$0
- Vacancy / Maint / Mgmt
- −$444
- Net cashflow
- $24
Break-even live
Sensitivity live
| Price | -10% $175 | -5% $99 | +0% $24 | +5% $-52 | +10% $-127 |
|---|---|---|---|---|---|
| Rent | -10% $-143 | -5% $-60 | +0% $24 | +5% $107 | +10% $191 |
| Rate | -1.0pp $158 | -0.5pp $92 | base $24 | +0.5pp $-45 | +1.0pp $-116 |
UW: 25.0% down · 7.5% · 30yr · 1.5% tax · 5.0% vac · 8.0% maint · 8.0% mgmt
Financing live
Cash to close
- Down payment
- $66,750
- Closing costs
- $8,010
- Reserves months
- —
- Total cash needed
- —
Loan-product check · same deal, 3 products live
Conventional
25% down · 7.5% · 30yr
- Down + closing
- —
- Monthly P&I
- —
- Monthly cashflow
- —
- DSCR
- —
- Eligible?
- —
Personal DTI + credit; lowest rate.
DSCR
20% down · 8.5% · 30yr
- Down + closing
- —
- Monthly P&I
- —
- Monthly cashflow
- —
- DSCR
- —
- Eligible?
- —
No personal income docs; deal must DSCR.
Hard money
10% down · 12.0% · 12mo
- Down + closing
- —
- Monthly P&I
- —
- Monthly cashflow
- —
- DSCR
- —
- Eligible?
- —
Short-term bridge; refi at stabilization.
Rent comps 8 comps
| Address | Beds | Baths | Sqft | Rent | $/sqft | DOM | Units | Dist |
|---|---|---|---|---|---|---|---|---|
| 2201 Hickory Ridge Dr Bossier City, LA | 4.0 | 2.0 | 1900 | $1,950 | $1.03 | 23d | 1 | 0.47mi |
| 6011 Jason St Bossier City, LA | 3.0 | 2.0 | 1887 | $2,000 | $1.06 | 15d | 1 | 0.81mi |
| 2523 Brookhaven Dr Bossier City, LA | 3.0 | 2.0 | 1800 | $1,950 | $1.08 | 23d | 1 | 0.82mi |
| 8052 Fernwood Cir Haughton, LA | 3.0 | 2.0 | 2005 | $1,850 | $0.92 | 15d | 1 | 0.83mi |
| 6021 Whitney Dr Bossier City, LA | 4.0 | 2.0 | 1780 | $2,100 | $1.18 | 45d | 1 | 0.92mi |
| 369 Wood Spgs Haughton, LA | 4.0 | 2.0 | 1890 | $2,300 | $1.22 | 15d | 1 | 1.04mi |
| 8509 Woodhill Ln Haughton, LA | 3.0 | 2.0 | 1451 | $1,650 | $1.14 | 45d | 1 | 1.10mi |
| 701 Fir Wood Ln Haughton, LA | 4.0 | 3.0 | 2065 | $2,400 | $1.16 | 45d | 1 | 1.13mi |
Listing history 7 events
-
2026-06-21days on market $267,000 Active 9 DOM
-
2026-06-18days on market $267,000 Active 6 DOM
-
2026-06-17days on market $267,000 Active 5 DOM
-
2026-06-16days on market $267,000 Active 4 DOM
-
2026-06-15days on market $267,000 Active 3 DOM
-
2026-06-13remarks 699-char remark
-
2026-06-13$267,000 Active 1 DOM
ⓘ Source: listings_history table (triggers on properties + properties_extension) + one-shot
backfill from property_details.listing_events for pre-trigger history.
Tax reassessment forecast LA · Resets to sale price
- Current annual tax
- $1,613 · $134/mo
- Projected year-2 tax
- $1,613 · $134/mo
- Expected delta
- $0/yr ($0/mo · 0.0%)
ⓘ Screening estimate from a state-policy table — verify with the county assessor before closing.
Climate risk First Street
- Flood 1/10 Low FEMA zone X (shaded) · 0% chance over 30 yrs
- Wildfire 3/10 Moderate
- Heat 7/10 Severe 7 d/yr ≥110°F today · 22 d/yr by 30 yrs out
- Wind 6/10 Major 70% chance of damaging wind over 30 yrs
- Air quality 2/10 Low 1 unhealthy d/yr today · 1 by 30 yrs out
Nearby sold comps map
Loading sold comps map…
Walkable amenities ~0.75 mi
Loading nearby amenities…
Taxation est. · year 1
- Rental income
- $25,362
- − Mortgage interest
- −$14,956
- − Property taxes
- −$1,613
- − Insurance
- −$1,335
- − Repairs & maintenance
- −$2,029
- − Management
- −$2,029
- − Depreciation
- −$7,767
- Taxable loss
- −$4,368
- Est. tax savings @ 24.0%
- +$1,048
- After-tax cash flow
- $1,334/yr
For passive investors: Depreciation is non-cash, so a rental often shows a tax loss while cash-flowing — sheltering income. Rental losses are passive: they offset passive income freely, and up to $25,000/yr can offset ordinary (W-2) income if you actively participate and your MAGI is under $100k (phasing out to $0 by $150k); unused losses carry forward. On sale, claimed depreciation is recaptured at up to 25%, and gains may owe capital-gains tax (a 1031 exchange can defer both). Figures are a year-1 estimate at your 24.0% rate — not tax advice; consult a CPA.
Schools (NCES district)
- District
- Bossier Parish
- NCES district ID
- 2200270
- Math proficiency
- 40% ▼ -32.00%
- Reading proficiency
- 47% ▼ -28.00%
- Median HH income
- $51,326
- Composite
- 37.5/100
- National rank
- #4402
- State rank
- #17 of 98 in LA
Livability — Bossier City
- Score
- 71/100
- State rank
- #47
- US rank
- #7044
Category grades
Schools grade is shown separately in the Schools card above.
Census & demographics
- Census place
- Bossier City, LA
- County
- Bossier Parish · 98,704 people
- City population
- 91,925
- Metro
- Shreveport-Bossier City, LA
- Population (ZIP)
- 43,925
- Household income
- $65,292
- Rent vs Own
- Severe rent burden
- 1942.0
Population outlook (Bossier County) Hauer SSP2
- Today (2025)
- 143,247 people
- By 2030
- 151,802 · +6.0%
- By 2040
- 168,194 · +17.4%
- By 2050
- 183,533 · +28.1%
- By 2075
- 217,009 · +51.5%
- By 2100
- 230,091 · +60.6%
Race, ethnicity, and origin ACS 2023
- Neighborhood character
- Diverse neighborhood (Simpson 0.60)
- Race & ethnicity
- White 56% Black 29% Hispanic / Latino 9% Two or more races 8% Asian 3%
- Hispanic origin (detail)
- Mexican 5%
- Common ancestry
- Lithuanian 2% Iranian 1% Slovak 1%
- Foreign-born
- 5% · Canada, Vietnam
- Languages at home
- 90% English-only · Spanish 7% Vietnamese 1% French/Haitian/Cajun 1%
Political lean MEDSL · Bossier
- 2024 margin
- Solid R (+43.3) · D 27.7% · R 71.0% · Other 1.3%
- 2008→2024 swing
- +0.3pp no change · 2008: -43.7pp · 2024: -43.3pp
- All cycles
- 2024: R+43.3 2020: R+41.0 2016: R+45.8 2012: R+45.4 2008: R+43.7
Not yet ingested
- Civics
- —
Market trends
- HPI YoY
- ▼ -79.78%
- Current HPI
- 149.4336
- Rent YoY
- ▲ 6.56%
- Metro
- Shreveport-Bossier City, LA
- State GDP YoY
- ▲ 3.29%
- F500 in state
- 10
Industry mix (Fortune 500 HQ in LA)
| Industry | F500 HQs | Revenue |
|---|---|---|
| Telecommunications | 2 | $23B |
|
||
| Utilities | 1 | $12B |
|
||
| Wholesale / Distribution | 1 | $5B |
|
||
| Advertising | 1 | $2B |
|
||
Price history
+1238.3% since first listed9 events — show timeline
- 2026-06-12 Listed $267,000 NTREIS
- 2023-08-07 Sold (MLS) — NTREIS
- 2023-07-06 Contingent — NTREIS
- 2023-06-28 Price Changed $245,900 NTREIS
- 2023-05-26 Listed $258,000 NTREIS
- 2022-03-07 Price Changed $1,850 RENT.
- 2016-12-01 Listing Removed — MARMLS
- 2016-06-01 Listed $209,000 MARMLS
- 2003-12-22 Sold (Public Records) $19,950 Public Records
Property tax history
-2.8%/yrLatest (2025): $1,613 · -1.3% YoY. Source: county tax records.
Cash-flow waterfall
monthlySold comps — $/sqft
last 12 mo · ≤1 miLoading sold comps…