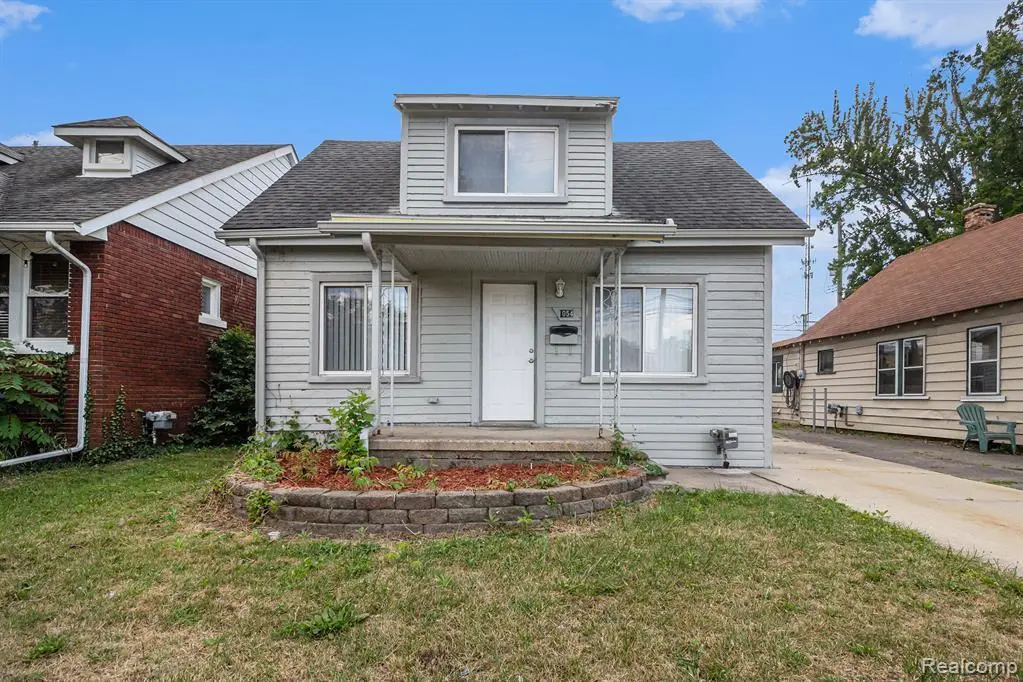
1054 E Troy St · Ferndale, MI
Flood risk 3/10 · Minor
- FEMA flood zone
- X (unshaded)
- Chance of flooding over 30 yrs
- 0.2%
- Est. flood insurance / yr
- $473 – $860
Fire risk 1/10 · Minimal
- Est. fire insurance / yr
- $784 – $1,456
Heat risk 3/10 · Minor
- Hot days now (above 97°F)
- 7 days/yr
- Hot days in 30 yrs
- 15 days/yr
Wind risk 2/10 · Minimal
- Chance of severe wind over 30 yrs
- —
Air-quality risk 3/10 · Minor
- Unhealthy air days now
- 3 days/yr
- Unhealthy air days in 30 yrs
- 5 days/yr
Risk factors via First Street. Map © Google.
Why this score? — see what drove the D+ grade
The composite is a weighted blend of 9 inputs, each scored 0–100. Each bar is that input's sub-score; the figure is the points it added to the 100-point composite (weight × sub-score).
- ARV discount +14.6/15.0
- Cash flow +12.6/30.0
- 1% rule +5.3/10.0
- Livability +4.5/5.0
- Rent growth +4.1/5.0
- DSCR +3.8/10.0
- Condition / age +2.5/5.0
- Schools +1.4/10.0
- Appreciation +0.0/10.0
$169,900
🖨 Deal sheet (PDF) 📄 Offer letter ✓ Due diligence
Listing remarks MLS
EXTREMELY CHARMING BUNGALOW!! FANTASTIC Fully Updated Home w/ 3 Bedrooms, 1-1/2 Full Baths, Spacious Living Room w/ Carpeting. Brand New Kitchen w/ Cabinets, SS Sink, New Faucet, Electric Range & Refrigerator, Ceramic Backsplash & Luxury Vinyl Flooring. New Carpet in Living Room, Dining Room all Bedrooms & Hallway. New Blinds, New Light Fixtures, New Bathroom Vanities & Freshly Painted. Detached 1-1/2 Car Garage & Fenced Back Yard PERFECT for Relaxing. Conveniently Located Near Woodward, I-696 & I-75, Parks, Restaurants & Shopping. (Property Taxes are Non-Homesteaded & will be Lower for Owner Occupant).
Key facts
- Fenced back yard
- Brand new kitchen
- Updated home
Tags
Property features AI
Finance
- Other: Pets allowed (cats and dogs permitted)
Exterior
- Parking: Detached garage facing the front; Approximately 1.5 garage spaces
- Utilities: Public sewer; Other water source
- Home design: Single‑family residence; One and one‑half stories; Ground‑level entry with steps; Aluminum siding
- Construction: Asphalt roof; Block foundation; Built with aluminum siding
- Exterior features: Covered porch; Back yard fencing; Paved road access
Interior
- Kitchen: Free‑standing electric oven; Free‑standing refrigerator
- Bedrooms: Total of 7 rooms (includes bedrooms and living spaces)
- Bathrooms: 1 full bathroom; 1 half bathroom
- Heating & cooling: Forced air heating; Natural gas heating; No central air
- Interior features: Gas water heater; Full unfinished basement
- Laundry & utility: Washer hookup; Electric dryer hookup
Neighborhood map
What this means for you Summary
Snapshot
- This is a 3-bed/1.0-bath single-family listed at $170k.
Deal economics
- At list price, monthly cash flow is $-21 ($-254/yr) — negative.
- To cash-flow at today's rent, offer at most $166k (2.2% below list).
- Meets the 1% rule at list price ($2k rent vs $170k).
- Recommended offer: $150k (12.0% below list) — sets the bar for market timing.
- Cap rate 6.1% vs local median 4.5% in Ferndale — top-decile yield for the area; either an underpriced asset or a hidden risk that comps aren't pricing in. Stress-test before assuming the spread holds.
Location & tenants
- Location reads 90/100 on livability (#8 in MI, #103 nationally) — a professional / high-income tenant draw. Strengths: amenities A+, commute A+, employment A+; Watch: schools D+.
- Hazel Park School District (suburban): math 10% / reading 24% proficiency, ranked #490 of 540 in MI (top 91%) — low school quality limits family demand, transient renter base, plan for 1-2y turnover; 70% free/reduced lunch — lower-income household profile, screen leases tightly.
- Market conditions: Rents rising fast (+6.2%/yr); 180 active listings in the ZIP; 36 comparable units currently listed for rent nearby; rentals at typical pace (median 23d on market — plan ~3-4 weeks tenant-placement turnaround); solid renter incomes; 2,614 units permitted in Oakland County in 2024 (721 in 5+ unit buildings).
Forward outlook
- Local home prices are declining (-3.0%/yr); year-one equity from $1k of loan paydown is wiped out by about $5k of value loss. Plan a longer hold.
- Oakland County population projected at +10% by 2050 — modest demand growth; plan on rents tracking national, not racing it.
Negotiation context
- It's been on market 312 days — a 12% lower offer ($150k) is reasonable based on typical stale-listing flexibility.
- 3 sale attempts since 23y ago; this cycle's ask has dropped $25k (13%) from the opening price — seller is motivated, your offer sets the floor, not the list.
- Current owner paid $123k; 38% above their basis — modest negotiation headroom, anchor on the comps not their cost.
Risks & watch-outs
- Watch-outs: property tax is 3.2% of price; built in 1928 — expect roof / HVAC / electrical / plumbing capex.
Questions for the listing agent
- What do current leases actually rent for vs. the listed asking? Can we see a recent rent roll and the last 12 months of T-12 income?
- It's been on market 312 days. Have you received any prior offers? Is the seller open to a 12% concession, seller financing, or rate buy-down credit?
- Built in 1928 — when were the roof, HVAC, electrical panel, plumbing, and water heater last replaced?
- Property tax is high relative to price — has the assessment been appealed recently, and will the sale trigger a re-assessment?
- Why hasn't it sold? Are there any deal-killer items the seller is aware of (foundation, flood, title, zoning, code violations)?
- Is there a deadline driving the sale (1031 exchange, divorce, estate, relocation)? That informs how much negotiation room exists.
- Schools are D-rated, which usually means shorter tenancies and higher turnover. Who's the typical renter profile here, and what's been the actual vacancy rate?
- The area grade is low — what's the realistic commute time and amenity access for the typical tenant pool here? Any planned neighborhood developments (good or bad) we should know about?
- What's the average days-on-market for RENTAL listings here right now (not sales)? A rising rental-DOM trend means longer vacancies and softer asking-rent achievability than the comps imply.
- What's the recent tenant-quality profile in this submarket — average credit score on applications, eviction rate, late-payment / NSF rate, and stable-employment percentage? A property-management company in the area should have these aggregated.
- How much new for-sale + rental construction is in the pipeline within 1–3 miles? Heavy new supply typically softens prices + rents 12–24 months out; constrained supply supports both.
Investment metrics
- 1% rule
- 1.03% ✓
- Cap rate
- 6.14%
- Cash-on-cash
- -0.53%
- DSCR
- 0.98
- GRM
- 8.1
CMA / ARV
- ARV (on-the-fly)
- $201,544
- Comps found
- 12
Show comp detail 12 sales within ~0.75 mi
| Address | Dist | Beds/Ba | Sqft | Sold | Price | $/sf | Match |
|---|---|---|---|---|---|---|---|
| 1939 Bonner St | 0.15mi | 2/1.0 (-1) | 833 (-2%) | 0mo | $219,000 | $263 | 83 |
| 1220 Orchard St | 0.30mi | 3/1.0 | 928 (+9%) | 0mo | $269,900 | $291 | 71 |
| 2411 Harris St | 0.43mi | 2/1.0 (-1) | 814 (-5%) | 1mo | $150,000 | $184 | 66 |
| 1900 College St | 0.53mi | 2/1.0 (-1) | 830 (-3%) | 1mo | $215,000 | $259 | 65 |
| 23067 Stauber Ave | 0.53mi | 2/1.0 (-1) | 835 (-2%) | 3mo | $139,000 | $166 | 64 |
| 326 E Cambourne St | 0.64mi | 2/1.0 (-1) | 849 (-1%) | 1mo | $257,000 | $303 | 63 |
| 2040 Symes St | 0.31mi | 2/1.0 (-1) | 755 (-12%) | 1mo | $172,500 | $228 | 60 |
| 1939 Almont St | 0.44mi | 2/1.0 (-1) | 765 (-10%) | 3mo | $180,500 | $236 | 55 |
| 1600 Woodward Hts | 0.57mi | 3/1.0 | 750 (-12%) | 3mo | $110,000 | $147 | 50 |
| 2105 Manatee Ave | 0.58mi | 3/1.0 | 961 (+12%) | 3mo | $200,000 | $208 | 50 |
| 2171 Chestnut St | 0.61mi | 3/1.0 | 967 (+13%) | 2mo | $240,000 | $248 | 48 |
| 1449 Jewell St | 0.73mi | 2/1.0 (-1) | 731 (-14%) | 1mo | $168,000 | $230 | 36 |
Match score weights: distance 35% · size 25% · config 20% · recency 20%. Top-matched comps best support the ARV.
Projected returns pro-forma
-3.0% appreciation · 6.24% rent growth · sell at horizon
- IRR
- -12.8%
- Equity multiple
- 0.52×
- Total profit
- $-22,797
- Equity at exit
- $25,333
- IRR
- 1.3%
- Equity multiple
- 1.11×
- Total profit
- $5,031
- Equity at exit
- $14,690
Cash invested: $47,572 (down + closing). Projections, not guarantees.
Landlord ↔ Tenant lean methodology
- Overall (STATE)
- 62 Landlord-Friendly
- State Michigan
- 62 Landlord-Friendly · EVEN
- County
- — inherits STATE
- City
- — inherits STATE
ZIP-level market 48220
- Rents YoY
- 6.2%
- Active inventory
- 180
- Price-to-rent
- 8.1×
Monthly cashflow live
- Estimated rent
- $1,756 high interval (Pro) →
- Mortgage (P&I)
- −$891
- Tax from tax record
- −$447 /mo · $5,360/yr
- Insurance
- −$71
- HOA
- −$0
- Vacancy / Maint / Mgmt
- −$369
- Net cashflow
- $-21
Break-even live
Sensitivity live
| Price | -10% $75 | -5% $27 | +0% $-21 | +5% $-69 | +10% $-117 |
|---|---|---|---|---|---|
| Rent | -10% $-160 | -5% $-91 | +0% $-21 | +5% $48 | +10% $118 |
| Rate | -1.0pp $64 | -0.5pp $22 | base $-21 | +0.5pp $-65 | +1.0pp $-110 |
UW: 25.0% down · 7.5% · 30yr · 1.5% tax · 5.0% vac · 8.0% maint · 8.0% mgmt
Financing live
Cash to close
- Down payment
- $42,475
- Closing costs
- $5,097
- Reserves months
- —
- Total cash needed
- —
Loan-product check · same deal, 3 products live
Conventional
25% down · 7.5% · 30yr
- Down + closing
- —
- Monthly P&I
- —
- Monthly cashflow
- —
- DSCR
- —
- Eligible?
- —
Personal DTI + credit; lowest rate.
DSCR
20% down · 8.5% · 30yr
- Down + closing
- —
- Monthly P&I
- —
- Monthly cashflow
- —
- DSCR
- —
- Eligible?
- —
No personal income docs; deal must DSCR.
Hard money
10% down · 12.0% · 12mo
- Down + closing
- —
- Monthly P&I
- —
- Monthly cashflow
- —
- DSCR
- —
- Eligible?
- —
Short-term bridge; refi at stabilization.
Rent comps 36 comps
| Address | Beds | Baths | Sqft | Rent | $/sqft | DOM | Units | Dist |
|---|---|---|---|---|---|---|---|---|
| 552 E Saratoga St Unit Upper Unit Ferndale, MI | 2.0 | 1.0 | 700 | $1,300 | $1.86 | 25d | 1 | 0.35mi |
| 2033 Wrenson St Ferndale, MI | 3.0 | 1.0 | 816 | $1,675 | $2.05 | 0d | 1 | 0.38mi |
| 425 Vester St Unit A Ferndale, MI | 2.0 | 1.0 | 525 | $1,349 | $2.57 | 6d | 1 | 0.41mi |
| 501 E Breckenridge St Ferndale, MI | 3.0 | 1.0 | 946 | $1,800 | $1.90 | 25d | 1 | 0.47mi |
| 2023 Ardmore Dr Ferndale, MI | 2.0 | 1.0 | 771 | $1,250 | $1.62 | 25d | 1 | 0.48mi |
| 453 E Cambourne St Unit 1 Ferndale, MI | 2.0 | 1.0 | 1000 | $2,500 | $2.50 | 4d | 1 | 0.55mi |
| 455 E Cambourne St Unit 2 Ferndale, MI | 2.0 | 1.0 | 900 | $2,400 | $2.67 | 4d | 1 | 0.55mi |
| 400 E Cambourne St Unit 1 Ferndale, MI | 2.0 | 1.0 | 1000 | $1,400 | $1.40 | 12d | 1 | 0.60mi |
| 790 Jewell St Ferndale, MI | 2.0 | 1.0 | 800 | $1,445 | $1.81 | 25d | 1 | 0.64mi |
| 266 W Goulson Ave Hazel Park, MI | 3.0 | 1.0 | 942 | $1,600 | $1.70 | 23d | 1 | 0.66mi |
| 22111 Woodward Ave Ferndale, MI | 2.0 | 1.0 | 816 | $3,355 | $4.11 | 17d | 1 | 0.70mi |
| 1800 Browning St Ferndale, MI | 2.0 | 1.0 | 809 | $1,600 | $1.98 | 6d | 1 | 0.72mi |
| 2215 Browning St Ferndale, MI | 2.0 | 1.0 | 739 | $1,350 | $1.83 | 5d | 1 | 0.80mi |
| 224 Fielding St Ferndale, MI | 2.0 | 1.0 | 1000 | $1,800 | $1.80 | 25d | 1 | 0.83mi |
| 226 Fielding St Ferndale, MI | 2.0 | 1.0 | 1000 | $1,500 | $1.50 | 25d | 1 | 0.83mi |
| 1561 E Webster St Ferndale, MI | 2.0 | 1.0 | 939 | $1,600 | $1.70 | 25d | 1 | 0.83mi |
| 90 W Meyers Ave Hazel Park, MI | 2.0 | 1.0 | 831 | $1,800 | $2.17 | 25d | 1 | 0.84mi |
| 901 Saint Louis St Unit 901-02 Ferndale, MI | 2.0 | 1.0 | 800 | $1,395 | $1.74 | 25d | 1 | 0.84mi |
| 901 Saint Louis St Ferndale, MI | 2.0 | 1.0 | 800 | $1,395 | $1.74 | 44d | 1 | 0.84mi |
| 353 W Webster St Ferndale, MI | 2.0 | 1.0 | 900 | $1,525 | $1.69 | 17d | 1 | 0.96mi |
| 2181 Coy St Ferndale, MI | 3.0 | 1.0 | 1050 | $1,995 | $1.90 | 12d | 1 | 0.96mi |
| 430 W 9 Mile Rd Ferndale, MI | 1.0–2.0 | 2.0 | 826 | $2,827 | $3.42 | 0d | 2 | 1.01mi |
| 155 W George Ave Hazel Park, MI | 2.0 | 1.0 | 725 | $1,000 | $1.38 | 25d | 1 | 1.08mi |
| 851 Gardendale St Ferndale, MI | 2.0 | 1.0 | 933 | $1,625 | $1.74 | 25d | 1 | 1.11mi |
| 23115 Tawas Ave Hazel Park, MI | 2.0 | 1.0 | 706 | $1,375 | $1.95 | 25d | 1 | 1.14mi |
| 23345 Tawas Ave Hazel Park, MI | 3.0 | 1.0 | 1000 | $1,550 | $1.55 | 12d | 1 | 1.16mi |
| 23773 Hazelwood Ave Hazel Park, MI | 2.0 | 1.0 | 671 | $1,400 | $2.09 | 13d | 1 | 1.18mi |
| 1816 Guthrie Ave Royal Oak, MI | 3.0 | 1.0 | 1100 | $1,800 | $1.64 | 6d | 1 | 1.18mi |
| 429 E Milton Ave Hazel Park, MI | 3.0 | 2.0 | 1075 | $1,595 | $1.48 | 0d | 1 | 1.20mi |
| 407 E Hayes Ave Hazel Park, MI | 3.0 | 1.0 | 1000 | $1,750 | $1.75 | 25d | 1 | 1.22mi |
| 695 Livernois St Unit 2 Ferndale, MI | 2.0 | 1.0 | 950 | $2,350 | $2.47 | 5d | 1 | 1.30mi |
| 20643 Stratford Rd Unit 1 Detroit, MI | 2.0 | 1.5 | 1000 | $1,250 | $1.25 | 44d | 1 | 1.30mi |
| 510 Stratford Rd Ferndale, MI | 2.0 | 1.0 | 965 | $1,750 | $1.81 | 44d | 1 | 1.41mi |
| 578 Kensington Ave Ferndale, MI | 2.0 | 1.0 | 860 | $1,600 | $1.86 | 6d | 1 | 1.43mi |
| 1045 E Woodward Heights Blvd Hazel Park, MI | 1.0–2.0 | 1.0 | 715 | $1,209 | $1.69 | 25d | 3 | 1.43mi |
| 1291 W State Fair Ave Detroit, MI | 1.0–2.0 | 1.0 | 700 | $950 | $1.36 | 13d | 2 | 1.45mi |
Listing history 30 events
-
2026-06-21days on market $169,900 Active 312 DOM
-
2026-06-18days on market $169,900 Active 309 DOM
-
2026-06-17days on market $169,900 Active 308 DOM
-
2026-06-16days on market $169,900 Active 307 DOM
-
2026-06-15days on market $169,900 Active 306 DOM
-
2026-06-13days on market $169,900 Active 304 DOM
-
2026-06-13days on market $169,900 Active 303 DOM
-
2026-06-09days on market $169,900 Active 300 DOM
-
2026-06-08days on market $169,900 Active 299 DOM
-
2026-06-07days on market $169,900 Active 298 DOM
-
2026-06-04days on market $169,900 Active 295 DOM
-
2026-06-03days on market $169,900 Active 294 DOM
-
2026-06-02days on market $169,900 Active 293 DOM
-
2026-06-01days on market $169,900 Active 292 DOM
-
2026-05-31days on market $169,900 Active 291 DOM
-
2026-02-09price $169,900 658-char remark
Show marketing remark (658 chars)
EXTREMELY CHARMING BUNGALOW!! FANTASTIC Fully Updated Home w/ 3 Bedrooms, 1-1/2 Full Baths, Spacious Living Room w/ Carpeting. Brand New Kitchen w/ Cabinets, SS Sink, New Faucet, Electric Range & Refrigerator, Ceramic Backsplash & Luxury Vinyl Flooring. New Carpet in Living Room, Dining Room all Bedrooms & Hallway. New Blinds, New Light Fixtures, New Bathroom Vanities & Freshly Painted. Detached 1-1/2 Car Garage & Fenced Back Yard PERFECT for Relaxing. Conveniently Located Near Woodward, I-696 & I-75, Parks, Restaurants & Shopping. (Property Taxes are Non-Homesteaded & will be Lower for Owner Occupant).
-
2026-02-08price $169,900
-
2025-11-15price $179,000 658-char remark
Show marketing remark (658 chars)
EXTREMELY CHARMING BUNGALOW!! FANTASTIC Fully Updated Home w/ 3 Bedrooms, 1-1/2 Full Baths, Spacious Living Room w/ Carpeting. Brand New Kitchen w/ Cabinets, SS Sink, New Faucet, Electric Range & Refrigerator, Ceramic Backsplash & Luxury Vinyl Flooring. New Carpet in Living Room, Dining Room all Bedrooms & Hallway. New Blinds, New Light Fixtures, New Bathroom Vanities & Freshly Painted. Detached 1-1/2 Car Garage & Fenced Back Yard PERFECT for Relaxing. Conveniently Located Near Woodward, I-696 & I-75, Parks, Restaurants & Shopping. (Property Taxes are Non-Homesteaded & will be Lower for Owner Occupant).
-
2025-11-14price $179,000
-
2025-11-03price $185,000 658-char remark
Show marketing remark (658 chars)
EXTREMELY CHARMING BUNGALOW!! FANTASTIC Fully Updated Home w/ 3 Bedrooms, 1-1/2 Full Baths, Spacious Living Room w/ Carpeting. Brand New Kitchen w/ Cabinets, SS Sink, New Faucet, Electric Range & Refrigerator, Ceramic Backsplash & Luxury Vinyl Flooring. New Carpet in Living Room, Dining Room all Bedrooms & Hallway. New Blinds, New Light Fixtures, New Bathroom Vanities & Freshly Painted. Detached 1-1/2 Car Garage & Fenced Back Yard PERFECT for Relaxing. Conveniently Located Near Woodward, I-696 & I-75, Parks, Restaurants & Shopping. (Property Taxes are Non-Homesteaded & will be Lower for Owner Occupant).
-
2025-11-03price $185,000
Show marketing remark (658 chars)
EXTREMELY CHARMING BUNGALOW!! FANTASTIC Fully Updated Home w/ 3 Bedrooms, 1-1/2 Full Baths, Spacious Living Room w/ Carpeting. Brand New Kitchen w/ Cabinets, SS Sink, New Faucet, Electric Range & Refrigerator, Ceramic Backsplash & Luxury Vinyl Flooring. New Carpet in Living Room, Dining Room all Bedrooms & Hallway. New Blinds, New Light Fixtures, New Bathroom Vanities & Freshly Painted. Detached 1-1/2 Car Garage & Fenced Back Yard PERFECT for Relaxing. Conveniently Located Near Woodward, I-696 & I-75, Parks, Restaurants & Shopping. (Property Taxes are Non-Homesteaded & will be Lower for Owner Occupant).
-
2025-08-13$195,000 Active 658-char remark
Show marketing remark (658 chars)
EXTREMELY CHARMING BUNGALOW!! FANTASTIC Fully Updated Home w/ 3 Bedrooms, 1-1/2 Full Baths, Spacious Living Room w/ Carpeting. Brand New Kitchen w/ Cabinets, SS Sink, New Faucet, Electric Range & Refrigerator, Ceramic Backsplash & Luxury Vinyl Flooring. New Carpet in Living Room, Dining Room all Bedrooms & Hallway. New Blinds, New Light Fixtures, New Bathroom Vanities & Freshly Painted. Detached 1-1/2 Car Garage & Fenced Back Yard PERFECT for Relaxing. Conveniently Located Near Woodward, I-696 & I-75, Parks, Restaurants & Shopping. (Property Taxes are Non-Homesteaded & will be Lower for Owner Occupant).
-
2025-08-13$195,000 Active
Show marketing remark (658 chars)
EXTREMELY CHARMING BUNGALOW!! FANTASTIC Fully Updated Home w/ 3 Bedrooms, 1-1/2 Full Baths, Spacious Living Room w/ Carpeting. Brand New Kitchen w/ Cabinets, SS Sink, New Faucet, Electric Range & Refrigerator, Ceramic Backsplash & Luxury Vinyl Flooring. New Carpet in Living Room, Dining Room all Bedrooms & Hallway. New Blinds, New Light Fixtures, New Bathroom Vanities & Freshly Painted. Detached 1-1/2 Car Garage & Fenced Back Yard PERFECT for Relaxing. Conveniently Located Near Woodward, I-696 & I-75, Parks, Restaurants & Shopping. (Property Taxes are Non-Homesteaded & will be Lower for Owner Occupant).
-
2004-01-16soldstatus $123,000
-
2003-10-28soldstatus $123,000
-
2003-06-12$124,900
-
2001-07-31soldstatus $60,000
-
1991-07-17soldstatus $21,000
-
1981-02-01soldstatus $21,000
-
1973-01-01soldstatus $14,500
ⓘ Source: listings_history table (triggers on properties + properties_extension) + one-shot
backfill from property_details.listing_events for pre-trigger history.
Tax reassessment forecast MI · Partial reset (capped growth)
- Current annual tax
- $5,360 · $447/mo
- Projected year-2 tax
- $5,360 · $447/mo
- Expected delta
- $0/yr ($0/mo · 0.0%)
ⓘ Screening estimate from a state-policy table — verify with the county assessor before closing.
Climate risk First Street
- Flood 3/10 Moderate FEMA zone X (unshaded) · 20% chance over 30 yrs
- Wildfire 1/10 Low
- Heat 3/10 Moderate 7 d/yr ≥97°F today · 15 d/yr by 30 yrs out
- Wind 2/10 Low
- Air quality 3/10 Moderate 3 unhealthy d/yr today · 5 by 30 yrs out
Nearby sold comps map
Loading sold comps map…
Walkable amenities ~0.75 mi
Loading nearby amenities…
Taxation est. · year 1
- Rental income
- $21,072
- − Mortgage interest
- −$9,517
- − Property taxes
- −$5,360
- − Insurance
- −$850
- − Repairs & maintenance
- −$1,686
- − Management
- −$1,686
- − Depreciation
- −$4,943
- Taxable loss
- −$2,968
- Est. tax savings @ 24.0%
- +$712
- After-tax cash flow
- $459/yr
For passive investors: Depreciation is non-cash, so a rental often shows a tax loss while cash-flowing — sheltering income. Rental losses are passive: they offset passive income freely, and up to $25,000/yr can offset ordinary (W-2) income if you actively participate and your MAGI is under $100k (phasing out to $0 by $150k); unused losses carry forward. On sale, claimed depreciation is recaptured at up to 25%, and gains may owe capital-gains tax (a 1031 exchange can defer both). Figures are a year-1 estimate at your 24.0% rate — not tax advice; consult a CPA.
Schools (NCES district)
- District
- Hazel Park School District
- NCES district ID
- 2618030
- Math proficiency
- 10% ▼ -2.00%
- Reading proficiency
- 24% ▲ 1.00%
- Median HH income
- $36,181
- Composite
- 14.05/100
- National rank
- #9466
- State rank
- #490 of 540 in MI
Livability — Ferndale
- Score
- 90/100
- State rank
- #8
- US rank
- #103
Category grades
Schools grade is shown separately in the Schools card above.
Census & demographics
- Census place
- Ferndale, MI
- County
- Oakland County · 1,009,092 people
- City population
- 21,527
- Metro
- Detroit-Warren-Dearborn, MI
- Population (ZIP)
- 21,527
- Household income
- $89,881
- Rent vs Own
- Severe rent burden
- 670.0
Population outlook (Oakland County) Hauer SSP2
- Today (2025)
- 1,335,747 people
- By 2030
- 1,375,100 · +2.9%
- By 2040
- 1,435,385 · +7.5%
- By 2050
- 1,469,250 · +10.0%
- By 2075
- 1,531,946 · +14.7%
- By 2100
- 1,450,485 · +8.6%
Race, ethnicity, and origin ACS 2023
- Neighborhood character
- Predominantly White (72%)
- Race & ethnicity
- White 72% Black 15% Two or more races 6% Hispanic / Latino 5% Asian 3%
- Common ancestry
- Romanian 11% Lithuanian 6% Slovak 3%
- Foreign-born
- 4% · Canada, South Korea
- Languages at home
- 95% English-only · Spanish 2% Other Indo-European 1% German/W. Germanic 1%
Political lean MEDSL · Oakland
- 2024 margin
- D (+10.6) · D 54.4% · R 43.8% · Other 1.9%
- 2008→2024 swing
- -3.9pp toward R · 2008: 14.5pp · 2024: 10.6pp
- All cycles
- 2024: D+10.6 2020: D+14.1 2016: D+8.1 2012: D+8.1 2008: D+14.5
Not yet ingested
- Civics
- —
Market trends
- HPI YoY
- ▼ -394.92%
- Current HPI
- 273.0986
- Rent YoY
- ▲ 6.24%
- Metro
- Detroit-Warren-Dearborn, MI
- State GDP YoY
- ▲ 1.37%
- F500 in state
- 28
Industry mix (Fortune 500 HQ in MI)
| Industry | F500 HQs | Revenue |
|---|---|---|
| Automotive Parts | 3 | $48B |
|
||
| Automotive | 2 | $372B |
|
||
| Chemicals | 1 | $45B |
|
||
| Automotive Retail | 1 | $29B |
|
||
| Healthcare / Medical Devices | 1 | $23B |
|
||
| Automotive Technology | 1 | $20B |
|
||
Price history
+1071.7% since first listed15 events — show timeline
- 2026-02-09 Price Changed $169,900 MiRealSource-MiMLS
- 2026-02-08 Price Changed $169,900 REALCOMP
- 2025-11-15 Price Changed $179,000 MiRealSource-MiMLS
- 2025-11-14 Price Changed $179,000 REALCOMP
- 2025-11-03 Price Changed $185,000 MiRealSource-MiMLS
- 2025-11-03 Price Changed $185,000 REALCOMP
- 2025-08-13 Listed $195,000 REALCOMP
- 2025-08-13 Listed $195,000 MiRealSource-MiMLS
- 2004-01-16 Sold (Public Records) $123,000 Public Records
- 2003-10-28 Sold (MLS) $123,000 REALCOMP
- 2003-06-12 Listed $124,900 REALCOMP
- 2001-07-31 Sold (Public Records) $60,000 Public Records
- 1991-07-17 Sold (Public Records) $21,000 Public Records
- 1981-02-01 Sold (Public Records) $21,000 Public Records
- 1973-01-01 Sold (Public Records) $14,500 Public Records
Property tax history
+11.1%/yrLatest (2025): $5,360 · +14.5% YoY. Source: county tax records.
Cash-flow waterfall
monthlySold comps — $/sqft
last 12 mo · ≤1 miLoading sold comps…