16 Gulf St · Chickasaw, AL
Flood risk 1/10 · Minimal
- FEMA flood zone
- X (unshaded)
- Chance of flooding over 30 yrs
- 0.0%
- Est. flood insurance / yr
- $507 – $1,088
Fire risk 3/10 · Minor
- Est. fire insurance / yr
- $916 – $1,700
Heat risk 9/10 · Severe
- Hot days now (above 104°F)
- 7 days/yr
- Hot days in 30 yrs
- 21 days/yr
Wind risk 9/10 · Severe
- Chance of severe wind over 30 yrs
- 99.0%
Air-quality risk 2/10 · Minimal
- Unhealthy air days now
- 1 days/yr
- Unhealthy air days in 30 yrs
- 2 days/yr
Risk factors via First Street. Map © Google.
Why this score? — see what drove the A- grade
The composite is a weighted blend of 9 inputs, each scored 0–100. Each bar is that input's sub-score; the figure is the points it added to the 100-point composite (weight × sub-score).
- Cash flow +30.0/30.0
- 1% rule +10.0/10.0
- DSCR +10.0/10.0
- Appreciation +10.0/10.0
- ARV discount +7.5/15.0
- Schools +5.0/10.0
- Livability +3.1/5.0
- Rent growth +2.5/5.0
- Condition / age +2.5/5.0
$39,900
🖨 Deal sheet 📄 Offer letter ✓ Due diligence
Listing remarks
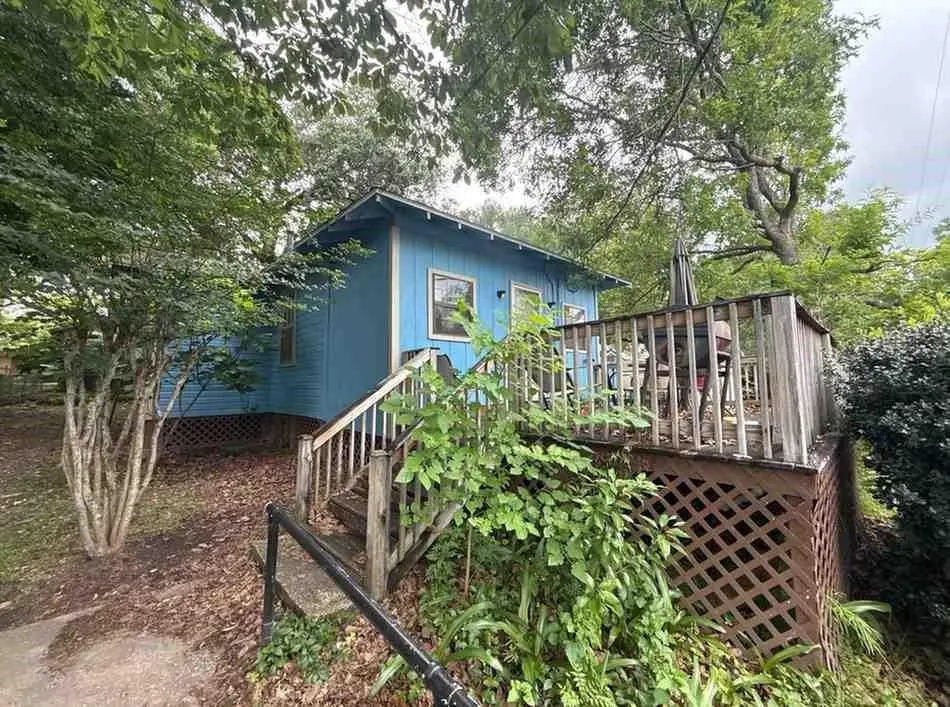
Perfect Starter Home in the Heart of Chickasaw! Don’t miss this charming 2-bedroom, 1-bath home that’s ideal for a first-time homebuyer, downsizer, or investor. Conveniently located in the heart of Chickasaw, this home offers comfort, affordability, and peace of mind with major updates already completed. The home features a roof and HVAC system that are only 2 years old, helping to reduce maintenance concerns and provide added value for years to come. Inside, you’ll find a functional layout with plenty of potential to make it your own. Conveniently located near schools, shopping, dining, and major roadways, this property is a great opportunity to own a home at an afford
Key facts
- Near schools
- Near dining
- Roof and hvac system
Tags
Property features AI
Finance
- Other: No land lease; Subdivision: East Village Chickasaw
Exterior
- Parking: No parking
- Utilities: Public sewer; Electric service not listed
- Home design: Single family residence; Residential property
- Construction: Wood siding exterior; Shingle roof; Built in 1985; No foundation details listed; No window features listed
- Exterior features: Other exterior features; No fencing; No other structures; View present
Interior
- Kitchen: Other kitchen features; Appliances: Other
- Bedrooms: 2 bedrooms
- Flooring: Hardwood flooring
- Bathrooms: 1 full bathroom
- Heating & cooling: Other heating; Other cooling
- Interior features: Other interior features; No fireplace
- Laundry & utility: Other utilities
Neighborhood map
What this means for you Summary
Snapshot
- This is a 2-bed/1.0-bath single-family listed at $40k.
Deal economics
- At list price, monthly cash flow is $434 ($5k/yr) — positive.
- The deal already cash-flows at list — no discount required.
- Meets the 1% rule at list price ($898 rent vs $40k).
- Cap rate 19.3% vs local median 7.2% in Chickasaw — top-decile yield for the area; either an underpriced asset or a hidden risk that comps aren't pricing in. Stress-test before assuming the spread holds.
Location & tenants
- Location reads 61/100 on livability (#237 in AL) — a middle-class / working-renter tenant base. Strengths: cost of living A+, housing A-, health & safety B; Watch: crime D-, amenities F, commute F.
- Zoned schools: Chickasaw City Elementary School (math 7% / reading 30%, grade F, #480 of 627 statewide, top 77%, 550 students, 80% FRL); Chickasaw City High School (math 5% / reading 15%, grade F, #248 of 305 statewide, top 82%, 224 students, 91% FRL).
- Market conditions: 45 active listings in the ZIP; 4 comparable units currently listed for rent nearby; rentals at typical pace (median 21d on market — plan ~3-4 weeks tenant-placement turnaround); 1,678 units permitted in Mobile County in 2024 (264 in 5+ unit buildings).
Forward outlook
- In year one you build about $4k of equity ($276 loan paydown + $4k appreciation (10.0% local appreciation)).
- Mobile County population projected to shrink 8% by 2050 — rents likely to lag national; underwrite the cash flow, not the appreciation.
- At projected returns (10.0% appreciation + 3.0% rent growth), your $11k cash investment doubles in ~2 years — after that, you're playing with house money.
- By year 7, paydown + projected appreciation supports a ~$31k cash-out refi (75% LTV) — recoverable capital for the next deal without selling this one.
Negotiation context
- Only 14 days on market — expect competitive offers; lowballing is unlikely to land.
Risks & watch-outs
- Climate carrying-cost: severe wind risk, 99% chance of damaging wind over 30y; extreme-heat days projected 7→21/yr by 2055 (HVAC capex compounding) — expect insurance premiums to compound above CPI over the hold.
Questions for the listing agent
- Is there a deadline driving the sale (1031 exchange, divorce, estate, relocation)? That informs how much negotiation room exists.
- Schools are F-rated, which usually means shorter tenancies and higher turnover. Who's the typical renter profile here, and what's been the actual vacancy rate?
- Crime grade is D in this area — have there been break-ins, vandalism, or insurance claims at this property in the last 3 years? What carrier currently insures it and at what premium?
- What's the average days-on-market for RENTAL listings here right now (not sales)? A rising rental-DOM trend means longer vacancies and softer asking-rent achievability than the comps imply.
- What's the recent tenant-quality profile in this submarket — average credit score on applications, eviction rate, late-payment / NSF rate, and stable-employment percentage? A property-management company in the area should have these aggregated.
- How much new for-sale + rental construction is in the pipeline within 1–3 miles? Heavy new supply typically softens prices + rents 12–24 months out; constrained supply supports both.
Investment metrics
- 1% rule
- 2.25% ✓
- Cap rate
- 19.34%
- Cash-on-cash
- 46.61%
- DSCR
- 3.07
- GRM
- 3.7
CMA / ARV
- ARV (on-the-fly)
- $116,760
- Comps found
- 2
Show comp detail 2 sales within ~0.75 mi
| Address | Dist | Beds/Ba | Sqft | Sold | Price | $/sf | Match |
|---|---|---|---|---|---|---|---|
| 322 Jackson St | 0.62mi | 3/1.0 (+1) | 825 (-2%) | 10mo | $115,000 | $139 | 54 |
| 56 Thompson Blvd | 0.68mi | 2/1.0 | 800 (-5%) | 17mo | $65,000 | $81 | 46 |
Match score weights: distance 35% · size 25% · config 20% · recency 20%. Top-matched comps best support the ARV.
Projected returns pro-forma
10.0% appreciation · 3.0% rent growth · sell at horizon
- IRR
- 60.7%
- Equity multiple
- 5.42×
- Total profit
- $49,384
- Equity at exit
- $35,945
- IRR
- 54.3%
- Equity multiple
- 12.07×
- Total profit
- $123,719
- Equity at exit
- $77,517
Cash invested: $11,172 (down + closing). Projections, not guarantees.
Landlord ↔ Tenant lean methodology
- Overall (STATE)
- 90 Strongly Landlord-Friendly
- State Alabama
- 90 Strongly Landlord-Friendly · R+15
- County
- — inherits STATE
- City
- — inherits STATE
ZIP-level market 36611
- Home prices YoY
- 7.0%
- Active inventory
- 45
- Price-to-rent
- 3.7×
Monthly cashflow live
- Estimated rent
- $898 medium interval (Pro) →
- Mortgage (P&I)
- −$209
- Tax est. 1.5%
- −$50 /mo · $598/yr
- Insurance
- −$17
- HOA
- −$0
- Vacancy / Maint / Mgmt
- −$189
- Net cashflow
- $434
Break-even live
UW: 25.0% down · 7.5% · 30yr · 1.5% tax · 5.0% vac · 8.0% maint · 8.0% mgmt
Financing live
Cash to close
- Down payment
- $9,975
- Closing costs
- $1,197
- Reserves months
- —
- Total cash needed
- —
Loan-product check · same deal, 3 products live
Conventional
25% down · 7.5% · 30yr
- Down + closing
- —
- Monthly P&I
- —
- Monthly cashflow
- —
- DSCR
- —
- Eligible?
- —
Personal DTI + credit; lowest rate.
DSCR
20% down · 8.5% · 30yr
- Down + closing
- —
- Monthly P&I
- —
- Monthly cashflow
- —
- DSCR
- —
- Eligible?
- —
No personal income docs; deal must DSCR.
Hard money
10% down · 12.0% · 12mo
- Down + closing
- —
- Monthly P&I
- —
- Monthly cashflow
- —
- DSCR
- —
- Eligible?
- —
Short-term bridge; refi at stabilization.
Rent comps 4 comps
| Address | Beds | Baths | Sqft | Rent | $/sqft | DOM | Units | Dist |
|---|---|---|---|---|---|---|---|---|
| 3 Southern St Chickasaw, AL | 3.0 | 1.0 | 1108 | $795 | $0.72 | 13d | 1 | 0.09mi |
| 311 Grant St Chickasaw, AL | 2.0 | 1.0 | 1000 | $850 | $0.85 | 44d | 1 | 0.39mi |
| 55 Thompson Blvd Chickasaw, AL | 3.0 | 1.0 | 939 | $1,500 | $1.60 | 21d | 1 | 0.64mi |
| 156 9th Ave Chickasaw, AL | 2.0 | 1.0 | 720 | $950 | $1.32 | 21d | 1 | 0.89mi |
Listing history 12 events
-
2026-06-18days on market $39,900 Active 14 DOM
-
2026-06-17price $39,900 Active 13 DOM
-
2026-06-17days on market $44,900 Active 13 DOM
-
2026-06-16days on market $44,900 Active 12 DOM
-
2026-06-15days on market $44,900 Active 11 DOM
-
2026-06-14days on market $44,900 Active 9 DOM
-
2026-06-13days on market $44,900 Active 8 DOM
-
2026-06-10days on market $44,900 Active 6 DOM
-
2026-06-09days on market $44,900 Active 5 DOM
-
2026-06-08days on market $44,900 Active 4 DOM
-
2026-06-07remarks 681-char remark
-
2026-06-07$44,900 Active 3 DOM
ⓘ Source: listings_history table (triggers on properties + properties_extension) + one-shot
backfill from property_details.listing_events for pre-trigger history.
Climate risk First Street
- Flood 1/10 Low FEMA zone X (unshaded) · 0% chance over 30 yrs
- Wildfire 3/10 Moderate
- Heat 9/10 Extreme 7 d/yr ≥104°F today · 21 d/yr by 30 yrs out
- Wind 9/10 Extreme 99% chance of damaging wind over 30 yrs
- Air quality 2/10 Low 1 unhealthy d/yr today · 2 by 30 yrs out
Nearby sold comps map
Loading sold comps map…
Walkable amenities ~0.75 mi
Loading nearby amenities…
Taxation est. · year 1
- Rental income
- $10,780
- − Mortgage interest
- −$2,235
- − Property taxes
- −$598
- − Insurance
- −$200
- − Repairs & maintenance
- −$862
- − Management
- −$862
- − Depreciation
- −$1,161
- Taxable income
- $4,862
- Est. tax owed @ 24.0%
- −$1,167
- After-tax cash flow
- $4,041/yr
For passive investors: Depreciation is non-cash, so a rental often shows a tax loss while cash-flowing — sheltering income. Rental losses are passive: they offset passive income freely, and up to $25,000/yr can offset ordinary (W-2) income if you actively participate and your MAGI is under $100k (phasing out to $0 by $150k); unused losses carry forward. On sale, claimed depreciation is recaptured at up to 25%, and gains may owe capital-gains tax (a 1031 exchange can defer both). Figures are a year-1 estimate at your 24.0% rate — not tax advice; consult a CPA.
Schools (NCES district)
No district data.
Livability — Chickasaw
- Score
- 61/100
- State rank
- #237
- US rank
- #17438
Category grades
Schools grade is shown separately in the Schools card above.
Census & demographics
- Census place
- Chickasaw, AL
- City population
- 6,367
- Population (ZIP)
- 6,367
Population outlook (Mobile County) Hauer SSP2
- Today (2025)
- 415,303 people
- By 2030
- 411,755 · -0.9%
- By 2040
- 399,670 · -3.8%
- By 2050
- 382,616 · -7.9%
- By 2075
- 337,353 · -18.8%
- By 2100
- 283,391 · -31.8%
Race, ethnicity, and origin ACS 2023
- Neighborhood character
- Diverse neighborhood (Simpson 0.56)
- Race & ethnicity
- Black 55% White 38% Two or more races 4% Hispanic / Latino 2% Asian 2%
- Common ancestry
- Lithuanian 2% Serbian 1% Italian 1%
- Foreign-born
- 3% · Canada, China
- Languages at home
- 98% English-only · Spanish 1% French/Haitian/Cajun 1%
Political lean MEDSL · Mobile
- 2024 margin
- R (+16.4) · D 41.3% · R 57.7%
- 2008→2024 swing
- -7.7pp toward R · 2008: -8.7pp · 2024: -16.4pp
- All cycles
- 2024: R+16.4 2020: R+11.9 2016: R+13.9 2012: R+9.3 2008: R+8.7
Not yet ingested
- Civics
- —
Market trends
- HPI YoY
- ▲ 12.90%
- Current HPI
- 196.621
- Rent YoY
- —
- Metro
- —
- State GDP YoY
- ▲ 2.94%
- F500 in state
- 4
Industry mix (Fortune 500 HQ in AL)
| Industry | F500 HQs | Revenue |
|---|---|---|
| Financial Services | 1 | $8B |
|
||
| Healthcare | 1 | $5B |
|
||
Price history
1 event — show timeline
- 2026-06-04 Listed $44,900 GCMLS AL
Cash-flow waterfall
monthlySold comps — $/sqft
last 12 mo · ≤1 miLoading sold comps…