760 SE 2nd Ave · Deerfield Beach, FL
Flood risk 3/10 · Minor
- FEMA flood zone
- X (unshaded)
- Chance of flooding over 30 yrs
- 0.12%
- Est. flood insurance / yr
- $507 – $1,088
Fire risk 1/10 · Minimal
- Est. fire insurance / yr
- $947 – $1,759
Heat risk 10/10 · Severe
- Hot days now (above 106°F)
- 7 days/yr
- Hot days in 30 yrs
- 26 days/yr
Wind risk 10/10 · Severe
- Chance of severe wind over 30 yrs
- 99.0%
Air-quality risk 2/10 · Minimal
- Unhealthy air days now
- 1 days/yr
- Unhealthy air days in 30 yrs
- 3 days/yr
Risk factors via First Street. Map © Google.
Why this score? — see what drove the D+ grade
The composite is a weighted blend of 9 inputs, each scored 0–100. Each bar is that input's sub-score; the figure is the points it added to the 100-point composite (weight × sub-score).
- Cash flow +12.3/30.0
- 1% rule +8.2/10.0
- ARV discount +7.5/15.0
- Schools +4.1/10.0
- Livability +3.8/5.0
- DSCR +3.7/10.0
- Rent growth +3.0/5.0
- Condition / age +2.5/5.0
- Appreciation +0.0/10.0
$149,000
🖨 Deal sheet (PDF) 📄 Offer letter ✓ Due diligence
Listing remarks
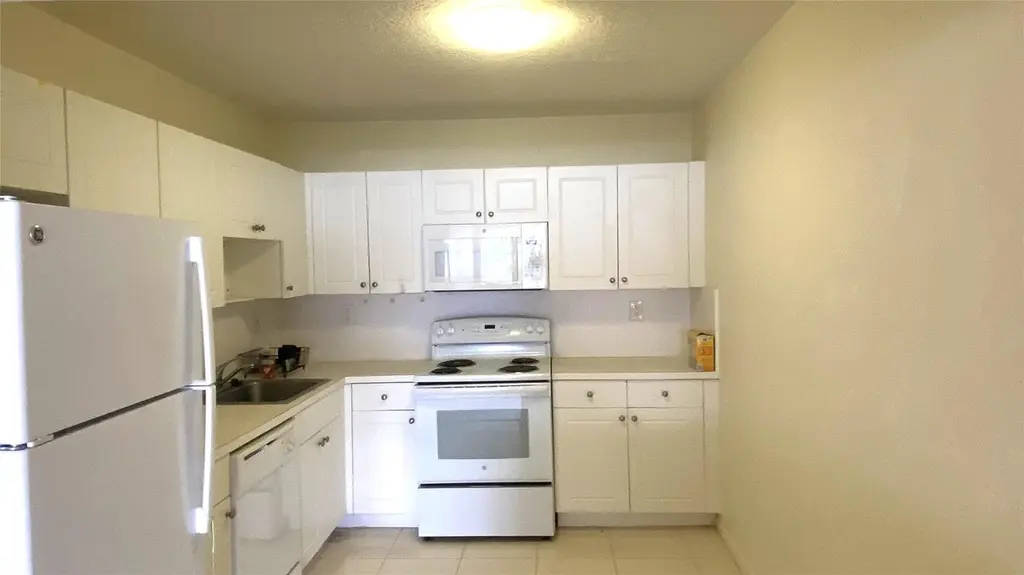
Ideal investment opportunity, just west of Federal HWY! This stunning 1-bedroom, 1.5-bath condo features high-impact windows for peace of mind. Enjoy modern living with updated laminate floors and tiled kitchen and baths. With the 40-year inspection done and all assessments paid, it's truly move-in and rental-ready. A month-to-month tenant rents at $1,675/month and is willing to stay. Located in a high-demand area close to I-95 and Deerfield Beach, this condo offers access to two pools, inviting grounds, a small gym, and is pet-friendly. Don't miss this investment gem!
Key facts
- $550 HOA
- Parking
- Community pool
Property features AI
Finance
- Financial info: No land lease
- HOA & community: Monthly association fee (includes water, sewer, trash); Fitness center; Pool; Pets allowed with breed restrictions; Community of 110 units
Exterior
- Parking: Open guest parking (1 space)
- Security: Entry phone/intercom
- Utilities: Public water; Public sewer; Cable available; Electricity available; Water connected; Sewer available
- Home design: Condominium; Two-story building; Second-floor entry; North-facing
- Construction: CBS construction; Mixed roof
- Exterior features: Pergola; Not waterfront
Interior
- Kitchen: Dishwasher; Electric range; Microwave; Refrigerator
- Bedrooms: One main-level bedroom
- Flooring: Ceramic tile; Laminate; Tile; Wood
- Bathrooms: One full bathroom; One half bathroom
- Heating & cooling: Central electric heating; Central air conditioning (electric)
- Interior features: Unfurnished; Blinds; Entry - Phone/Intercom
- Laundry & utility: Common area laundry
Neighborhood map
What this means for you Summary
Snapshot
- This is a 1-bed/1.5-bath single-family listed at $149k.
Deal economics
- At list price, monthly cash flow is $-27 ($-322/yr) — negative.
- To cash-flow at today's rent, offer at most $145k (2.6% below list).
- Meets the 1% rule at list price ($2k rent vs $149k).
- Recommended offer: $145k (2.6% below list) — sets the bar for cash-flow.
- Cap rate 6.1% vs local median 4.1% in Deerfield Beach — top-decile yield for the area; either an underpriced asset or a hidden risk that comps aren't pricing in. Stress-test before assuming the spread holds.
Location & tenants
- Location reads 75/100 on livability (#250 in FL, #3,970 nationally) — a middle-class / working-renter tenant base. Strengths: housing A+, health & safety A+, cost of living A; Watch: amenities D-, employment D-.
- Broward (suburban): math 42% / reading 53% proficiency, ranked #46 of 73 in FL (top 63%) — families likely to look elsewhere, expect single-tenant / working-renter base with shorter leases.
- Zoned schools: Deerfield Beach Elementary School (math 26% / reading 42%, grade F, #1,744 of 2,144 statewide, top 82%, 592 students, 74% FRL); Deerfield Beach Middle School (math 30% / reading 39%, grade F, #421 of 571 statewide, top 74%, 1,140 students, 72% FRL); Deerfield Beach High School (math 12% / reading 37%, grade F, #505 of 667 statewide, top 79%, 2,251 students, 69% FRL) — zoned schools average 72% FRL vs 51% district-wide (21 pts higher); higher-poverty schools than district average — tighter screening recommended.
- Zoned-school proficiency averages 31% at this address vs 48% district-wide (-16 pts) — the specific schools serving this property underperform the Broward average; the district grade overstates school quality for this exact location.
- Market conditions: Rents rising (+2.2%/yr); 300 active listings in the ZIP; 40 comparable units currently listed for rent nearby; rentals at typical pace (median 16d on market — plan ~3-4 weeks tenant-placement turnaround); 2,111 units permitted in Broward County in 2024 (1,265 in 5+ unit buildings).
- This rent runs 40% of the median local income ($59k/yr) — at the standard rent-burdened threshold; future hikes will face affordability resistance.
Forward outlook
- Local home prices are declining (-3.0%/yr); year-one equity from $1k of loan paydown is wiped out by about $4k of value loss. Plan a longer hold.
- Broward County population projected at +34% by 2050 — long-run rental-demand tailwind backs the buy-and-hold thesis.
Negotiation context
- Only 1 days on market — expect competitive offers; lowballing is unlikely to land.
- 3 sale attempts since 3y ago; this cycle's ask is 6673% above the opening price — seller raised mid-cycle; expect resistance to lowballs.
Risks & watch-outs
- Watch-outs: HOA is 28% of rent.
- Climate carrying-cost: severe wind risk, 99% chance of damaging wind over 30y; extreme-heat days projected 7→26/yr by 2055 (HVAC capex compounding) — expect insurance premiums to compound above CPI over the hold.
Questions for the listing agent
- What do current leases actually rent for vs. the listed asking? Can we see a recent rent roll and the last 12 months of T-12 income?
- Built in 1973 — when were the roof, HVAC, electrical panel, plumbing, and water heater last replaced?
- What does the HOA fee cover, when was the last increase, and are there any pending special assessments or reserve-fund shortfalls?
- Is there a deadline driving the sale (1031 exchange, divorce, estate, relocation)? That informs how much negotiation room exists.
- Schools are D-rated, which usually means shorter tenancies and higher turnover. Who's the typical renter profile here, and what's been the actual vacancy rate?
- The area grade is low — what's the realistic commute time and amenity access for the typical tenant pool here? Any planned neighborhood developments (good or bad) we should know about?
- What's the average days-on-market for RENTAL listings here right now (not sales)? A rising rental-DOM trend means longer vacancies and softer asking-rent achievability than the comps imply.
- What's the recent tenant-quality profile in this submarket — average credit score on applications, eviction rate, late-payment / NSF rate, and stable-employment percentage? A property-management company in the area should have these aggregated.
- How much new for-sale + rental construction is in the pipeline within 1–3 miles? Heavy new supply typically softens prices + rents 12–24 months out; constrained supply supports both.
Investment metrics
- 1% rule
- 1.32% ✓
- Cap rate
- 6.08%
- Cash-on-cash
- -0.77%
- DSCR
- 0.97
- GRM
- 6.3
CMA / ARV
No comps found within radius.
Projected returns pro-forma
-3.0% appreciation · 2.17% rent growth · sell at horizon
- IRR
- -18.7%
- Equity multiple
- 0.35×
- Total profit
- $-27,112
- Equity at exit
- $22,216
- IRR
- -13.3%
- Equity multiple
- 0.26×
- Total profit
- $-30,882
- Equity at exit
- $12,883
Cash invested: $41,720 (down + closing). Projections, not guarantees.
Landlord ↔ Tenant lean methodology
- Overall (STATE)
- 87 Strongly Landlord-Friendly
- State Florida
- 87 Strongly Landlord-Friendly · R+3
- County
- — inherits STATE
- City
- — inherits STATE
ZIP-level market 33441
- Rents YoY
- 2.2%
- Active inventory
- 300
- Price-to-rent
- 6.3×
Monthly cashflow live
- Estimated rent
- $1,966 high interval (Pro) →
- Mortgage (P&I)
- −$781
- Tax est. 1.5%
- −$186 /mo · $2,235/yr
- Insurance
- −$62
- HOA
- −$550
- Vacancy / Maint / Mgmt
- −$413
- Net cashflow
- $-27
Break-even live
Sensitivity live
| Price | -10% $76 | -5% $25 | +0% $-27 | +5% $-78 | +10% $-130 |
|---|---|---|---|---|---|
| Rent | -10% $-182 | -5% $-104 | +0% $-27 | +5% $51 | +10% $128 |
| Rate | -1.0pp $48 | -0.5pp $11 | base $-27 | +0.5pp $-65 | +1.0pp $-105 |
UW: 25.0% down · 7.5% · 30yr · 1.5% tax · 5.0% vac · 8.0% maint · 8.0% mgmt
Financing live
Cash to close
- Down payment
- $37,250
- Closing costs
- $4,470
- Reserves months
- —
- Total cash needed
- —
Loan-product check · same deal, 3 products live
Conventional
25% down · 7.5% · 30yr
- Down + closing
- —
- Monthly P&I
- —
- Monthly cashflow
- —
- DSCR
- —
- Eligible?
- —
Personal DTI + credit; lowest rate.
DSCR
20% down · 8.5% · 30yr
- Down + closing
- —
- Monthly P&I
- —
- Monthly cashflow
- —
- DSCR
- —
- Eligible?
- —
No personal income docs; deal must DSCR.
Hard money
10% down · 12.0% · 12mo
- Down + closing
- —
- Monthly P&I
- —
- Monthly cashflow
- —
- DSCR
- —
- Eligible?
- —
Short-term bridge; refi at stabilization.
Rent comps 40 comps
| Address | Beds | Baths | Sqft | Rent | $/sqft | DOM | Units | Dist |
|---|---|---|---|---|---|---|---|---|
| 770 SE 2nd Ave Deerfield Beach, FL | 1.0–2.0 | 1.5–2.0 | 855 | $1,700 | $1.99 | 12d | 2 | 0.01mi |
| 770 SE 2nd Ave Deerfield Beach, FL | 1.0–2.0 | 1.5–2.0 | 855 | $1,600 | $1.87 | 1d | 3 | 0.01mi |
| 770 SE 2nd Ave Deerfield Beach, FL | 1.0–2.0 | 1.5–2.0 | 855 | $1,650 | $1.93 | 9d | 3 | 0.01mi |
| 285 SE 10th St Unit 8A Deerfield Beach, FL | 2.0 | 2.0 | 972 | $2,400 | $2.47 | 22d | 1 | 0.03mi |
| 265 SE 10th St Unit 1C Deerfield Beach, FL | 2.0 | 2.0 | 1012 | $2,500 | $2.47 | 6d | 1 | 0.07mi |
| 265 SE 10th St Unit 1C Deerfield Beach, FL | 2.0 | 2.0 | 1012 | $2,500 | $2.47 | 7d | 1 | 0.07mi |
| 760 SE 2nd Ave Unit D216 Deerfield Beach, FL | 2.0 | 2.0 | 910 | $2,100 | $2.31 | 1d | 1 | 0.08mi |
| 899 SE 2nd Ave #218 Deerfield Beach, FL | 1.0 | 1.5 | 775 | $1,750 | $2.26 | 17d | 1 | 0.08mi |
| 899 SE 2nd Ave #218 Deerfield Beach, FL | 1.0 | 1.5 | 775 | $1,750 | $2.26 | 18d | 1 | 0.08mi |
| 760 SE 2nd Ave Unit C207 Deerfield Beach, FL | 1.0 | 1.5 | 765 | $1,700 | $2.22 | 26d | 1 | 0.08mi |
| 760 SE 2nd Ave Unit D112 Deerfield Beach, FL | 1.0 | 1.5 | 765 | $1,700 | $2.22 | 4d | 1 | 0.08mi |
| 959 SE 2nd Ave #204 Deerfield Beach, FL | 2.0 | 2.0 | 1000 | $2,000 | $2.00 | 17d | 1 | 0.11mi |
| 959 SE 2nd Ave #101 Deerfield Beach, FL | 1.0 | 1.5 | 800 | $1,695 | $2.12 | 4d | 1 | 0.11mi |
| 700 SE 2nd Ave #315 Deerfield Beach, FL | 2.0 | 2.0 | 920 | $2,000 | $2.17 | 22d | 1 | 0.11mi |
| 959 SE 2nd Ave Deerfield Beach, FL | 1.0–2.0 | 1.5–2.0 | 900 | $1,695 | $1.88 | 18d | 2 | 0.11mi |
| 495 SE 8th St #237 Deerfield Beach, FL | 2.0 | 2.0 | 1100 | $1,875 | $1.70 | 26d | 1 | 0.15mi |
| 1100 SE 4th Ave Deerfield Beach, FL | 2.0 | 1.5–2.0 | 1080 | $1,900 | $1.76 | 26d | 2 | 0.16mi |
| 555 SE 8th St #151 Deerfield Beach, FL | 1.0 | 1.5 | 925 | $1,800 | $1.95 | 14d | 1 | 0.20mi |
| 737 SE 1st Way #302 Deerfield Beach, FL | 2.0 | 2.0 | 1070 | $2,100 | $1.96 | 26d | 1 | 0.20mi |
| 737 SE 1st Way Deerfield Beach, FL | 1.0–2.0 | 1.0–2.0 | 885 | $1,575 | $1.78 | 1d | 2 | 0.20mi |
| 791 SE 1st Way #74 Deerfield Beach, FL | 2.0 | 2.5 | 1070 | $2,250 | $2.10 | 1d | 1 | 0.20mi |
| 400 SE 10th St Deerfield Beach, FL | 2.0 | 2.0 | 970 | $2,250 | $2.32 | 4d | 2 | 0.22mi |
| 733 SE 1st Way #109 Deerfield Beach, FL | 2.0 | 2.0 | 1033 | $2,850 | $2.76 | 17d | 1 | 0.22mi |
| 733 SE 1st Way #109 Deerfield Beach, FL | 2.0 | 2.0 | 1033 | $2,700 | $2.61 | 1d | 1 | 0.22mi |
| 530 SE 2nd Ave Unit F24 Deerfield Beach, FL | 2.0 | 1.0 | 840 | $1,800 | $2.14 | 24d | 1 | 0.23mi |
| 610 SE 2nd Ave Unit L8 Deerfield Beach, FL | 2.0 | 1.0 | 840 | $1,680 | $2.00 | 7d | 1 | 0.23mi |
| 560 SE 2nd Ave Deerfield Beach, FL | 2.0 | 1.0 | 840 | $1,750 | $2.08 | 18d | 1 | 0.23mi |
| 610 SE 2nd Ave Unit L8 Deerfield Beach, FL | 2.0 | 1.0 | 840 | $1,725 | $2.05 | 9d | 1 | 0.23mi |
| 540 SE 2nd Ave Unit J4 Deerfield Beach, FL | 1.0 | 1.0 | 650 | $1,500 | $2.31 | 9d | 1 | 0.24mi |
| 550 SE 2nd Ave Unit G3 Deerfield Beach, FL | 1.0 | 1.0 | 650 | $1,550 | $2.38 | 9d | 1 | 0.25mi |
| 1100 SE 4th Ave #35 Deerfield Beach, FL | 2.0 | 1.5 | 1080 | $1,900 | $1.76 | 14d | 1 | 0.28mi |
| 810 SE 7th St Unit A307 Deerfield Beach, FL | 1.0 | 1.5 | 800 | $1,200 | $1.50 | 26d | 1 | 0.31mi |
| 500 SE 2nd Ave #22 Deerfield Beach, FL | 2.0 | 1.0 | 840 | $1,850 | $2.20 | 20d | 1 | 0.33mi |
| 777-779 S Federal Hwy Ph 16 Pompano Beach, FL | 2.0 | 1.5 | 911 | $1,995 | $2.19 | 26d | 1 | 0.36mi |
| 431 SE 13th Ct Deerfield Beach, FL | 2.0 | 2.0 | 1100 | $2,160 | $1.96 | 16d | 1 | 0.37mi |
| 431 SE 13th Ct Deerfield Beach, FL | 1.0 | 2.0 | 850 | $1,805 | $2.12 | 7d | 1 | 0.37mi |
| 431 SE 13th Ct Deerfield Beach, FL | 2.0 | 2.0 | 1100 | $2,255 | $2.05 | 22d | 1 | 0.37mi |
| 431 SE 13th Ct Deerfield Beach, FL | 2.0 | 2.0 | 1100 | $2,225 | $2.02 | 26d | 1 | 0.37mi |
| 1404 SE 3rd Ter Deerfield Beach, FL | 2.0 | 1.0 | 955 | $2,400 | $2.51 | 18d | 1 | 0.55mi |
| 1417 SE 3rd Ter Deerfield Beach, FL | 1.0 | 1.0 | 570 | $1,300 | $2.28 | 12d | 1 | 0.58mi |
HOA detail
- Monthly dues
- $550 · $6,600/yr
- Likely covers
- landscapingpoolgym
Listing history 2 events
-
2026-06-18remarks 575-char remark
-
2026-06-18$149,000 Active 1 DOM
ⓘ Source: listings_history table (triggers on properties + properties_extension) + one-shot
backfill from property_details.listing_events for pre-trigger history.
Climate risk First Street
- Flood 3/10 Moderate FEMA zone X (unshaded) · 12% chance over 30 yrs
- Wildfire 1/10 Low
- Heat 10/10 Extreme 7 d/yr ≥106°F today · 26 d/yr by 30 yrs out
- Wind 10/10 Extreme 99% chance of damaging wind over 30 yrs
- Air quality 2/10 Low 1 unhealthy d/yr today · 3 by 30 yrs out
Nearby sold comps map
Loading sold comps map…
Walkable amenities ~0.75 mi
Loading nearby amenities…
Taxation est. · year 1
- Rental income
- $23,589
- − Mortgage interest
- −$8,346
- − Property taxes
- −$2,235
- − Insurance
- −$745
- − Repairs & maintenance
- −$1,887
- − Management
- −$1,887
- − HOA
- −$6,600
- − Depreciation
- −$4,335
- Taxable loss
- −$2,447
- Est. tax savings @ 24.0%
- +$587
- After-tax cash flow
- $266/yr
For passive investors: Depreciation is non-cash, so a rental often shows a tax loss while cash-flowing — sheltering income. Rental losses are passive: they offset passive income freely, and up to $25,000/yr can offset ordinary (W-2) income if you actively participate and your MAGI is under $100k (phasing out to $0 by $150k); unused losses carry forward. On sale, claimed depreciation is recaptured at up to 25%, and gains may owe capital-gains tax (a 1031 exchange can defer both). Figures are a year-1 estimate at your 24.0% rate — not tax advice; consult a CPA.
Schools (NCES district)
- District
- Broward
- NCES district ID
- 1200180
- Math proficiency
- 42% ▼ -18.00%
- Reading proficiency
- 53% ▼ -5.00%
- Median HH income
- $52,139
- Composite
- 40.88/100
- National rank
- #3621
- State rank
- #46 of 73 in FL
Livability — Deerfield Beach
- Score
- 75/100
- State rank
- #250
- US rank
- #3970
Category grades
Schools grade is shown separately in the Schools card above.
Census & demographics
- Census place
- Deerfield Beach, FL
- County
- Broward County · 1,963,430 people
- City population
- 61,449
- Metro
- Miami-Fort Lauderdale-Pompano Beach, FL
- Population (ZIP)
- 30,153
- Household income
- $58,594
- Rent vs Own
- Severe rent burden
- 2148.0
Population outlook (Broward County) Hauer SSP2
- Today (2025)
- 2,207,033 people
- By 2030
- 2,360,704 · +7.0%
- By 2040
- 2,661,208 · +20.6%
- By 2050
- 2,946,698 · +33.5%
- By 2075
- 3,602,273 · +63.2%
- By 2100
- 3,970,984 · +79.9%
Race, ethnicity, and origin ACS 2023
- Neighborhood character
- Highly diverse neighborhood (Simpson 0.71)
- Race & ethnicity
- White 39% Black 33% Hispanic / Latino 17% Two or more races 15% Asian 2%
- Hispanic origin (detail)
- Mexican 2% Puerto Rican 1% Cuban 3% Dominican 1%
- Common ancestry
- Hispanic 11% Estonian 5% Romanian 3%
- Foreign-born
- 29% · Canada, Jamaica, Guatemala
- Languages at home
- 65% English-only · Spanish 13% French/Haitian/Cajun 11% Other Indo-European 9%
Political lean MEDSL · Broward
- 2024 margin
- D (+17.0) · D 58.0% · R 41.0%
- 2008→2024 swing
- -17.8pp toward R · 2008: 34.7pp · 2024: 17.0pp
- All cycles
- 2024: D+17.0 2020: D+29.8 2016: D+35.0 2012: D+34.9 2008: D+34.7
Not yet ingested
- Civics
- —
Market trends
- HPI YoY
- ▼ -353.25%
- Current HPI
- 404.3829
- Rent YoY
- ▲ 2.17%
- Metro
- Miami-Fort Lauderdale-Pompano Beach, FL
- State GDP YoY
- ▲ 3.28%
- F500 in state
- 36
Industry mix (Fortune 500 HQ in FL)
| Industry | F500 HQs | Revenue |
|---|---|---|
| Industrial Technology | 2 | $29B |
|
||
| Insurance | 2 | $17B |
|
||
| Retail | 1 | $60B |
|
||
| Technology Distribution | 1 | $58B |
|
||
| Homebuilding | 1 | $35B |
|
||
| Technology Manufacturing | 1 | $35B |
|
||
Price history
+15.8% since first listed6 events — show timeline
- 2025-09-12 Rental Removed $2,200 ZUMPER1
- 2025-07-25 Listed for Rent $2,200 ZUMPER1
- 2024-03-09 Rental Removed $2,000 RMLSFL
- 2024-02-04 Listed for Rent $2,000 RMLSFL
- 2023-11-18 Rental Removed $1,900 RMLSFL
- 2023-10-26 Listed for Rent $1,900 RMLSFL
Cash-flow waterfall
monthlySold comps — $/sqft
last 12 mo · ≤1 miLoading sold comps…