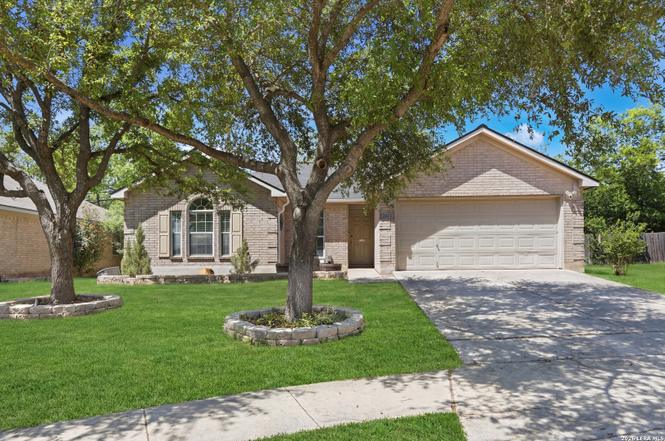
2611 Cloudy Mdw · San Antonio, TX
Flood risk 1/10 · Minimal
- FEMA flood zone
- X (unshaded)
- Chance of flooding over 30 yrs
- 0.0%
- Est. flood insurance / yr
- $507 – $1,088
Fire risk 4/10 · Minor
- Est. fire insurance / yr
- $1,222 – $2,270
Heat risk 8/10 · Major
- Hot days now (above 110°F)
- 7 days/yr
- Hot days in 30 yrs
- 22 days/yr
Wind risk 8/10 · Major
- Chance of severe wind over 30 yrs
- 80.0%
Air-quality risk 2/10 · Minimal
- Unhealthy air days now
- 0 days/yr
- Unhealthy air days in 30 yrs
- 2 days/yr
Risk factors via First Street. Map © Google.
Why this score? — see what drove the D- grade
The composite is a weighted blend of 9 inputs, each scored 0–100. Each bar is that input's sub-score; the figure is the points it added to the 100-point composite (weight × sub-score).
- Cash flow +11.5/30.0
- ARV discount +8.2/15.0
- 1% rule +4.5/10.0
- Livability +4.0/5.0
- Rent growth +3.6/5.0
- DSCR +3.4/10.0
- Condition / age +2.5/5.0
- Schools +1.9/10.0
- Appreciation +0.0/10.0
$178,500
🖨 Deal sheet 📄 Offer letter ✓ Due diligence
Listing remarks
This beautiful home is truly a gem, offering exceptional value along with timeless charm and character. The inviting living area features a cozy fireplace, creating the perfect space to relax or entertain. An open-concept layout seamlessly connects the kitchen and breakfast area, making everyday living both comfortable and functional. Step outside to enjoy a private backyard with no rear neighbors, providing added tranquility. The landscaping is beautifully maintained in both the front and back, enhanced by a fully functioning irrigation system that keeps the lawn lush and green year-round. Major updates have already been taken care of, including a new roof installed in July 2025 and a bran
Key facts
- No rear neighbors
- Private backyard
- Water softener
Tags
Property features AI
Finance
- Financial info: Down payment resources available
- HOA & community: Mandatory HOA; HOA dues $120 annually; Association transfer fee $200
Exterior
- Parking: 2-car garage; Converted garage (additional living/utility space)
- Security: Owned security system; Smoke alarm
- Utilities: City water and sewer
- Home design: Pre-owned single-family home; Approximately 22 years old
- Construction: Slab foundation; Composition roof
- Exterior features: Private pool; Brick, 4-sided masonry exterior; Lot in Foster Meadows subdivision; Park/playground, jogging trails and basketball court in the community
Interior
- Kitchen: Self-cleaning oven; Stove/Range; Dishwasher; Disposal; Ice maker connection; 12 x 8 kitchen
- Bedrooms: Master bedroom with walk-in closet, ceiling fan and full bath; Bedroom 2: 12 x 12; Bedroom 3: 11 x 10; Bedroom 4: 14 x 11; Master bedroom dimensions: 14 x 12
- Flooring: Ceramic tile flooring
- Bathrooms: 2 full bathrooms; Master bath with separate tub and shower and double vanity; Master bath dimensions: 10 x 8
- Heating & cooling: Central heating (electric); Central air conditioning
- Interior features: Ceiling fans; Washer and dryer connections; Self-cleaning oven; Stove/Range; Disposal; Dishwasher; Ice maker connection; Vent fan; Smoke alarm; Owned security system; Electric water heater; Open floor plan; Converted garage; Pull-down storage; Utility room inside; Separate dining room; Breakfast bar; Some window coverings remain; 1 living area
- Laundry & utility: Washer connection; Dryer connection; Utility room inside
Neighborhood map
What this means for you Summary
Snapshot
- This is a 3-bed/2.0-bath single-family listed at $178k.
Deal economics
- At list price, monthly cash flow is $-58 ($-693/yr) — negative.
- To cash-flow at today's rent, offer at most $168k (5.7% below list).
- To meet the 1% rule (rent ≥ 1% of price), the offer needs to be $169k (5.1% below list).
- Recommended offer: $168k (5.7% below list) — sets the bar for cash-flow.
- Cap rate 5.9% vs local median 3.8% in San Antonio — top-decile yield for the area; either an underpriced asset or a hidden risk that comps aren't pricing in. Stress-test before assuming the spread holds.
Location & tenants
- Location reads 80/100 on livability (#31 in TX, #1,616 nationally) — a professional / high-income tenant draw. Strengths: amenities A+, commute A+, cost of living A+; Watch: crime F.
- East Central ISD (rural): math 16% / reading 25% proficiency, ranked #758 of 826 in TX (top 92%) — low school quality limits family demand, transient renter base, plan for 1-2y turnover; 61% free/reduced lunch — lower-income household profile, screen leases tightly.
- Zoned schools: Sinclair El (math 13% / reading 20%, grade F, #3,946 of 4,322 statewide, top 92%, 721 students, 71% FRL); East Central H S (math 21% / reading 28%, grade F, #1,264 of 1,632 statewide, top 82%, 3,252 students, 52% FRL) — zoned schools at 61% FRL track the district average.
- Market conditions: Rents rising fast (+4.3%/yr); 428 active listings in the ZIP; 40 comparable units currently listed for rent nearby; rentals at typical pace (median 20d on market — plan ~3-4 weeks tenant-placement turnaround); 8,308 units permitted in Bexar County in 2024 (2,506 in 5+ unit buildings).
- This rent runs 31% of the median local income ($66k/yr) — at the standard rent-burdened threshold; future hikes will face affordability resistance.
Forward outlook
- Local home prices are declining (-3.0%/yr); year-one equity from $1k of loan paydown is wiped out by about $5k of value loss. Plan a longer hold.
- Bexar County population projected at +50% by 2050 — long-run rental-demand tailwind backs the buy-and-hold thesis.
Negotiation context
- It's been on market 34 days — a 3% lower offer ($173k) is reasonable based on typical stale-listing flexibility.
- 5 sale attempts since 12y ago with the ask held roughly flat each time — persistent listings suggest the price (not the market) is what's stuck; bring a comps-based counter.
Risks & watch-outs
- Watch-outs: property tax is 2.5% of price.
- Climate carrying-cost: severe wind risk, 80% chance of damaging wind over 30y; extreme-heat days projected 7→22/yr by 2055 (HVAC capex compounding) — expect insurance premiums to compound above CPI over the hold.
Questions for the listing agent
- What do current leases actually rent for vs. the listed asking? Can we see a recent rent roll and the last 12 months of T-12 income?
- It's been on market 34 days. Have you received any prior offers? Is the seller open to a 6% concession, seller financing, or rate buy-down credit?
- Property tax is high relative to price — has the assessment been appealed recently, and will the sale trigger a re-assessment?
- What does the HOA fee cover, when was the last increase, and are there any pending special assessments or reserve-fund shortfalls?
- Is there a deadline driving the sale (1031 exchange, divorce, estate, relocation)? That informs how much negotiation room exists.
- Crime grade is F in this area — have there been break-ins, vandalism, or insurance claims at this property in the last 3 years? What carrier currently insures it and at what premium?
- The area grade is low — what's the realistic commute time and amenity access for the typical tenant pool here? Any planned neighborhood developments (good or bad) we should know about?
- What's the average days-on-market for RENTAL listings here right now (not sales)? A rising rental-DOM trend means longer vacancies and softer asking-rent achievability than the comps imply.
- What's the recent tenant-quality profile in this submarket — average credit score on applications, eviction rate, late-payment / NSF rate, and stable-employment percentage? A property-management company in the area should have these aggregated.
- How much new for-sale + rental construction is in the pipeline within 1–3 miles? Heavy new supply typically softens prices + rents 12–24 months out; constrained supply supports both.
Investment metrics
- 1% rule
- 0.95% ✗
- Cap rate
- 5.90%
- Cash-on-cash
- -1.39%
- DSCR
- 0.94
- GRM
- 8.8
CMA / ARV
- ARV (on-the-fly)
- $181,302
- Comps found
- 12
Show comp detail 12 sales within ~0.75 mi
| Address | Dist | Beds/Ba | Sqft | Sold | Price | $/sf | Match |
|---|---|---|---|---|---|---|---|
| 6018 Bear Mdw | 0.22mi | 3/2.0 | 1,344 (-1%) | 8mo | $115,000 | $86 | 82 |
| 5922 Lakedale | 0.21mi | 3/2.0 | 1,288 (-5%) | 9mo | $170,000 | $132 | 75 |
| 6223 Still Mdw | 0.41mi | 3/2.0 | 1,330 (-2%) | 5mo | $139,000 | $105 | 74 |
| 6122 Pleasant Mdw | 0.36mi | 3/2.0 | 1,330 (-2%) | 10mo | $199,000 | $150 | 72 |
| 6002 Blind | 0.38mi | 3/2.0 | 1,232 (-9%) | 2mo | $100,000 | $81 | 66 |
| 6127 Southern Vis | 0.55mi | 3/2.5 | 1,415 (+5%) | 1mo | $189,900 | $134 | 64 |
| 6423 Woodcliff Bnd | 0.54mi | 3/2.5 | 1,415 (+5%) | 3mo | $190,000 | $134 | 62 |
| 3831 Southton | 0.59mi | 3/2.5 | 1,415 (+5%) | 1mo | $190,000 | $134 | 62 |
| 3438 Southton Vw | 0.42mi | 3/2.5 | 1,415 (+5%) | 10mo | $189,900 | $134 | 62 |
| 2814 Lakebriar | 0.28mi | 4/2.0 (+1) | 1,488 (+10%) | 6mo | $114,900 | $77 | 60 |
| 4615 Flying Hooves | 0.74mi | 3/2.5 | 1,286 (-5%) | 0mo | $199,990 | $156 | 55 |
| 3226 Cattail Holw | 0.70mi | 3/2.0 | 1,412 (+4%) | 7mo | $258,240 | $183 | 54 |
Match score weights: distance 35% · size 25% · config 20% · recency 20%. Top-matched comps best support the ARV.
Projected returns pro-forma
-3.0% appreciation · 4.35% rent growth · sell at horizon
- IRR
- -16.8%
- Equity multiple
- 0.40×
- Total profit
- $-30,145
- Equity at exit
- $26,615
- IRR
- -6.0%
- Equity multiple
- 0.59×
- Total profit
- $-20,645
- Equity at exit
- $15,433
Cash invested: $49,980 (down + closing). Projections, not guarantees.
Landlord ↔ Tenant lean methodology
- Overall (STATE)
- 87 Strongly Landlord-Friendly
- State Texas
- 87 Strongly Landlord-Friendly · R+5
- County
- — inherits STATE
- City
- — inherits STATE
ZIP-level market 78222
- Home prices YoY
- -4.8%
- Rents YoY
- 4.3%
- Active inventory
- 428
- Price-to-rent
- 8.8×
Monthly cashflow live
- Estimated rent
- $1,693 high interval (Pro) →
- Mortgage (P&I)
- −$936
- Tax from tax record
- −$375 /mo · $4,498/yr
- Insurance
- −$74
- HOA
- −$10
- Vacancy / Maint / Mgmt
- −$356
- Net cashflow
- $-58
Break-even live
UW: 25.0% down · 7.5% · 30yr · 1.5% tax · 5.0% vac · 8.0% maint · 8.0% mgmt
Financing live
Cash to close
- Down payment
- $44,625
- Closing costs
- $5,355
- Reserves months
- —
- Total cash needed
- —
Loan-product check · same deal, 3 products live
Conventional
25% down · 7.5% · 30yr
- Down + closing
- —
- Monthly P&I
- —
- Monthly cashflow
- —
- DSCR
- —
- Eligible?
- —
Personal DTI + credit; lowest rate.
DSCR
20% down · 8.5% · 30yr
- Down + closing
- —
- Monthly P&I
- —
- Monthly cashflow
- —
- DSCR
- —
- Eligible?
- —
No personal income docs; deal must DSCR.
Hard money
10% down · 12.0% · 12mo
- Down + closing
- —
- Monthly P&I
- —
- Monthly cashflow
- —
- DSCR
- —
- Eligible?
- —
Short-term bridge; refi at stabilization.
Rent comps 40 comps
| Address | Beds | Baths | Sqft | Rent | $/sqft | DOM | Units | Dist |
|---|---|---|---|---|---|---|---|---|
| 2610 Lakebriar St San Antonio, TX | 3.0 | 2.0 | 1724 | $1,675 | $0.97 | 44d | 1 | 0.19mi |
| 6119 Lakefront St San Antonio, TX | 3.0 | 2.5 | 1246 | $1,495 | $1.20 | 44d | 1 | 0.26mi |
| 6147 Still Mdw San Antonio, TX | 3.0 | 2.0 | 1556 | $1,459 | $0.94 | 3d | 1 | 0.38mi |
| 2911 Lakebriar St San Antonio, TX | 4.0 | 2.0 | 1440 | $1,695 | $1.18 | 3d | 1 | 0.39mi |
| 2911 Lakebriar St San Antonio, TX | 4.0 | 2.0 | 1440 | $1,695 | $1.18 | 22d | 1 | 0.39mi |
| 6123 Flower Mdw San Antonio, TX | 4.0 | 2.0 | 1800 | $1,795 | $1.00 | 44d | 1 | 0.40mi |
| 2906 Lavender Mdw San Antonio, TX | 3.0 | 2.5 | 1246 | $1,495 | $1.20 | 2d | 1 | 0.43mi |
| 6223 Still Mdw San Antonio, TX | 3.0 | 2.0 | 1330 | $1,650 | $1.24 | 4d | 1 | 0.44mi |
| 2951 Lavender Mdw San Antonio, TX | 3.0 | 2.5 | 1246 | $1,530 | $1.23 | 12d | 1 | 0.50mi |
| 6115 Southern Vis San Antonio, TX | 3.0 | 2.0 | 1415 | $1,509 | $1.07 | 3d | 1 | 0.55mi |
| 6119 Southern Vis San Antonio, TX | 3.0 | 2.5 | 1246 | $1,685 | $1.35 | 24d | 1 | 0.56mi |
| 6427 Woodcliff Bnd San Antonio, TX | 3.0 | 2.5 | 1247 | $1,440 | $1.15 | 11d | 1 | 0.57mi |
| 3155 Begonia Bnd San Antonio, TX | 3.0 | 2.0 | 1552 | $1,495 | $0.96 | 12d | 1 | 0.63mi |
| 3219 Begonia Bnd San Antonio, TX | 3.0 | 2.0 | 1552 | $1,500 | $0.97 | 4d | 1 | 0.65mi |
| 6307 Sloane Cv San Antonio, TX | 3.0 | 2.5 | 1416 | $1,510 | $1.07 | 20d | 1 | 0.65mi |
| 3239 Begonia Bnd San Antonio, TX | 3.0 | 2.0 | 1552 | $1,435 | $0.92 | 24d | 1 | 0.68mi |
| 3131 Rosalind Way San Antonio, TX | 3.0 | 2.5 | 1247 | $1,650 | $1.32 | 24d | 1 | 0.70mi |
| 5910 Sandy Lake St San Antonio, TX | 3.0 | 2.0 | 1389 | $2,100 | $1.51 | 44d | 1 | 0.72mi |
| 5334 Hickory Pl San Antonio, TX | 3.0 | 2.0 | 1401 | $1,650 | $1.18 | 44d | 1 | 0.77mi |
| 6323 Sinclair Rd San Antonio, TX | 3.0 | 2.0 | 1556 | $1,510 | $0.97 | 24d | 1 | 0.77mi |
| 5338 Natho St San Antonio, TX | 3.0 | 2.0 | 1298 | $1,349 | $1.04 | 12d | 1 | 0.79mi |
| 5334 Natho St San Antonio, TX | 3.0 | 2.0 | 1298 | $1,325 | $1.02 | 4d | 1 | 0.80mi |
| 5322 Flying Hooves San Antonio, TX | 3.0 | 2.5 | 1604 | $1,900 | $1.18 | 20d | 1 | 0.82mi |
| 5227 Hickory Pl San Antonio, TX | 3.0 | 2.0 | 1199 | $1,700 | $1.42 | 24d | 1 | 0.83mi |
| 2718 Bermuda Dr San Antonio, TX | 3.0 | 3.0 | 1080 | $1,400 | $1.30 | 20d | 1 | 0.88mi |
| 2434 Bermuda Dr San Antonio, TX | 3.0 | 2.0 | 1298 | $1,414 | $1.09 | 4d | 1 | 0.88mi |
| 2430 Bermuda Dr San Antonio, TX | 3.0 | 2.0 | 1298 | $1,390 | $1.07 | 12d | 1 | 0.88mi |
| 6023 Lake Victoria St San Antonio, TX | 3.0 | 2.0 | 1368 | $1,575 | $1.15 | 12d | 1 | 0.90mi |
| 2719 Bermuda Dr San Antonio, TX | 3.0 | 2.0 | 1298 | $1,364 | $1.05 | 4d | 1 | 0.91mi |
| 6230 Lake Victoria St San Antonio, TX | 3.0 | 2.0 | 1205 | $1,465 | $1.22 | 3d | 1 | 0.92mi |
| 3510 Bottomless Lk San Antonio, TX | 2.0 | 2.0 | 1068 | $1,150 | $1.08 | 44d | 1 | 0.96mi |
| 3535 Honey Mdw San Antonio, TX | 3.0 | 2.5 | 1438 | $1,400 | $0.97 | 16d | 1 | 0.98mi |
| 4734 Shale Cv San Antonio, TX | 3.0 | 2.0 | 1247 | $1,725 | $1.38 | 24d | 1 | 1.16mi |
| 4910 Sandstone Way San Antonio, TX | 3.0 | 2.5 | 1849 | $1,750 | $0.95 | 22d | 1 | 1.27mi |
| 4910 Sandstone Way San Antonio, TX | 3.0 | 2.5 | 1850 | $1,750 | $0.95 | 3d | 1 | 1.27mi |
| 4226 Toledo Mist San Antonio, TX | 2.0 | 2.5 | 944 | $1,600 | $1.69 | 24d | 1 | 1.27mi |
| 5011 Blue Rnch San Antonio, TX | 3.0 | 2.5 | 1529 | $1,740 | $1.14 | 44d | 1 | 1.38mi |
| 5011 Jade Xing San Antonio, TX | 3.0 | 2.5 | 1239 | $1,590 | $1.28 | 44d | 1 | 1.39mi |
| 5365 Southcross Ranch Rd San Antonio, TX | 3.0 | 1.0–2.0 | 1568 | $85,000 | $54.21 | 2d | 1 | 1.40mi |
| 5015 Jade Xing San Antonio, TX | 4.0 | 2.5 | 1798 | $1,820 | $1.01 | 11d | 1 | 1.40mi |
HOA detail
- Monthly dues
- $10 · $120/yr
- Likely covers
- landscaping
Listing history 26 events
-
2026-06-18days on market $178,500 Active 34 DOM
-
2026-06-17days on market $178,500 Active 33 DOM
-
2026-06-16statusdays on market $178,500 Active 32 DOM
-
2026-06-15days on market $178,500 Price Change 31 DOM
-
2026-06-13days on market $178,500 Price Change 29 DOM
-
2026-06-09days on market $178,500 Price Change 25 DOM
-
2026-06-08days on market $178,500 Price Change 24 DOM
-
2026-06-07pricestatusdays on market $178,500 Price Change 23 DOM
-
2026-06-04statusdays on market $179,000 Back on Market 20 DOM
-
2026-06-03days on market $179,000 Active Option 19 DOM
-
2026-06-02days on market $179,000 Active Option 18 DOM
-
2026-06-01days on market $179,000 Active Option 17 DOM
-
2026-05-31days on market $179,000 Active Option 16 DOM
-
2026-05-19status Back on Market
-
2026-04-17status Pending
-
2026-04-13$179,000 New
-
2026-03-21historical
-
2025-12-15$206,500 New
-
2022-09-19soldstatus
-
2019-09-18soldstatus $180,000
-
2015-11-10historical
-
2015-07-03price $125,000
-
2015-07-03status Price Change
-
2015-06-30historical
-
2014-11-12price $129,000
-
2014-07-02$132,000 New
ⓘ Source: listings_history table (triggers on properties + properties_extension) + one-shot
backfill from property_details.listing_events for pre-trigger history.
Tax reassessment forecast TX · Resets to sale price
- Current annual tax
- $4,498 · $375/mo
- Projected year-2 tax
- $4,498 · $375/mo
- Expected delta
- $0/yr ($0/mo · 0.0%)
ⓘ Screening estimate from a state-policy table — verify with the county assessor before closing.
Climate risk First Street
- Flood 1/10 Low FEMA zone X (unshaded) · 0% chance over 30 yrs
- Wildfire 4/10 Moderate
- Heat 8/10 Severe 7 d/yr ≥110°F today · 22 d/yr by 30 yrs out
- Wind 8/10 Severe 80% chance of damaging wind over 30 yrs
- Air quality 2/10 Low 0 unhealthy d/yr today · 2 by 30 yrs out
Nearby sold comps map
Loading sold comps map…
Walkable amenities ~0.75 mi
Loading nearby amenities…
Taxation est. · year 1
- Rental income
- $20,318
- − Mortgage interest
- −$9,999
- − Property taxes
- −$4,498
- − Insurance
- −$892
- − Repairs & maintenance
- −$1,625
- − Management
- −$1,625
- − HOA
- −$120
- − Depreciation
- −$5,193
- Taxable loss
- −$3,635
- Est. tax savings @ 24.0%
- +$872
- After-tax cash flow
- $180/yr
For passive investors: Depreciation is non-cash, so a rental often shows a tax loss while cash-flowing — sheltering income. Rental losses are passive: they offset passive income freely, and up to $25,000/yr can offset ordinary (W-2) income if you actively participate and your MAGI is under $100k (phasing out to $0 by $150k); unused losses carry forward. On sale, claimed depreciation is recaptured at up to 25%, and gains may owe capital-gains tax (a 1031 exchange can defer both). Figures are a year-1 estimate at your 24.0% rate — not tax advice; consult a CPA.
Schools (NCES district)
- District
- East Central ISD
- NCES district ID
- 4817850
- Math proficiency
- 16% ▼ -12.00%
- Reading proficiency
- 25% ▼ -6.00%
- Median HH income
- $53,941
- Composite
- 18.67/100
- National rank
- #8887
- State rank
- #758 of 826 in TX
Livability — San Antonio
- Score
- 80/100
- State rank
- #31
- US rank
- #1616
Category grades
Schools grade is shown separately in the Schools card above.
Census & demographics
- Census place
- San Antonio, TX
- County
- Bexar County · 1,990,555 people
- City population
- 1,806,925
- Metro
- San Antonio-New Braunfels, TX
- Population (ZIP)
- 26,476
- Household income
- $66,362
- Rent vs Own
- Severe rent burden
- 686.0
Population outlook (Bexar County) Hauer SSP2
- Today (2025)
- 2,336,851 people
- By 2030
- 2,560,728 · +9.6%
- By 2040
- 3,020,569 · +29.3%
- By 2050
- 3,493,522 · +49.5%
- By 2075
- 4,668,459 · +99.8%
- By 2100
- 5,533,242 · +136.8%
Race, ethnicity, and origin ACS 2023
- Neighborhood character
- Majority Hispanic (64%)
- Race & ethnicity
- Hispanic / Latino 64% Two or more races 26% White 19% Black 14% Asian 1%
- Hispanic origin (detail)
- Mexican 55%
- Common ancestry
- Romanian 1% Italian 1% Slovak 1%
- Foreign-born
- 14% · Canada
- Languages at home
- 61% English-only · Spanish 37% Arabic 1%
Political lean MEDSL · Bexar
- 2024 margin
- Lean D (+9.8) · D 54.3% · R 44.6% · Other 1.1%
- 2008→2024 swing
- +4.2pp toward D · 2008: 5.6pp · 2024: 9.8pp
- All cycles
- 2024: D+9.8 2020: D+18.2 2016: D+13.5 2012: D+4.6 2008: D+5.6
Not yet ingested
- Civics
- —
Market trends
- HPI YoY
- ▼ -14.18%
- Current HPI
- 278.8429
- Rent YoY
- ▲ 4.35%
- Metro
- San Antonio-New Braunfels, TX
- State GDP YoY
- ▲ 3.95%
- F500 in state
- 110
Industry mix (Fortune 500 HQ in TX)
| Industry | F500 HQs | Revenue |
|---|---|---|
| Energy | 16 | $1,198B |
|
||
| Technology | 5 | $198B |
|
||
| Engineering / Construction | 4 | $72B |
|
||
| Energy Services | 3 | $60B |
|
||
| Utilities | 3 | $41B |
|
||
| Healthcare | 2 | $330B |
|
||
Price history
+35.6% since first listed13 events — show timeline
- 2026-05-19 Relisted — LERA
- 2026-04-17 Pending — LERA
- 2026-04-13 Listed $179,000 LERA
- 2026-03-21 Listing Removed — LERA
- 2025-12-15 Listed $206,500 LERA
- 2022-09-19 Sold (Public Records) — Public Records
- 2019-09-18 Sold (Public Records) $180,000 Public Records
- 2015-11-10 Listing Removed — LERA
- 2015-07-03 Price Changed $125,000 LERA
- 2015-07-03 Relisted — LERA
- 2015-06-30 Listing Removed — LERA
- 2014-11-12 Price Changed $129,000 LERA
- 2014-07-02 Listed $132,000 LERA
Property tax history
+4.0%/yrLatest (2025): $4,498 · +3.6% YoY. Source: county tax records.
Cash-flow waterfall
monthlySold comps — $/sqft
last 12 mo · ≤1 miLoading sold comps…