285 James St · Tomah, WI
Flood risk No data
- FEMA flood zone
- —
- Chance of flooding over 30 yrs
- —
- Est. flood insurance / yr
- —
Fire risk No data
- Est. fire insurance / yr
- —
Heat risk No data
- Hot days now (above threshold)
- —
- Hot days in 30 yrs
- —
Wind risk No data
- Chance of severe wind over 30 yrs
- —
Air-quality risk No data
- Unhealthy air days now
- —
- Unhealthy air days in 30 yrs
- —
Risk factors via First Street. Map © Google.
Why this score? — see what drove the B grade
The composite is a weighted blend of 9 inputs, each scored 0–100. Each bar is that input's sub-score; the figure is the points it added to the 100-point composite (weight × sub-score).
- Cash flow +30.0/30.0
- 1% rule +10.0/10.0
- DSCR +10.0/10.0
- ARV discount +7.5/15.0
- Livability +4.0/5.0
- Condition / age +3.8/5.0
- Rent growth +2.5/5.0
- Schools +2.4/10.0
- Appreciation +0.0/10.0
$90,000
🖨 Deal sheet 📄 Offer letter ✓ Due diligence
Listing remarks MLS
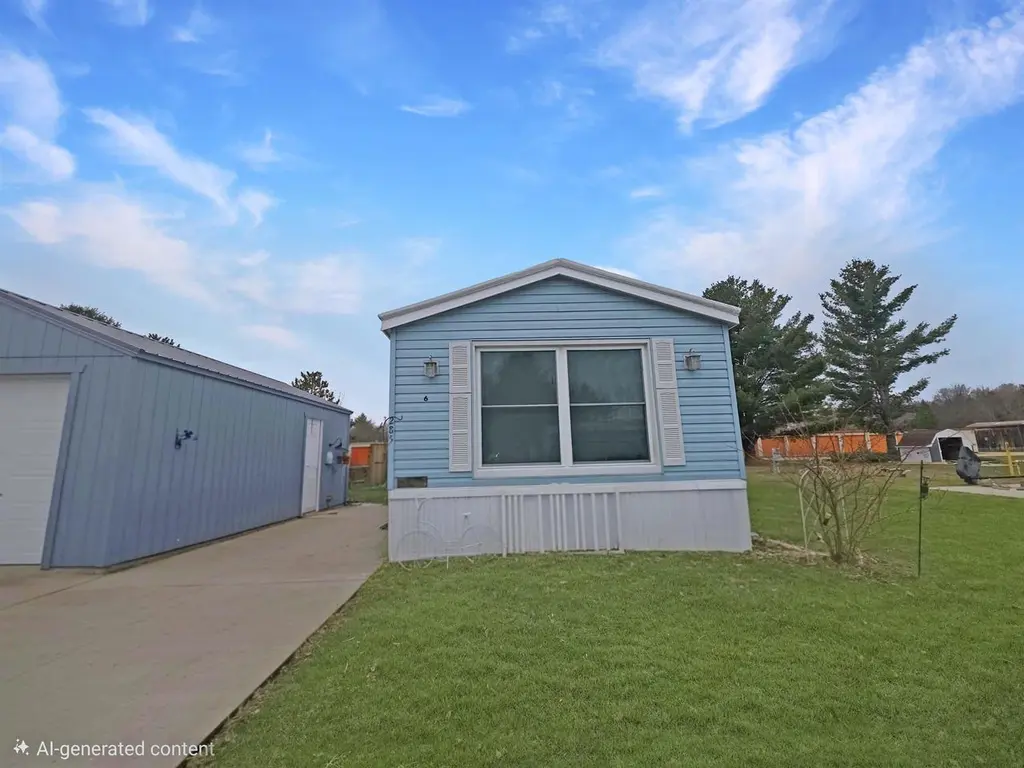
Welcome to this well-maintained single wide 3-bedroom, 2-bath manufactured home located in Edgewood Terrace West! This home offers a great combination of comfort, updates, and affordability with thoughtful improvements throughout. The spacious layout includes a primary suite with private bath, along with two additional bedrooms and a second full bath. Over the past four years, many major updates have been completed, including a newer roof, nearly all windows replaced, and updated skirting, which the seller notes has helped prevent any issues with frozen pipes. A 1-car garage, built within the last four years, adds valuable storage and convenience, along with an additional newer storage shed for all your outdoor needs. Enjoy relaxing on the deck overlooking established perennial gardens that bring color and charm throughout the seasons. Lot rent includes water and sewer, making for simplified monthly expenses.
Key facts
- Newer roof
- Updated skirting
- Newer storage shed
Tags
Neighborhood map
What this means for you Summary
Snapshot
- This is a 3-bed/2.0-bath single-family listed at $90k. Condition is rated good.
Deal economics
- At list price, monthly cash flow is $476 ($6k/yr) — positive.
- The deal already cash-flows at list — no discount required.
- Meets the 1% rule at list price ($1k rent vs $90k).
- Recommended offer: $85k (6.0% below list) — sets the bar for market timing.
- Cap rate 12.6% vs local median 3.6% in Tomah — top-decile yield for the area; either an underpriced asset or a hidden risk that comps aren't pricing in. Stress-test before assuming the spread holds.
Location & tenants
- Location reads 79/100 on livability (#83 in WI, #2,189 nationally) — a middle-class / working-renter tenant base. Strengths: cost of living A+, housing A+, health & safety A+; Watch: schools C-, crime C-, amenities F.
- Tomah Area School District (town): math 27% / reading 28% proficiency, ranked #293 of 342 in WI (top 86%) — low school quality limits family demand, transient renter base, plan for 1-2y turnover.
- Market conditions: 86 active listings in the ZIP; 8 comparable units currently listed for rent nearby; rentals at typical pace (median 14d on market — plan ~3-4 weeks tenant-placement turnaround); 93 units permitted in Monroe County in 2024 (0 in 5+ unit buildings).
Forward outlook
- Local home prices are declining (-3.0%/yr); year-one equity from $622 of loan paydown is wiped out by about $3k of value loss. Plan a longer hold.
- Monroe County population projected to shrink 9% by 2050 — rents likely to lag national; underwrite the cash flow, not the appreciation.
- At projected returns (-3.0% appreciation + 3.0% rent growth), your $25k cash investment doubles in ~6 years — after that, you're playing with house money.
Negotiation context
- It's been on market 69 days — a 6% lower offer ($85k) is reasonable based on typical stale-listing flexibility.
Questions for the listing agent
- It's been on market 69 days. Have you received any prior offers? Is the seller open to a 6% concession, seller financing, or rate buy-down credit?
- Why hasn't it sold? Are there any deal-killer items the seller is aware of (foundation, flood, title, zoning, code violations)?
- Is there a deadline driving the sale (1031 exchange, divorce, estate, relocation)? That informs how much negotiation room exists.
- What's the average days-on-market for RENTAL listings here right now (not sales)? A rising rental-DOM trend means longer vacancies and softer asking-rent achievability than the comps imply.
- What's the recent tenant-quality profile in this submarket — average credit score on applications, eviction rate, late-payment / NSF rate, and stable-employment percentage? A property-management company in the area should have these aggregated.
- How much new for-sale + rental construction is in the pipeline within 1–3 miles? Heavy new supply typically softens prices + rents 12–24 months out; constrained supply supports both.
Investment metrics
- 1% rule
- 1.54% ✓
- Cap rate
- 12.63%
- Cash-on-cash
- 22.65%
- DSCR
- 2.01
- GRM
- 5.4
CMA / ARV
- ARV (median comp)
- $209,849
- List price
- $90,000
- Delta
- -57.11%
- Verdict
- UNDERPRICED
- Comps
- 20 within 1.0 mi
Show comp detail 12 sales within ~0.75 mi
| Address | Dist | Beds/Ba | Sqft | Sold | Price | $/sf | Match |
|---|---|---|---|---|---|---|---|
| 304 Cady Ave | 0.56mi | 3/1.5 | 1,300 (+2%) | 2mo | $239,500 | $184 | 68 |
| 1415 Park View Dr | 0.31mi | 3/2.0 | 1,175 (-8%) | 5mo | $285,000 | $243 | 68 |
| 23650 Flame Ave | 0.24mi | 3/1.5 | 1,400 (+9%) | 20mo | $256,500 | $183 | 55 |
| 311 Cady Ave | 0.56mi | 3/2.0 | 1,268 (-1%) | 22mo | $214,000 | $169 | 54 |
| 1419 Dora St | 0.35mi | 3/1.5 | 1,452 (+13%) | 7mo | $256,000 | $176 | 54 |
| 307 Hollister Ave | 0.60mi | 3/1.5 | 1,300 (+2%) | 18mo | $178,000 | $137 | 52 |
| 607 W Jackson St | 0.52mi | 3/1.0 | 1,200 (-6%) | 18mo | $225,000 | $188 | 47 |
| 312 Clark St | 0.71mi | 3/2.0 | 1,400 (+9%) | 8mo | $172,000 | $123 | 45 |
| 417 W Nott St | 0.65mi | 4/1.5 (+1) | 1,250 (-2%) | 18mo | $200,000 | $160 | 44 |
| 301 N Superior Ave | 0.70mi | 2/1.0 (-1) | 1,130 (-12%) | 6mo | $145,000 | $128 | 34 |
| 308 Mclean Ave | 0.75mi | 4/1.5 (+1) | 1,460 (+14%) | 1mo | $230,000 | $158 | 34 |
| 415 W Jackson St | 0.60mi | 2/1.0 (-1) | 1,092 (-15%) | 19mo | $175,000 | $160 | 22 |
Match score weights: distance 35% · size 25% · config 20% · recency 20%. Top-matched comps best support the ARV.
Projected returns pro-forma
-3.0% appreciation · 3.0% rent growth · sell at horizon
- IRR
- 15.5%
- Equity multiple
- 1.62×
- Total profit
- $15,731
- Equity at exit
- $13,419
- IRR
- 24.2%
- Equity multiple
- 3.09×
- Total profit
- $52,793
- Equity at exit
- $7,782
Cash invested: $25,200 (down + closing). Projections, not guarantees.
Landlord ↔ Tenant lean methodology
- Overall (STATE)
- 73 Landlord-Friendly
- State Wisconsin
- 73 Landlord-Friendly · R+2
- County
- — inherits STATE
- City
- — inherits STATE
ZIP-level market 54660
- Home prices YoY
- -23.5%
- Active inventory
- 86
- Price-to-rent
- 5.4×
Monthly cashflow live
- Estimated rent
- $1,389 high interval (Pro) →
- Mortgage (P&I)
- −$472
- Tax est. 1.5%
- −$112 /mo · $1,350/yr
- Insurance
- −$38
- HOA
- −$0
- Vacancy / Maint / Mgmt
- −$292
- Net cashflow
- $476
Break-even live
UW: 25.0% down · 7.5% · 30yr · 1.5% tax · 5.0% vac · 8.0% maint · 8.0% mgmt
Financing live
Cash to close
- Down payment
- $22,500
- Closing costs
- $2,700
- Reserves months
- —
- Total cash needed
- —
Loan-product check · same deal, 3 products live
Conventional
25% down · 7.5% · 30yr
- Down + closing
- —
- Monthly P&I
- —
- Monthly cashflow
- —
- DSCR
- —
- Eligible?
- —
Personal DTI + credit; lowest rate.
DSCR
20% down · 8.5% · 30yr
- Down + closing
- —
- Monthly P&I
- —
- Monthly cashflow
- —
- DSCR
- —
- Eligible?
- —
No personal income docs; deal must DSCR.
Hard money
10% down · 12.0% · 12mo
- Down + closing
- —
- Monthly P&I
- —
- Monthly cashflow
- —
- DSCR
- —
- Eligible?
- —
Short-term bridge; refi at stabilization.
Rent comps 8 comps
| Address | Beds | Baths | Sqft | Rent | $/sqft | DOM | Units | Dist |
|---|---|---|---|---|---|---|---|---|
| 1010 Berry Ave Unit 1010 Berry Pointe-112 Tomah, WI | 2.0 | 1.5 | 1044 | $1,400 | $1.34 | 14d | 1 | 0.81mi |
| 1028 Berry Ave Tomah, WI | 2.0 | 1.5 | 1044 | $1,400 | $1.34 | 14d | 2 | 0.86mi |
| 202 Murdock St Tomah, WI | 2.0–3.0 | 1.0 | 1131 | $1,450 | $1.28 | 14d | 3 | 0.97mi |
| 220 Murdock St Tomah, WI | 2.0 | 1.0 | 1096 | $1,200 | $1.09 | 43d | 1 | 1.02mi |
| 260 Murdock St Tomah, WI | 3.0 | 1.0 | 1114 | $1,450 | $1.30 | 23d | 1 | 1.03mi |
| 205 E Veterans St Tomah, WI | 2.0 | 1.0 | 950 | $1,300 | $1.37 | 23d | 1 | 1.04mi |
| 209 E Veterans St Tomah, WI | 1.0–2.0 | 1.0 | 825 | $1,300 | $1.58 | 14d | 2 | 1.04mi |
| 834 Evergreen Pass Tomah, WI | 4.0 | 2.5 | 1418 | $1,729 | $1.22 | 14d | 1 | 1.14mi |
Listing history 16 events
-
2026-06-18days on market $90,000 Active 69 DOM
-
2026-06-17days on market $90,000 Active 68 DOM
-
2026-06-16days on market $90,000 Active 67 DOM
-
2026-06-15days on market $90,000 Active 66 DOM
-
2026-06-14days on market $90,000 Active 64 DOM
-
2026-06-10days on market $90,000 Active 61 DOM
-
2026-06-09days on market $90,000 Active 60 DOM
-
2026-06-08days on market $90,000 Active 59 DOM
-
2026-06-07days on market $90,000 Active 58 DOM
-
2026-06-05days on market $90,000 Active 55 DOM
-
2026-06-03days on market $90,000 Active 54 DOM
-
2026-06-02days on market $90,000 Active 53 DOM
-
2026-06-01days on market $90,000 Active 52 DOM
-
2026-05-31days on market $90,000 Active 51 DOM
-
2026-05-31days on market $90,000 Active 50 DOM
-
2026-04-09$90,000 Active 922-char remark
Show marketing remark (922 chars)
Welcome to this well-maintained single wide 3-bedroom, 2-bath manufactured home located in Edgewood Terrace West! This home offers a great combination of comfort, updates, and affordability with thoughtful improvements throughout. The spacious layout includes a primary suite with private bath, along with two additional bedrooms and a second full bath. Over the past four years, many major updates have been completed, including a newer roof, nearly all windows replaced, and updated skirting, which the seller notes has helped prevent any issues with frozen pipes. A 1-car garage, built within the last four years, adds valuable storage and convenience, along with an additional newer storage shed for all your outdoor needs. Enjoy relaxing on the deck overlooking established perennial gardens that bring color and charm throughout the seasons. Lot rent includes water and sewer, making for simplified monthly expenses.
ⓘ Source: listings_history table (triggers on properties + properties_extension) + one-shot
backfill from property_details.listing_events for pre-trigger history.
Nearby sold comps map
Loading sold comps map…
Walkable amenities ~0.75 mi
Loading nearby amenities…
Taxation est. · year 1
- Rental income
- $16,673
- − Mortgage interest
- −$5,041
- − Property taxes
- −$1,350
- − Insurance
- −$450
- − Repairs & maintenance
- −$1,334
- − Management
- −$1,334
- − Depreciation
- −$2,618
- Taxable income
- $4,545
- Est. tax owed @ 24.0%
- −$1,091
- After-tax cash flow
- $4,617/yr
For passive investors: Depreciation is non-cash, so a rental often shows a tax loss while cash-flowing — sheltering income. Rental losses are passive: they offset passive income freely, and up to $25,000/yr can offset ordinary (W-2) income if you actively participate and your MAGI is under $100k (phasing out to $0 by $150k); unused losses carry forward. On sale, claimed depreciation is recaptured at up to 25%, and gains may owe capital-gains tax (a 1031 exchange can defer both). Figures are a year-1 estimate at your 24.0% rate — not tax advice; consult a CPA.
Condition & rehab AI · 12 photos
This well-maintained single-wide manufactured home offers a good condition with recent updates, including a newer roof and windows. It's ready for a fresh coat of paint and updated fixtures to enhance its curb appeal and value.
Repairs flagged
- Minor ceiling fans — light wear
- Minor light fixtures — light wear
Value-add opportunities
- Resale paint interior walls — fresh paint enhances curb appeal
- Resale replace ceiling fans — modern fans improve aesthetics
- Resale update light fixtures — newer fixtures enhance curb appeal
- Both update flooring in kitchen — newer flooring improves both resale and rental value
- Both update countertops in kitchen — newer countertops improve both resale and rental value
Renovation cost estimate screening
| Repair item | Severity | Est. cost |
|---|---|---|
| ceiling fans · light wear | Minor | $500–3,000 |
| light fixtures · light wear | Minor | $500–3,000 |
| Total estimated repair cost · 2 items | $1,000–6,000 |
Value-add ROI direction
- Resale paint interior walls — fresh paint enhances curb appeal ↑
- Resale replace ceiling fans — modern fans improve aesthetics ↑
- Resale update light fixtures — newer fixtures enhance curb appeal ↑
- Both update flooring in kitchen — newer flooring improves both resale and rental value ↑
- Both update countertops in kitchen — newer countertops improve both resale and rental value ↑
ⓘ Cost ranges are severity-bucket heuristics (US national rule-of-thumb). Get contractor quotes + a written scope before underwriting a rehab budget.
Schools (NCES district)
- District
- Tomah Area School District
- NCES district ID
- 5514910
- Math proficiency
- 27% ▼ -4.00%
- Reading proficiency
- 28% ▼ -5.00%
- Median HH income
- $50,063
- Composite
- 24.14/100
- National rank
- #7747
- State rank
- #293 of 342 in WI
Livability — Tomah
- Score
- 79/100
- State rank
- #83
- US rank
- #2189
Category grades
Schools grade is shown separately in the Schools card above.
Census & demographics
- Census place
- Tomah, WI
- County
- Monroe County · 16,124 people
- City population
- 16,124
- Metro
- nan
- Population (ZIP)
- 16,124
- Household income
- $61,186
- Rent vs Own
- Severe rent burden
- 427.0
Population outlook (Monroe County) Hauer SSP2
- Today (2025)
- 45,682 people
- By 2030
- 45,187 · -1.1%
- By 2040
- 43,768 · -4.2%
- By 2050
- 41,596 · -8.9%
- By 2075
- 35,555 · -22.2%
- By 2100
- 28,278 · -38.1%
Race, ethnicity, and origin ACS 2023
- Neighborhood character
- Predominantly White (89%)
- Race & ethnicity
- White 89% Two or more races 5% Hispanic / Latino 4% Black 1% Native American 1%
- Common ancestry
- Portuguese 12% Romanian 3% Lithuanian 2%
- Foreign-born
- 2% · Canada
- Languages at home
- 96% English-only · German/W. Germanic 1% Spanish 1%
Political lean MEDSL · Monroe
- 2024 margin
- Strong R (+26.1) · D 36.3% · R 62.5% · Other 1.2%
- 2008→2024 swing
- -34.1pp toward R · 2008: 8.0pp · 2024: -26.1pp
- All cycles
- 2024: R+26.1 2020: R+23.6 2016: R+22.5 2012: R+0.7 2008: D+8.0
Not yet ingested
- Civics
- —
Market trends
- HPI YoY
- ▼ -64.36%
- Current HPI
- 209.1207
- Rent YoY
- —
- Metro
- nan
- State GDP YoY
- ▲ 2.10%
- F500 in state
- 20
Industry mix (Fortune 500 HQ in WI)
| Industry | F500 HQs | Revenue |
|---|---|---|
| Industrial Machinery | 4 | $23B |
|
||
| Industrial Technology | 2 | $36B |
|
||
| Insurance | 1 | $36B |
|
||
| Professional Services | 1 | $19B |
|
||
| Utilities | 1 | $9B |
|
||
| Consumer Goods | 1 | $3B |
|
||
Price history
1 event — show timeline
- 2026-04-09 Listed $90,000 SCWMLS
Cash-flow waterfall
monthlySold comps — $/sqft
last 12 mo · ≤1 miLoading sold comps…