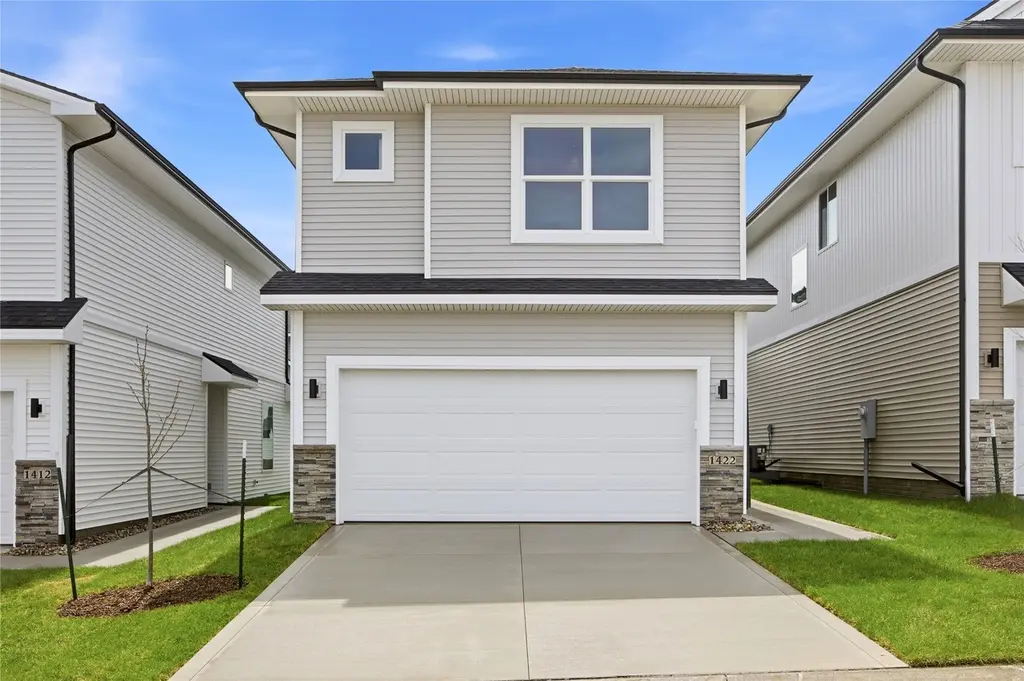
1422 NW 3rd Ln · Grimes, IA
Flood risk No data
- FEMA flood zone
- —
- Chance of flooding over 30 yrs
- —
- Est. flood insurance / yr
- —
Fire risk No data
- Est. fire insurance / yr
- —
Heat risk No data
- Hot days now (above threshold)
- —
- Hot days in 30 yrs
- —
Wind risk No data
- Chance of severe wind over 30 yrs
- —
Air-quality risk No data
- Unhealthy air days now
- —
- Unhealthy air days in 30 yrs
- —
Risk factors via First Street. Map © Google.
Why this score? — see what drove the D- grade
The composite is a weighted blend of 9 inputs, each scored 0–100. Each bar is that input's sub-score; the figure is the points it added to the 100-point composite (weight × sub-score).
- ARV discount +15.0/15.0
- Schools +7.0/10.0
- Cash flow +6.4/30.0
- Livability +4.0/5.0
- Rent growth +2.7/5.0
- Condition / age +2.5/5.0
- 1% rule +1.5/10.0
- DSCR +0.7/10.0
- Appreciation +0.0/10.0
$312,000
🖨 Deal sheet (PDF) 📄 Offer letter ✓ Due diligence
Listing remarks MLS
Destiny Homes presents its Cali plan in Grimes' Hope Timber Villas. The Cali plan features 4 bedrooms, 2.5 baths and just over 1,700 sq ft of living space. This two story home has everything a home should. The main level features beautiful open concept living, quartz countertops, center island and corner pantry. Upstairs, the primary ensuite includes a walk-in closet, 3 additional bedrooms, bathroom and laundry room. Hope Timber Villas is located just east of Dallas Center Grimes High School. Enjoy the comfort of a close-knit community while being just minutes from schools, shopping, dining, and everything Grimes has to offer. All Destiny Homes have a 2 year builder warranty. Striking the perfect balance between quality and efficiency, your path to homeownership starts right now! Ask about $2,000 in closing costs provided by the preferred lender. All information obtained from seller and public record.
Key facts
- Quartz countertops
- Open concept living
- Walk-in closet
Tags
Neighborhood map
What this means for you Summary
Snapshot
- This is a 4-bed/2.5-bath single-family listed at $312k.
Deal economics
- At list price, monthly cash flow is $-545 ($-7k/yr) — negative.
- To cash-flow at today's rent, offer at most $233k (25.3% below list).
- To meet the 1% rule (rent ≥ 1% of price), the offer needs to be $204k (34.6% below list).
- Recommended offer: $204k (34.6% below list) — sets the bar for 1% rule.
- Cap rate 4.2% vs local median 2.3% in Grimes — top-decile yield for the area; either an underpriced asset or a hidden risk that comps aren't pricing in. Stress-test before assuming the spread holds.
Location & tenants
- Location reads 79/100 on livability (#106 in IA, #2,080 nationally) — a middle-class / working-renter tenant base. Strengths: crime A+, employment A+, cost of living A+; Watch: amenities F, commute F.
- Dallas Center-Grimes Community School District (rural): math 78% / reading 82% proficiency, ranked #19 of 289 in IA (top 7%) — strong family-tenant draw, lease renewals of 3-5y typical; only 12% free/reduced lunch — higher-income household profile.
- Zoned schools: South Prairie Elementary (math 74% / reading 76%, grade A, #128 of 616 statewide, top 21%, 452 students, 24% FRL); Dallas Center-Grimes Middle School (math 79% / reading 81%, grade A+, #32 of 246 statewide, top 13%, 527 students, 19% FRL); Dallas Center-Grimes High School (math 73% / reading 82%, grade A-, #56 of 336 statewide, top 17%, 978 students, 18% FRL).
- Market conditions: Rents flat; 329 active listings in the ZIP; 5 comparable units currently listed for rent nearby; rentals at typical pace (median 16d on market — plan ~3-4 weeks tenant-placement turnaround); high-income renter base; 2,953 units permitted in Polk County in 2024 (540 in 5+ unit buildings).
Forward outlook
- Local home prices are declining (-3.0%/yr); year-one equity from $2k of loan paydown is wiped out by about $9k of value loss. Plan a longer hold.
- Polk County population projected at +37% by 2050 — long-run rental-demand tailwind backs the buy-and-hold thesis.
Negotiation context
- It's been on market 91 days — a 9% lower offer ($284k) is reasonable based on typical stale-listing flexibility.
Questions for the listing agent
- What do current leases actually rent for vs. the listed asking? Can we see a recent rent roll and the last 12 months of T-12 income?
- It's been on market 91 days. Have you received any prior offers? Is the seller open to a 35% concession, seller financing, or rate buy-down credit?
- Why hasn't it sold? Are there any deal-killer items the seller is aware of (foundation, flood, title, zoning, code violations)?
- Is there a deadline driving the sale (1031 exchange, divorce, estate, relocation)? That informs how much negotiation room exists.
- Schools are A-rated — typically a magnet for longer-tenancy family renters. What's the average tenant stay here, and is there a school-zone premium baked into asking?
- The area grade is low — what's the realistic commute time and amenity access for the typical tenant pool here? Any planned neighborhood developments (good or bad) we should know about?
- What's the average days-on-market for RENTAL listings here right now (not sales)? A rising rental-DOM trend means longer vacancies and softer asking-rent achievability than the comps imply.
- What's the recent tenant-quality profile in this submarket — average credit score on applications, eviction rate, late-payment / NSF rate, and stable-employment percentage? A property-management company in the area should have these aggregated.
- How much new for-sale + rental construction is in the pipeline within 1–3 miles? Heavy new supply typically softens prices + rents 12–24 months out; constrained supply supports both.
Investment metrics
- 1% rule
- 0.65% ✗
- Cap rate
- 4.20%
- Cash-on-cash
- -7.48%
- DSCR
- 0.67
- GRM
- 12.7
CMA / ARV
- ARV (median comp)
- $450,235
- List price
- $312,000
- Delta
- -30.70%
- Verdict
- UNDERPRICED
- Comps
- 20 within 1.0 mi
Show comp detail 12 sales within ~0.75 mi
| Address | Dist | Beds/Ba | Sqft | Sold | Price | $/sf | Match |
|---|---|---|---|---|---|---|---|
| 1004 NW 5th St | 0.30mi | 5/3.0 (+1) | 1,741 (+2%) | 1mo | $475,000 | $273 | 76 |
| 715 SW Cattail Rd | 0.57mi | 4/3.0 | 1,717 (+0%) | 2mo | $620,000 | $361 | 70 |
| 1023 SW Cattail Rd | 0.67mi | 4/2.5 | 1,699 (-1%) | 0mo | $527,900 | $311 | 67 |
| 280 NW Prairie Creek Dr | 0.48mi | 4/2.5 | 1,568 (-8%) | 2mo | $325,000 | $207 | 62 |
| 905 NW 3rd Ct | 0.33mi | 4/3.0 | 1,903 (+11%) | 3mo | $557,500 | $293 | 61 |
| 508 NW 8th St | 0.62mi | 4/3.0 | 1,864 (+9%) | 0mo | $399,900 | $215 | 54 |
| 1208 SW 4th St | 0.34mi | 3/3.0 (-1) | 1,478 (-14%) | 0mo | $305,000 | $206 | 54 |
| 975 SW Boulder Dr | 0.68mi | 4/3.0 | 1,579 (-8%) | 1mo | $509,900 | $323 | 52 |
| 873 SW Cattail Rd | 0.62mi | 5/3.0 (+1) | 1,610 (-6%) | 3mo | $549,900 | $342 | 52 |
| 847 SW Cattail Rd | 0.61mi | 5/3.0 (+1) | 1,586 (-8%) | 2mo | $555,000 | $350 | 50 |
| 781 SW Cattail Rd | 0.59mi | 4/3.0 | 1,492 (-13%) | 1mo | $556,000 | $373 | 48 |
| 726 SW Cattail Rd | 0.59mi | 3/2.0 (-1) | 1,463 (-15%) | 1mo | $405,000 | $277 | 40 |
Match score weights: distance 35% · size 25% · config 20% · recency 20%. Top-matched comps best support the ARV.
Projected returns pro-forma
-3.0% appreciation · 0.71% rent growth · sell at horizon
- IRR
- -31.9%
- Equity multiple
- -0.03×
- Total profit
- $-89,823
- Equity at exit
- $46,520
- IRR
- -51.7%
- Equity multiple
- -0.61×
- Total profit
- $-140,783
- Equity at exit
- $26,976
Cash invested: $87,360 (down + closing). Projections, not guarantees.
Landlord ↔ Tenant lean methodology
- Overall (STATE)
- 83 Strongly Landlord-Friendly
- State Iowa
- 83 Strongly Landlord-Friendly · R+6
- County
- — inherits STATE
- City
- — inherits STATE
ZIP-level market 50111
- Home prices YoY
- -11.1%
- Rents YoY
- 0.7%
- Active inventory
- 329
- Price-to-rent
- 12.7×
Monthly cashflow live
- Estimated rent
- $2,040 high interval (Pro) →
- Mortgage (P&I)
- −$1,636
- Tax est. 1.5%
- −$390 /mo · $4,680/yr
- Insurance
- −$130
- HOA
- −$0
- Vacancy / Maint / Mgmt
- −$428
- Net cashflow
- $-545
Break-even live
Sensitivity live
| Price | -10% $-329 | -5% $-437 | +0% $-545 | +5% $-653 | +10% $-760 |
|---|---|---|---|---|---|
| Rent | -10% $-706 | -5% $-625 | +0% $-545 | +5% $-464 | +10% $-384 |
| Rate | -1.0pp $-388 | -0.5pp $-465 | base $-545 | +0.5pp $-626 | +1.0pp $-708 |
UW: 25.0% down · 7.5% · 30yr · 1.5% tax · 5.0% vac · 8.0% maint · 8.0% mgmt
Financing live
Cash to close
- Down payment
- $78,000
- Closing costs
- $9,360
- Reserves months
- —
- Total cash needed
- —
Loan-product check · same deal, 3 products live
Conventional
25% down · 7.5% · 30yr
- Down + closing
- —
- Monthly P&I
- —
- Monthly cashflow
- —
- DSCR
- —
- Eligible?
- —
Personal DTI + credit; lowest rate.
DSCR
20% down · 8.5% · 30yr
- Down + closing
- —
- Monthly P&I
- —
- Monthly cashflow
- —
- DSCR
- —
- Eligible?
- —
No personal income docs; deal must DSCR.
Hard money
10% down · 12.0% · 12mo
- Down + closing
- —
- Monthly P&I
- —
- Monthly cashflow
- —
- DSCR
- —
- Eligible?
- —
Short-term bridge; refi at stabilization.
Rent comps 5 comps
| Address | Beds | Baths | Sqft | Rent | $/sqft | DOM | Units | Dist |
|---|---|---|---|---|---|---|---|---|
| 301 SE 4th St Grimes, IA | 3.0 | 2.5 | 1619 | $2,195 | $1.36 | 45d | 1 | 0.97mi |
| 305 SE 4th St Grimes, IA | 3.0 | 2.5 | 1651 | $2,090 | $1.27 | 16d | 1 | 0.97mi |
| 317 SE 4th St Grimes, IA | 3.0 | 2.5 | 1619 | $2,195 | $1.36 | 16d | 1 | 0.99mi |
| 301 SE 11th St #703 Grimes, IA | 3.0 | 2.5 | 1568 | $1,895 | $1.21 | 16d | 1 | 1.21mi |
| 1951 N James St Unit 107 Grimes, IA | 3.0 | 2.0 | 1150 | $1,295 | $1.13 | 16d | 1 | 1.27mi |
Listing history 18 events
-
2026-06-21days on market $312,000 Active 91 DOM
-
2026-06-18days on market $312,000 Active 88 DOM
-
2026-06-17days on market $312,000 Active 87 DOM
-
2026-06-16days on market $312,000 Active 86 DOM
-
2026-06-15days on market $312,000 Active 85 DOM
-
2026-06-14days on market $312,000 Active 83 DOM
-
2026-06-13days on market $312,000 Active 82 DOM
-
2026-06-10days on market $312,000 Active 80 DOM
-
2026-06-09days on market $312,000 Active 79 DOM
-
2026-06-08days on market $312,000 Active 78 DOM
-
2026-06-07days on market $312,000 Active 77 DOM
-
2026-06-05days on market $312,000 Active 74 DOM
-
2026-06-03days on market $312,000 Active 73 DOM
-
2026-06-02days on market $312,000 Active 72 DOM
-
2026-06-01days on market $312,000 Active 71 DOM
-
2026-05-31days on market $312,000 Active 70 DOM
-
2026-05-31days on market $312,000 Active 69 DOM
-
2026-03-22$312,000 Active 914-char remark
Show marketing remark (914 chars)
Destiny Homes presents its Cali plan in Grimes' Hope Timber Villas. The Cali plan features 4 bedrooms, 2.5 baths and just over 1,700 sq ft of living space. This two story home has everything a home should. The main level features beautiful open concept living, quartz countertops, center island and corner pantry. Upstairs, the primary ensuite includes a walk-in closet, 3 additional bedrooms, bathroom and laundry room. Hope Timber Villas is located just east of Dallas Center Grimes High School. Enjoy the comfort of a close-knit community while being just minutes from schools, shopping, dining, and everything Grimes has to offer. All Destiny Homes have a 2 year builder warranty. Striking the perfect balance between quality and efficiency, your path to homeownership starts right now! Ask about $2,000 in closing costs provided by the preferred lender. All information obtained from seller and public record.
ⓘ Source: listings_history table (triggers on properties + properties_extension) + one-shot
backfill from property_details.listing_events for pre-trigger history.
Nearby sold comps map
Loading sold comps map…
Walkable amenities ~0.75 mi
Loading nearby amenities…
Taxation est. · year 1
- Rental income
- $24,476
- − Mortgage interest
- −$17,477
- − Property taxes
- −$4,680
- − Insurance
- −$1,560
- − Repairs & maintenance
- −$1,958
- − Management
- −$1,958
- − Depreciation
- −$9,076
- Taxable loss
- −$12,234
- Est. tax savings @ 24.0%
- +$2,936
- After-tax cash flow
- $-3,602/yr
For passive investors: Depreciation is non-cash, so a rental often shows a tax loss while cash-flowing — sheltering income. Rental losses are passive: they offset passive income freely, and up to $25,000/yr can offset ordinary (W-2) income if you actively participate and your MAGI is under $100k (phasing out to $0 by $150k); unused losses carry forward. On sale, claimed depreciation is recaptured at up to 25%, and gains may owe capital-gains tax (a 1031 exchange can defer both). Figures are a year-1 estimate at your 24.0% rate — not tax advice; consult a CPA.
Schools (NCES district)
- District
- Dallas Center-Grimes Community School District
- NCES district ID
- 1908520
- Math proficiency
- 78% ▼ -7.00%
- Reading proficiency
- 82% ▼ -1.00%
- Median HH income
- $73,781
- Composite
- 69.92/100
- National rank
- #285
- State rank
- #19 of 289 in IA
Livability — Grimes
- Score
- 79/100
- State rank
- #106
- US rank
- #2080
Category grades
Schools grade is shown separately in the Schools card above.
Census & demographics
- County
- Polk County · 453,298 people
- City population
- 16,865
- Metro
- Des Moines-West Des Moines, IA
- Population (ZIP)
- 16,865
- Household income
- $120,769
- Rent vs Own
- Severe rent burden
- 249.0
Population outlook (Polk County) Hauer SSP2
- Today (2025)
- 548,042 people
- By 2030
- 588,557 · +7.4%
- By 2040
- 670,629 · +22.4%
- By 2050
- 752,830 · +37.4%
- By 2075
- 955,069 · +74.3%
- By 2100
- 1,115,436 · +103.5%
Race, ethnicity, and origin ACS 2023
- Neighborhood character
- Predominantly White (85%)
- Race & ethnicity
- White 85% Hispanic / Latino 6% Two or more races 5% Asian 3% Black 2%
- Hispanic origin (detail)
- Mexican 4%
- Common ancestry
- Portuguese 3% Italian 3% Iranian 2%
- Foreign-born
- 6% · China, Canada
- Languages at home
- 92% English-only · Other Asian/Pacific 3% Spanish 2% Other Indo-European 1%
Political lean MEDSL · Polk
- 2024 margin
- D (+10.9) · D 54.8% · R 43.9% · Other 1.3%
- 2008→2024 swing
- -3.7pp toward R · 2008: 14.6pp · 2024: 10.9pp
- All cycles
- 2024: D+10.9 2020: D+15.2 2016: D+11.5 2012: D+14.2 2008: D+14.6
Not yet ingested
- Civics
- —
Market trends
- HPI YoY
- ▼ -30.93%
- Current HPI
- 249.0614
- Rent YoY
- ▲ 0.71%
- Metro
- Des Moines-West Des Moines, IA
- State GDP YoY
- ▲ 2.48%
- F500 in state
- 4
Industry mix (Fortune 500 HQ in IA)
| Industry | F500 HQs | Revenue |
|---|---|---|
| Financial Services | 1 | $16B |
|
||
| Retail / Convenience | 1 | $15B |
|
||
Price history
1 event — show timeline
- 2026-03-22 Listed $312,000 Zillow
Cash-flow waterfall
monthlySold comps — $/sqft
last 12 mo · ≤1 miLoading sold comps…