1613 Brendle Dr · Bastrop, LA
Flood risk 1/10 · Minimal
- FEMA flood zone
- X
- Chance of flooding over 30 yrs
- 0.0%
- Est. flood insurance / yr
- $507 – $1,088
Fire risk 3/10 · Minor
- Est. fire insurance / yr
- $1,269 – $2,357
Heat risk 7/10 · Major
- Hot days now (above 111°F)
- 7 days/yr
- Hot days in 30 yrs
- 20 days/yr
Wind risk 6/10 · Moderate
- Chance of severe wind over 30 yrs
- 65.0%
Air-quality risk 1/10 · Minimal
- Unhealthy air days now
- 0 days/yr
- Unhealthy air days in 30 yrs
- 0 days/yr
Risk factors via First Street. Map © Google.
Why this score? — see what drove the D grade
The composite is a weighted blend of 9 inputs, each scored 0–100. Each bar is that input's sub-score; the figure is the points it added to the 100-point composite (weight × sub-score).
- Cash flow +17.1/30.0
- DSCR +5.3/10.0
- ARV discount +5.2/15.0
- Appreciation +3.9/10.0
- 1% rule +3.7/10.0
- Rent growth +2.5/5.0
- Livability +2.5/5.0
- Condition / age +2.5/5.0
- Schools +1.1/10.0
$125,000
🖨 Deal sheet (PDF) 📄 Offer letter ✓ Due diligence
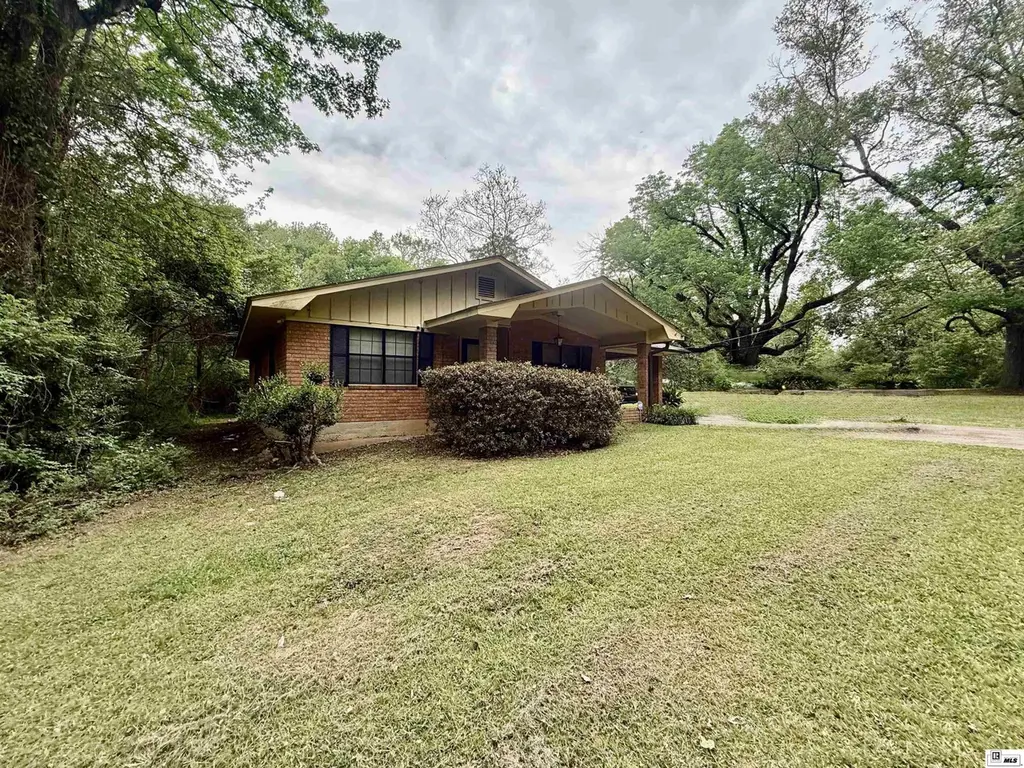
Listing remarks
Come see what hit the market right in the heart of Bastrop on a quiet dead end street! Nice 2 bad 1 bath and just over 1,500 sqft brick home on a nice lot! With nothing but woods and trees behind you and Woods across the street from you, makes this place nice and private tucked away! If you have pets, they’re gonna love to roam this property! Inside is a nice open floor plan with a large dining room area right off of the large kitchen! The kitchen is nice and spacious with tons of cabinet space and countertop space! With an open living room/kitchen and dining room concept this is a place where you are gonna wanna be together! On the back the house is 2 large bedrooms. This house w
Key facts
- Garage
- Listed 63 days
Property features AI
Finance
- HOA & community: No association amenities
Exterior
- Parking: 1-car garage
- Utilities: Public water; Public sewer
- Home design: Single-family residence; Site-built home; One-story home; Entry level: 1
- Construction: Brick and brick veneer exterior; Slab foundation
- Exterior features: No fencing; Irregular lot
Interior
- Bedrooms: 2 main-level bedrooms
- Bathrooms: 1 full bathroom
- Heating & cooling: Central heating; Central air conditioning
- Interior features: Blinds on windows; Electric water heater; Additional unspecified interior features
Neighborhood map
What this means for you Summary
Snapshot
- This is a 2-bed/2.0-bath single-family listed at $125k.
Deal economics
- At list price, monthly cash flow is $86 ($1k/yr) — positive.
- The deal already cash-flows at list — no discount required.
- To meet the 1% rule (rent ≥ 1% of price), the offer needs to be $109k (13.1% below list).
- Recommended offer: $109k (13.1% below list) — sets the bar for 1% rule.
Location & tenants
- Location reads 50/100 on livability (#425 in LA) — a working-class tenant base; expect higher turnover. Strengths: cost of living A+, housing A; Watch: health & safety D, crime F, amenities F.
- Morehouse Parish (town): math 10% / reading 19% proficiency, ranked #83 of 98 in LA (top 85%) — low school quality limits family demand, transient renter base, plan for 1-2y turnover; 78% free/reduced lunch — lower-income household profile, screen leases tightly.
- Zoned schools: Morehouse Elementary School (math 3% / reading 9%, grade F, #630 of 646 statewide, top 98%, 587 students, 6% FRL); Bastrop High School (math 3% / reading 7%, grade F, #260 of 265 statewide, top 100%, 902 students, 6% FRL) — zoned schools average 6% FRL vs 78% district-wide (72 pts lower); this property's tenant base skews higher-income than the district average.
- Market conditions: 92 active listings in the ZIP; 11 units permitted in Morehouse Parish in 2024 (0 in 5+ unit buildings).
Forward outlook
- Local home prices are declining (-2.1%/yr); year-one equity from $864 of loan paydown is wiped out by about $3k of value loss. Plan a longer hold.
- Morehouse County population projected at -29% by 2050 — secular population decline; favor cash flow + early exit over multi-decade hold.
Negotiation context
- It's been on market 63 days — a 6% lower offer ($118k) is reasonable based on typical stale-listing flexibility.
- 2 sale attempts with the ask held roughly flat each time — persistent listings suggest the price (not the market) is what's stuck; bring a comps-based counter.
- Current owner paid $40k; list at $125k implies a 212% gain — meaningful room to come down on a strong offer.
Risks & watch-outs
- Climate carrying-cost: major wind risk, 65% chance of damaging wind over 30y; extreme-heat days projected 7→20/yr by 2055 (HVAC capex compounding) — expect insurance premiums to compound above CPI over the hold.
Questions for the listing agent
- It's been on market 63 days. Have you received any prior offers? Is the seller open to a 13% concession, seller financing, or rate buy-down credit?
- Why hasn't it sold? Are there any deal-killer items the seller is aware of (foundation, flood, title, zoning, code violations)?
- Is there a deadline driving the sale (1031 exchange, divorce, estate, relocation)? That informs how much negotiation room exists.
- Schools are D-rated, which usually means shorter tenancies and higher turnover. Who's the typical renter profile here, and what's been the actual vacancy rate?
- Crime grade is F in this area — have there been break-ins, vandalism, or insurance claims at this property in the last 3 years? What carrier currently insures it and at what premium?
- The area grade is low — what's the realistic commute time and amenity access for the typical tenant pool here? Any planned neighborhood developments (good or bad) we should know about?
- What's the average days-on-market for RENTAL listings here right now (not sales)? A rising rental-DOM trend means longer vacancies and softer asking-rent achievability than the comps imply.
- What's the recent tenant-quality profile in this submarket — average credit score on applications, eviction rate, late-payment / NSF rate, and stable-employment percentage? A property-management company in the area should have these aggregated.
- How much new for-sale + rental construction is in the pipeline within 1–3 miles? Heavy new supply typically softens prices + rents 12–24 months out; constrained supply supports both.
Investment metrics
- 1% rule
- 0.87% ✗
- Cap rate
- 7.12%
- Cash-on-cash
- 2.95%
- DSCR
- 1.13
- GRM
- 9.6
CMA / ARV
- ARV (median comp)
- $119,024
- List price
- $125,000
- Delta
- 5.02%
- Verdict
- FAIR
- Comps
- 20 within 1.0 mi
Projected returns pro-forma
-2.1% appreciation · 3.0% rent growth · sell at horizon
- IRR
- -7.2%
- Equity multiple
- 0.71×
- Total profit
- $-10,079
- Equity at exit
- $23,683
- IRR
- 0.8%
- Equity multiple
- 1.07×
- Total profit
- $2,315
- Equity at exit
- $19,677
Cash invested: $35,000 (down + closing). Projections, not guarantees.
Landlord ↔ Tenant lean methodology
- Overall (STATE)
- 90 Strongly Landlord-Friendly
- State Louisiana
- 90 Strongly Landlord-Friendly · R+12
- County
- — inherits STATE
- City
- — inherits STATE
ZIP-level market 71220
- Home prices YoY
- -1.2%
- Active inventory
- 92
- Price-to-rent
- 9.6×
Monthly cashflow live
- Estimated rent
- $1,086 medium interval (Pro) →
- Mortgage (P&I)
- −$656
- Tax from tax record
- −$64 /mo · $772/yr
- Insurance
- −$52
- HOA
- −$0
- Vacancy / Maint / Mgmt
- −$228
- Net cashflow
- $86
Break-even live
Sensitivity live
| Price | -10% $157 | -5% $121 | +0% $86 | +5% $51 | +10% $15 |
|---|---|---|---|---|---|
| Rent | -10% $0 | -5% $43 | +0% $86 | +5% $129 | +10% $172 |
| Rate | -1.0pp $149 | -0.5pp $118 | base $86 | +0.5pp $54 | +1.0pp $21 |
UW: 25.0% down · 7.5% · 30yr · 1.5% tax · 5.0% vac · 8.0% maint · 8.0% mgmt
Financing live
Cash to close
- Down payment
- $31,250
- Closing costs
- $3,750
- Reserves months
- —
- Total cash needed
- —
Loan-product check · same deal, 3 products live
Conventional
25% down · 7.5% · 30yr
- Down + closing
- —
- Monthly P&I
- —
- Monthly cashflow
- —
- DSCR
- —
- Eligible?
- —
Personal DTI + credit; lowest rate.
DSCR
20% down · 8.5% · 30yr
- Down + closing
- —
- Monthly P&I
- —
- Monthly cashflow
- —
- DSCR
- —
- Eligible?
- —
No personal income docs; deal must DSCR.
Hard money
10% down · 12.0% · 12mo
- Down + closing
- —
- Monthly P&I
- —
- Monthly cashflow
- —
- DSCR
- —
- Eligible?
- —
Short-term bridge; refi at stabilization.
Listing history 22 events
-
2026-06-21days on market $125,000 Active 63 DOM
-
2026-06-19days on market $125,000 Active 61 DOM
-
2026-06-18days on market $125,000 Active 60 DOM
-
2026-06-17days on market $125,000 Active 59 DOM
-
2026-06-16days on market $125,000 Active 58 DOM
-
2026-06-15days on market $125,000 Active 57 DOM
-
2026-06-14days on market $125,000 Active 55 DOM
-
2026-06-13days on market $125,000 Active 54 DOM
-
2026-06-10days on market $125,000 Active 52 DOM
-
2026-06-09days on market $125,000 Active 51 DOM
-
2026-06-08days on market $125,000 Active 50 DOM
-
2026-06-07days on market $125,000 Active 49 DOM
-
2026-06-05days on market $125,000 Active 46 DOM
-
2026-06-03days on market $125,000 Active 45 DOM
-
2026-06-02days on market $125,000 Active 44 DOM
-
2026-06-01days on market $125,000 Active 43 DOM
-
2026-05-31days on market $125,000 Active 42 DOM
-
2026-05-30days on market $125,000 Active 41 DOM
-
2026-04-16$125,000 Active 856-char remark
-
2025-11-21price $125,000
-
2025-10-01$155,000 Active
-
2007-06-22soldstatus $40,000
ⓘ Source: listings_history table (triggers on properties + properties_extension) + one-shot
backfill from property_details.listing_events for pre-trigger history.
Tax reassessment forecast LA · Resets to sale price
- Current annual tax
- $772 · $64/mo
- Projected year-2 tax
- $772 · $64/mo
- Expected delta
- $0/yr ($0/mo · 0.0%)
ⓘ Screening estimate from a state-policy table — verify with the county assessor before closing.
Climate risk First Street
- Flood 1/10 Low FEMA zone X · 0% chance over 30 yrs
- Wildfire 3/10 Moderate
- Heat 7/10 Severe 7 d/yr ≥111°F today · 20 d/yr by 30 yrs out
- Wind 6/10 Major 65% chance of damaging wind over 30 yrs
- Air quality 1/10 Low 0 unhealthy d/yr today · 0 by 30 yrs out
Nearby sold comps map
Loading sold comps map…
Walkable amenities ~0.75 mi
Loading nearby amenities…
Taxation est. · year 1
- Rental income
- $13,031
- − Mortgage interest
- −$7,002
- − Property taxes
- −$772
- − Insurance
- −$625
- − Repairs & maintenance
- −$1,042
- − Management
- −$1,042
- − Depreciation
- −$3,636
- Taxable loss
- −$1,089
- Est. tax savings @ 24.0%
- +$261
- After-tax cash flow
- $1,293/yr
For passive investors: Depreciation is non-cash, so a rental often shows a tax loss while cash-flowing — sheltering income. Rental losses are passive: they offset passive income freely, and up to $25,000/yr can offset ordinary (W-2) income if you actively participate and your MAGI is under $100k (phasing out to $0 by $150k); unused losses carry forward. On sale, claimed depreciation is recaptured at up to 25%, and gains may owe capital-gains tax (a 1031 exchange can defer both). Figures are a year-1 estimate at your 24.0% rate — not tax advice; consult a CPA.
Schools (NCES district)
- District
- Morehouse Parish
- NCES district ID
- 2201110
- Math proficiency
- 10% ▼ -29.00%
- Reading proficiency
- 19% ▼ -29.00%
- Median HH income
- $30,482
- Composite
- 11.46/100
- National rank
- #9704
- State rank
- #83 of 98 in LA
Livability — Bastrop
- Score
- 50/100
- State rank
- #425
- US rank
- #25547
Category grades
Schools grade is shown separately in the Schools card above.
Census & demographics
- Census place
- Bastrop, LA
- Population (ZIP)
- 20,426
Population outlook (Morehouse County) Hauer SSP2
- Today (2025)
- 23,631 people
- By 2030
- 22,114 · -6.4%
- By 2040
- 19,203 · -18.7%
- By 2050
- 16,698 · -29.3%
- By 2075
- 11,998 · -49.2%
- By 2100
- 8,622 · -63.5%
Race, ethnicity, and origin ACS 2023
- Neighborhood character
- Majority Black (51%)
- Race & ethnicity
- Black 51% White 44% Two or more races 3% Hispanic / Latino 2%
- Common ancestry
- Lithuanian 2%
- Foreign-born
- 1% · China
Political lean MEDSL · Morehouse
- 2024 margin
- R (+19.4) · D 39.7% · R 59.0% · Other 1.3%
- 2008→2024 swing
- -8.3pp toward R · 2008: -11.1pp · 2024: -19.4pp
- All cycles
- 2024: R+19.4 2020: R+13.5 2016: R+11.4 2012: R+5.6 2008: R+11.1
Not yet ingested
- Civics
- —
Market trends
- HPI YoY
- ▼ -2.10%
- Current HPI
- 171.3272
- Rent YoY
- —
- Metro
- —
- State GDP YoY
- ▲ 3.29%
- F500 in state
- 10
Industry mix (Fortune 500 HQ in LA)
| Industry | F500 HQs | Revenue |
|---|---|---|
| Telecommunications | 2 | $23B |
|
||
| Utilities | 1 | $12B |
|
||
| Wholesale / Distribution | 1 | $5B |
|
||
| Advertising | 1 | $2B |
|
||
Price history
+212.5% since first listed4 events — show timeline
- 2026-04-16 Listed $125,000 NELABOR
- 2025-11-21 Price Changed $125,000 NELABOR
- 2025-10-01 Listed $155,000 NELABOR
- 2007-06-22 Sold (Public Records) $40,000 Public Records
Property tax history
+8.2%/yrLatest (2024): $772 · +4.2% YoY. Source: county tax records.
Cash-flow waterfall
monthlySold comps — $/sqft
last 12 mo · ≤1 miLoading sold comps…