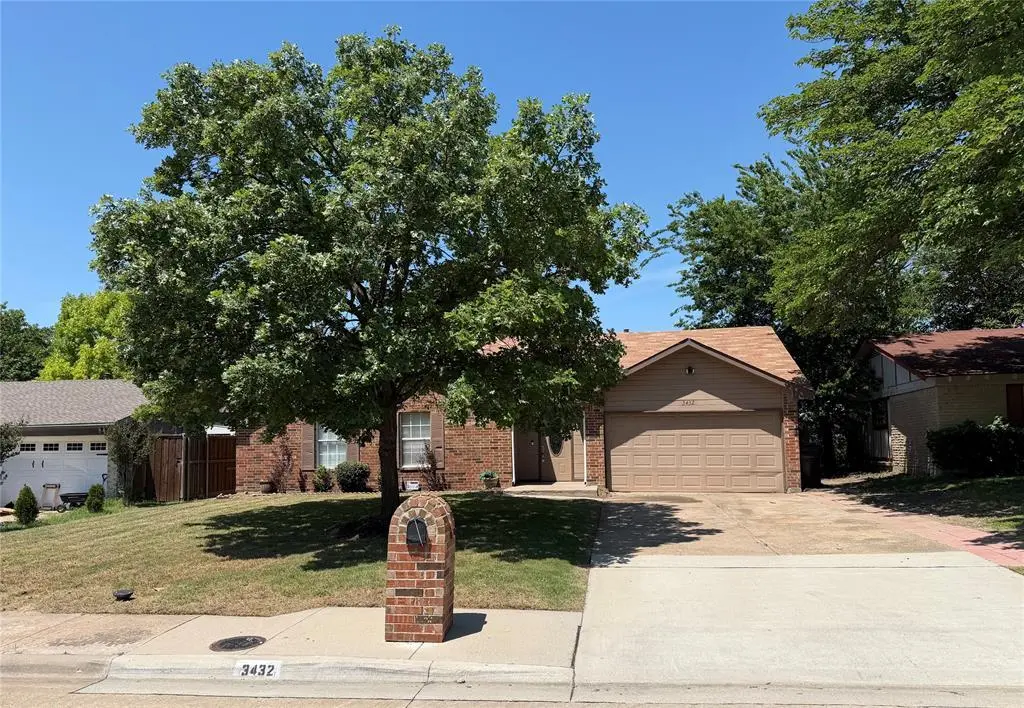
3432 Glenwood Ln · Plano, TX
Flood risk 1/10 · Minimal
- FEMA flood zone
- X (unshaded)
- Chance of flooding over 30 yrs
- 0.0%
- Est. flood insurance / yr
- $507 – $1,088
Fire risk 1/10 · Minimal
- Est. fire insurance / yr
- $1,222 – $2,270
Heat risk 7/10 · Major
- Hot days now (above 109°F)
- 7 days/yr
- Hot days in 30 yrs
- 23 days/yr
Wind risk 6/10 · Moderate
- Chance of severe wind over 30 yrs
- 27.0%
Air-quality risk 3/10 · Minor
- Unhealthy air days now
- 3 days/yr
- Unhealthy air days in 30 yrs
- 4 days/yr
Risk factors via First Street. Map © Google.
Why this score? — see what drove the D+ grade
The composite is a weighted blend of 9 inputs, each scored 0–100. Each bar is that input's sub-score; the figure is the points it added to the 100-point composite (weight × sub-score).
- ARV discount +15.0/15.0
- Cash flow +10.8/30.0
- Schools +4.9/10.0
- Livability +4.2/5.0
- 1% rule +3.5/10.0
- DSCR +3.1/10.0
- Condition / age +2.5/5.0
- Rent growth +1.5/5.0
- Appreciation +0.0/10.0
$239,000
🖨 Deal sheet (PDF) 📄 Offer letter ✓ Due diligence
Listing remarks
As is where is condition. Please call listing agent 2 Andre Tabacco for all inquiries.
Key facts
- 7,405 sq ft lot
- 2 garage spots
- Built 1970
Property features AI
Finance
- Other: Unknown encumbrance(s) reported; Will not subdivide
- Financial info: Listing terms: Cash; Financing contingency noted; Status: Active Contingent / Active Under Contract
- HOA & community: No association
Exterior
- Parking: Driveway; Attached garage facing front; 2-car garage; Carport spaces not provided; Covered spaces not provided
- Utilities: City water; City sewer; Individual gas meter; No municipal utility district
- Home design: Single-family residence; One-story; Residential property; Preowned (built in 1970)
- Construction: Brick exterior; Composition roof; Slab foundation; Year built 1970
- Exterior features: Patio; Few trees; Large backyard with grass; Interior lot; Subdivision setting
Interior
- Kitchen: Kitchen on main level; No appliances included
- Bedrooms: Primary bedroom on main level; Two additional bedrooms on main level (total 3 bedrooms)
- Flooring: Carpet; Ceramic tile
- Bathrooms: 2 full bathrooms
- Interior features: Open floorplan; Window coverings
- Laundry & utility: Laundry room on main level
Neighborhood map
What this means for you Summary
Snapshot
- This is a 3-bed/1.5-bath single-family listed at $239k.
Deal economics
- At list price, monthly cash flow is $-109 ($-1k/yr) — negative.
- To cash-flow at today's rent, offer at most $220k (8.1% below list).
- To meet the 1% rule (rent ≥ 1% of price), the offer needs to be $203k (15.1% below list).
- Recommended offer: $203k (15.1% below list) — sets the bar for 1% rule.
- Cap rate 5.7% vs local median 2.8% in Plano — top-decile yield for the area; either an underpriced asset or a hidden risk that comps aren't pricing in. Stress-test before assuming the spread holds.
Location & tenants
- Location reads 84/100 on livability (#8 in TX, #728 nationally) — a professional / high-income tenant draw. Strengths: commute A+, employment A+, housing A+; Watch: cost of living F.
- Plano ISD (urban): math 52% / reading 55% proficiency, ranked #90 of 826 in TX (top 11%) — acceptable for families but not a draw, mixed tenant base, ~2y average lease.
- Zoned schools: Barron El (math 27% / reading 22%, grade F, #3,052 of 4,322 statewide, top 74%, 343 students, 85% FRL); Bowman Middle (math 46% / reading 40%, grade D-, #540 of 1,662 statewide, top 33%, 868 students, 65% FRL); Plano East Sr H S (math 88% / reading 73%, grade A, #36 of 1,632 statewide, top 2%, 3,082 students, 32% FRL) — zoned schools average 61% FRL vs 25% district-wide (36 pts higher); higher-poverty schools than district average — tighter screening recommended.
- Market conditions: Rents falling (-3.9%/yr); 185 active listings in the ZIP; 38 comparable units currently listed for rent nearby; rentals leasing fast (median 13d on market — plan ~1-2 weeks tenant-placement turnaround); solid renter incomes; 19,194 units permitted in Collin County in 2024 (3,988 in 5+ unit buildings).
Forward outlook
- Local home prices are declining (-3.0%/yr); year-one equity from $2k of loan paydown is wiped out by about $7k of value loss. Plan a longer hold.
- Collin County population projected at +60% by 2050 — long-run rental-demand tailwind backs the buy-and-hold thesis.
Negotiation context
- It's been on market 19 days — a 2% lower offer ($235k) is reasonable based on typical stale-listing flexibility.
Risks & watch-outs
- Climate carrying-cost: major wind risk, 27% chance of damaging wind over 30y; extreme-heat days projected 7→23/yr by 2055 (HVAC capex compounding) — expect insurance premiums to compound above CPI over the hold.
Questions for the listing agent
- What do current leases actually rent for vs. the listed asking? Can we see a recent rent roll and the last 12 months of T-12 income?
- Built in 1970 — when were the roof, HVAC, electrical panel, plumbing, and water heater last replaced?
- Is there a deadline driving the sale (1031 exchange, divorce, estate, relocation)? That informs how much negotiation room exists.
- Schools are A-rated — typically a magnet for longer-tenancy family renters. What's the average tenant stay here, and is there a school-zone premium baked into asking?
- The area grade is low — what's the realistic commute time and amenity access for the typical tenant pool here? Any planned neighborhood developments (good or bad) we should know about?
- What's the average days-on-market for RENTAL listings here right now (not sales)? A rising rental-DOM trend means longer vacancies and softer asking-rent achievability than the comps imply.
- What's the recent tenant-quality profile in this submarket — average credit score on applications, eviction rate, late-payment / NSF rate, and stable-employment percentage? A property-management company in the area should have these aggregated.
- How much new for-sale + rental construction is in the pipeline within 1–3 miles? Heavy new supply typically softens prices + rents 12–24 months out; constrained supply supports both.
Investment metrics
- 1% rule
- 0.85% ✗
- Cap rate
- 5.75%
- Cash-on-cash
- -1.95%
- DSCR
- 0.91
- GRM
- 9.8
CMA / ARV
- ARV (median comp)
- $289,055
- List price
- $239,000
- Delta
- -17.32%
- Verdict
- UNDERPRICED
- Comps
- 20 within 1.0 mi
Show comp detail 12 sales within ~0.75 mi
| Address | Dist | Beds/Ba | Sqft | Sold | Price | $/sf | Match |
|---|---|---|---|---|---|---|---|
| 3425 Northwood Ln | 0.04mi | 3/2.0 | 1,163 (-3%) | 18mo | $300,000 | $258 | 76 |
| 3413 Chelsea Ln | 0.27mi | 3/2.0 | 1,280 (+7%) | 3mo | $295,000 | $230 | 72 |
| 3425 Tarkio Rd | 0.15mi | 3/2.0 | 1,318 (+10%) | 4mo | $292,000 | $222 | 71 |
| 1425 Lilac Ln | 0.43mi | 3/2.0 | 1,239 (+4%) | 10mo | $345,000 | $278 | 64 |
| 3356 Tarkio Rd | 0.24mi | 3/2.0 | 1,292 (+8%) | 15mo | $275,500 | $213 | 60 |
| 3104 P Ave | 0.50mi | 3/2.0 | 1,241 (+4%) | 12mo | $370,000 | $298 | 59 |
| 1513 Japonica Ln | 0.60mi | 3/2.0 | 1,174 (-2%) | 11mo | $339,900 | $290 | 58 |
| 1417 Francis Ln | 0.37mi | 3/1.5 | 1,316 (+10%) | 13mo | $245,000 | $186 | 55 |
| 1511 Laurel Ln | 0.66mi | 3/1.5 | 1,140 (-5%) | 8mo | $229,000 | $201 | 54 |
| 3345 Sherwood Dr | 0.44mi | 3/2.0 | 1,292 (+8%) | 12mo | $350,000 | $271 | 54 |
| 1717 Lucas Ter | 0.49mi | 4/2.5 (+1) | 1,316 (+10%) | 3mo | $329,900 | $251 | 49 |
| 1508 Jasmine Ln | 0.58mi | 3/2.0 | 1,294 (+8%) | 13mo | $320,000 | $247 | 47 |
Match score weights: distance 35% · size 25% · config 20% · recency 20%. Top-matched comps best support the ARV.
Projected returns pro-forma
-3.0% appreciation · 0.0% rent growth · sell at horizon
- IRR
- -23.0%
- Equity multiple
- 0.23×
- Total profit
- $-51,546
- Equity at exit
- $35,636
- IRR
- -28.8%
- Equity multiple
- -0.14×
- Total profit
- $-76,525
- Equity at exit
- $20,664
Cash invested: $66,920 (down + closing). Projections, not guarantees.
Landlord ↔ Tenant lean methodology
- Overall (STATE)
- 87 Strongly Landlord-Friendly
- State Texas
- 87 Strongly Landlord-Friendly · R+5
- County
- — inherits STATE
- City
- — inherits STATE
ZIP-level market 75074
- Rents YoY
- -3.9%
- Active inventory
- 185
- Price-to-rent
- 9.8×
Monthly cashflow live
- Estimated rent
- $2,029 high interval (Pro) →
- Mortgage (P&I)
- −$1,253
- Tax from tax record
- −$359 /mo · $4,306/yr
- Insurance
- −$100
- HOA
- −$0
- Vacancy / Maint / Mgmt
- −$426
- Net cashflow
- $-109
Break-even live
Sensitivity live
| Price | -10% $26 | -5% $-41 | +0% $-109 | +5% $-177 | +10% $-244 |
|---|---|---|---|---|---|
| Rent | -10% $-269 | -5% $-189 | +0% $-109 | +5% $-29 | +10% $51 |
| Rate | -1.0pp $11 | -0.5pp $-48 | base $-109 | +0.5pp $-171 | +1.0pp $-234 |
UW: 25.0% down · 7.5% · 30yr · 1.5% tax · 5.0% vac · 8.0% maint · 8.0% mgmt
Financing live
Cash to close
- Down payment
- $59,750
- Closing costs
- $7,170
- Reserves months
- —
- Total cash needed
- —
Loan-product check · same deal, 3 products live
Conventional
25% down · 7.5% · 30yr
- Down + closing
- —
- Monthly P&I
- —
- Monthly cashflow
- —
- DSCR
- —
- Eligible?
- —
Personal DTI + credit; lowest rate.
DSCR
20% down · 8.5% · 30yr
- Down + closing
- —
- Monthly P&I
- —
- Monthly cashflow
- —
- DSCR
- —
- Eligible?
- —
No personal income docs; deal must DSCR.
Hard money
10% down · 12.0% · 12mo
- Down + closing
- —
- Monthly P&I
- —
- Monthly cashflow
- —
- DSCR
- —
- Eligible?
- —
Short-term bridge; refi at stabilization.
Rent comps 38 comps
| Address | Beds | Baths | Sqft | Rent | $/sqft | DOM | Units | Dist |
|---|---|---|---|---|---|---|---|---|
| 3428 N Ave Plano, TX | 3.0 | 2.0 | 1424 | $2,200 | $1.54 | 45d | 1 | 0.04mi |
| 3124 Lucas Ter Plano, TX | 3.0 | 1.0 | 995 | $1,720 | $1.73 | 20d | 1 | 0.51mi |
| 1201 E Park Blvd Plano, TX | 1.0–2.0 | 1.0–2.0 | 701 | $1,529 | $2.18 | 5d | 12 | 0.58mi |
| 781 Chateau Ln Plano, TX | 3.0 | 2.5 | 1469 | $2,445 | $1.66 | 45d | 1 | 0.68mi |
| 1805 Japonica Ln Plano, TX | 3.0 | 2.0 | 1320 | $1,785 | $1.35 | 45d | 1 | 0.69mi |
| 1904 Jasmine Ln Unit 1056384P Plano, TX | 4.0 | 2.0 | 1323 | $5,364 | $4.05 | 0d | 1 | 0.71mi |
| 1621 E Park Blvd Plano, TX | 3.0 | 1.5 | 1473 | $1,995 | $1.35 | 6d | 1 | 0.80mi |
| 1621 E Park Blvd Plano, TX | 3.0 | 1.5 | 1473 | $2,095 | $1.42 | 12d | 1 | 0.80mi |
| 4045 Cavalry Dr Plano, TX | 3.0 | 2.0 | 1453 | $2,275 | $1.57 | 22d | 1 | 0.95mi |
| 2425 Premier Dr Unit 2482 Plano, TX | 2.0 | 2.0 | 908 | $1,218 | $1.34 | 0d | 1 | 0.97mi |
| 2425 Premier Dr Unit 2462 Plano, TX | 2.0 | 2.0 | 908 | $1,523 | $1.68 | 15d | 1 | 0.97mi |
| 1800 E Spring Creek Pkwy Plano, TX | 1.0–3.0 | 1.0–2.0 | 1001 | $2,015 | $2.01 | 0d | 39 | 1.02mi |
| 802 22nd St Plano, TX | 2.0 | 1.0 | 824 | $1,795 | $2.18 | 9d | 1 | 1.03mi |
| 805 20th St Plano, TX | 3.0 | 1.0 | 916 | $1,895 | $2.07 | 22d | 1 | 1.10mi |
| 3939 Branch Hollow Dr Plano, TX | 3.0 | 2.0 | 1458 | $2,500 | $1.71 | 22d | 1 | 1.11mi |
| 2517 Figtree Ln Plano, TX | 3.0 | 2.0 | 1430 | $2,150 | $1.50 | 45d | 1 | 1.11mi |
| 1811 Mimosa Ln Plano, TX | 3.0 | 2.0 | 1153 | $2,030 | $1.76 | 14d | 1 | 1.19mi |
| 2029 Willow Ln Plano, TX | 4.0 | 2.0 | 1380 | $2,676 | $1.94 | 1d | 1 | 1.25mi |
| 2500 E Park Blvd Unit P8 Plano, TX | 2.0 | 1.5 | 1221 | $1,750 | $1.43 | 26d | 1 | 1.28mi |
| 2301 Pebble Vale Dr Plano, TX | 3.0 | 1.0–2.0 | 893 | $1,890 | $2.12 | 0d | 35 | 1.29mi |
| 6248 Assembly Park Bolevard Plano, TX | 1.0–2.0 | 1.0–2.0 | 946 | $2,313 | $2.45 | 0d | 22 | 1.29mi |
| 2400 Jupiter Rd #2 Plano, TX | 2.0 | 1.5 | 1000 | $1,550 | $1.55 | 45d | 1 | 1.30mi |
| 2001 E Spring Creek Pkwy Plano, TX | 1.0–3.0 | 1.0–2.0 | 982 | $2,432 | $2.48 | 0d | 18 | 1.33mi |
| 1401 Cross Bend Rd Plano, TX | 3.0 | 2.0 | 1443 | $2,200 | $1.52 | 24d | 1 | 1.34mi |
| 913 17th St Plano, TX | 2.0 | 1.0 | 750 | $1,750 | $2.33 | 24d | 1 | 1.35mi |
| 6501 Excellence Way Plano, TX | 3.0 | 1.0–2.0 | 1084 | $2,520 | $2.32 | 1d | 39 | 1.36mi |
| 2904 Chancellor Dr Plano, TX | 3.0 | 2.0 | 1452 | $2,300 | $1.58 | 7d | 1 | 1.39mi |
| 6500 Excellence Way Princeton, TX | 2.0 | 1.0–2.0 | 871 | $1,905 | $2.19 | 0d | 29 | 1.40mi |
| 1413 Yellowstone Dr Plano, TX | 3.0 | 2.0 | 1440 | $2,050 | $1.42 | 45d | 1 | 1.42mi |
| 1001 W Park Blvd Plano, TX | 1.0–2.0 | 1.0–2.0 | 1195 | $1,607 | $1.34 | 0d | 5 | 1.42mi |
| 2305 Oklahoma Ave Plano, TX | 3.0 | 2.5 | 1423 | $2,750 | $1.93 | 45d | 1 | 1.46mi |
| 1727 R Ave Plano, TX | 2.0 | 1.0 | 900 | $1,999 | $2.22 | 9d | 1 | 1.46mi |
| 1725 R Ave Plano, TX | 2.0 | 1.0 | 900 | $1,999 | $2.22 | 9d | 1 | 1.47mi |
| 1045 15th Pl Unit 1102 Plano, TX | 2.0 | 2.0 | 969 | $1,344 | $1.39 | 0d | 1 | 1.47mi |
| 1045 15th Pl Unit 2121 Plano, TX | 2.0 | 2.0 | 969 | $1,385 | $1.43 | 0d | 1 | 1.47mi |
| 1045 15th Pl Unit 159 Plano, TX | 2.0 | 1.0 | 912 | $1,560 | $1.71 | 45d | 1 | 1.47mi |
| 6541 Federal Hall St Plano, TX | 2.0 | 2.5 | 1353 | $2,150 | $1.59 | 45d | 1 | 1.49mi |
| 659 E 16th St Unit 716 Plano, TX | 2.0 | 2.0 | 867 | $1,234 | $1.42 | 0d | 1 | 1.50mi |
Listing history 8 events
-
2026-06-04status $239,000 Pending 19 DOM
-
2026-06-03days on market $239,000 Active Contingent 19 DOM
-
2026-06-02days on market $239,000 Active Contingent 18 DOM
-
2026-06-01days on market $239,000 Active Contingent 17 DOM
-
2026-05-31days on market $239,000 Active Contingent 16 DOM
-
2026-05-18historical Active Contingent 86-char remark
-
2026-05-09$239,000 Active 86-char remark
-
1987-02-08soldstatus
ⓘ Source: listings_history table (triggers on properties + properties_extension) + one-shot
backfill from property_details.listing_events for pre-trigger history.
Tax reassessment forecast TX · Resets to sale price
- Current annual tax
- $4,306 · $359/mo
- Projected year-2 tax
- $4,374 · $364/mo
- Expected delta
- +$67/yr (+$6/mo · 1.6%)
ⓘ Screening estimate from a state-policy table — verify with the county assessor before closing.
Climate risk First Street
- Flood 1/10 Low FEMA zone X (unshaded) · 0% chance over 30 yrs
- Wildfire 1/10 Low
- Heat 7/10 Severe 7 d/yr ≥109°F today · 23 d/yr by 30 yrs out
- Wind 6/10 Major 27% chance of damaging wind over 30 yrs
- Air quality 3/10 Moderate 3 unhealthy d/yr today · 4 by 30 yrs out
Nearby sold comps map
Loading sold comps map…
Walkable amenities ~0.75 mi
Loading nearby amenities…
Taxation est. · year 1
- Rental income
- $24,347
- − Mortgage interest
- −$13,388
- − Property taxes
- −$4,306
- − Insurance
- −$1,195
- − Repairs & maintenance
- −$1,948
- − Management
- −$1,948
- − Depreciation
- −$6,953
- Taxable loss
- −$5,390
- Est. tax savings @ 24.0%
- +$1,294
- After-tax cash flow
- $-14/yr
For passive investors: Depreciation is non-cash, so a rental often shows a tax loss while cash-flowing — sheltering income. Rental losses are passive: they offset passive income freely, and up to $25,000/yr can offset ordinary (W-2) income if you actively participate and your MAGI is under $100k (phasing out to $0 by $150k); unused losses carry forward. On sale, claimed depreciation is recaptured at up to 25%, and gains may owe capital-gains tax (a 1031 exchange can defer both). Figures are a year-1 estimate at your 24.0% rate — not tax advice; consult a CPA.
Schools (NCES district)
- District
- Plano ISD
- NCES district ID
- 4835100
- Math proficiency
- 52% ▼ -13.00%
- Reading proficiency
- 55% ▼ -8.00%
- Median HH income
- $79,861
- Composite
- 48.54/100
- National rank
- #2115
- State rank
- #90 of 826 in TX
Livability — Plano
- Score
- 84/100
- State rank
- #8
- US rank
- #728
Category grades
Schools grade is shown separately in the Schools card above.
Census & demographics
- Census place
- Plano, TX
- County
- Collin County · 1,159,394 people
- City population
- 288,003
- Metro
- Dallas-Fort Worth-Arlington, TX
- Population (ZIP)
- 53,831
- Household income
- $88,697
- Rent vs Own
- Severe rent burden
- 1848.0
Population outlook (Collin County) Hauer SSP2
- Today (2025)
- 1,210,074 people
- By 2030
- 1,358,201 · +12.2%
- By 2040
- 1,654,061 · +36.7%
- By 2050
- 1,937,359 · +60.1%
- By 2075
- 2,567,039 · +112.1%
- By 2100
- 2,952,048 · +144.0%
Race, ethnicity, and origin ACS 2023
- Neighborhood character
- Highly diverse neighborhood (Simpson 0.71)
- Race & ethnicity
- White 36% Hispanic / Latino 36% Two or more races 18% Asian 13% Black 11% Native American 1%
- Hispanic origin (detail)
- Mexican 26%
- Common ancestry
- Lithuanian 1% Slovak 1% Serbian 1%
- Foreign-born
- 33% · Canada, China, Vietnam
- Languages at home
- 52% English-only · Spanish 31% Other Indo-European 7% Arabic 2%
Political lean MEDSL · Collin
- 2024 margin
- R (+11.1) · D 43.1% · R 54.3% · Other 2.6%
- 2008→2024 swing
- +14.4pp toward D · 2008: -25.6pp · 2024: -11.1pp
- All cycles
- 2024: R+11.1 2020: R+4.3 2016: R+17.0 2012: R+31.6 2008: R+25.6
Not yet ingested
- Civics
- —
Market trends
- HPI YoY
- ▼ -264.33%
- Current HPI
- 263.7885
- Rent YoY
- ▼ -3.90%
- Metro
- Dallas-Fort Worth-Arlington, TX
- State GDP YoY
- ▲ 3.95%
- F500 in state
- 110
Industry mix (Fortune 500 HQ in TX)
| Industry | F500 HQs | Revenue |
|---|---|---|
| Energy | 16 | $1,198B |
|
||
| Technology | 5 | $198B |
|
||
| Engineering / Construction | 4 | $72B |
|
||
| Energy Services | 3 | $60B |
|
||
| Utilities | 3 | $41B |
|
||
| Healthcare | 2 | $330B |
|
||
Price history
4 events — show timeline
- 2026-06-03 Pending — NTREIS
- 2026-05-18 Contingent — NTREIS
- 2026-05-09 Listed $239,000 NTREIS
- 1987-02-08 Sold (Public Records) — Public Records
Property tax history
+4.1%/yrLatest (2025): $4,306 · +11.1% YoY. Source: county tax records.
Cash-flow waterfall
monthlySold comps — $/sqft
last 12 mo · ≤1 miLoading sold comps…