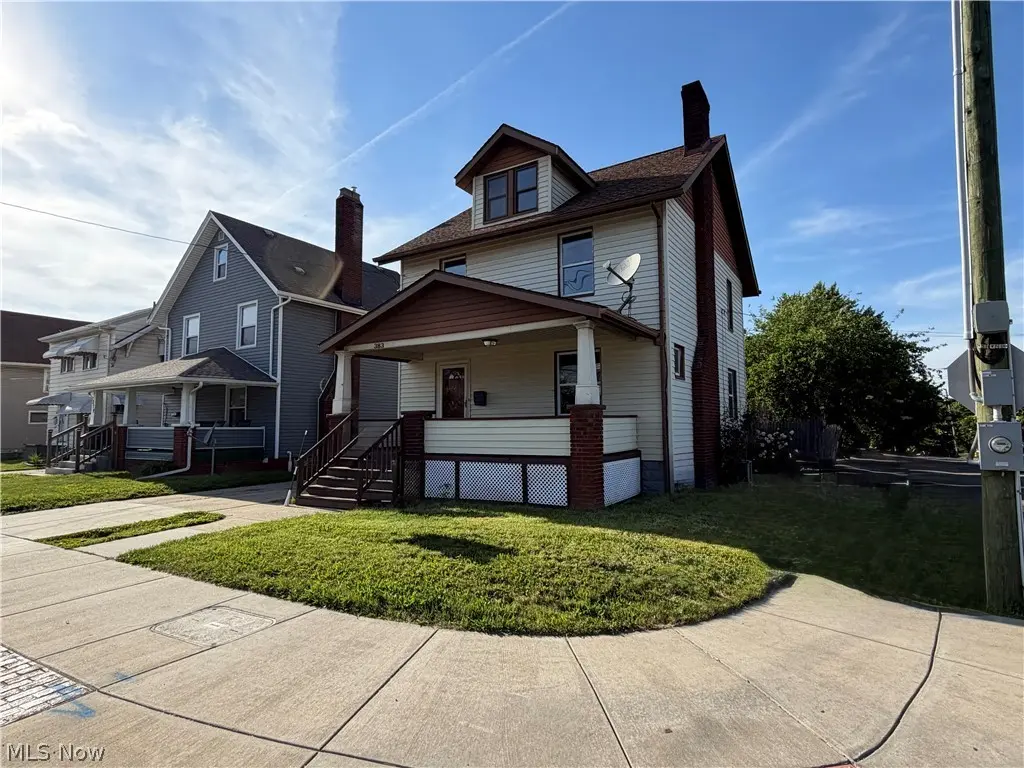
383 E Tallmadge Ave · Akron, OH
Flood risk 1/10 · Minimal
- FEMA flood zone
- X (unshaded)
- Chance of flooding over 30 yrs
- 0.0%
- Est. flood insurance / yr
- $473 – $860
Fire risk 1/10 · Minimal
- Est. fire insurance / yr
- $713 – $1,323
Heat risk 3/10 · Minor
- Hot days now (above 97°F)
- 7 days/yr
- Hot days in 30 yrs
- 16 days/yr
Wind risk 1/10 · Minimal
- Chance of severe wind over 30 yrs
- —
Air-quality risk 3/10 · Minor
- Unhealthy air days now
- 2 days/yr
- Unhealthy air days in 30 yrs
- 4 days/yr
Risk factors via First Street. Map © Google.
Why this score? — see what drove the D+ grade
The composite is a weighted blend of 9 inputs, each scored 0–100. Each bar is that input's sub-score; the figure is the points it added to the 100-point composite (weight × sub-score).
- Cash flow +15.1/30.0
- ARV discount +12.0/15.0
- 1% rule +4.6/10.0
- DSCR +4.6/10.0
- Livability +4.0/5.0
- Rent growth +3.7/5.0
- Condition / age +2.5/5.0
- Schools +2.1/10.0
- Appreciation +0.0/10.0
$129,900
🖨 Deal sheet (PDF) 📄 Offer letter ✓ Due diligence
Listing remarks MLS
Large 4 bedroom, 1 bath colonial on a corner lot is close to highways. Lovely natural woodwork throughout. Gas fireplace in the large living with stunning brickwork. Built in bookshelves in living room. To be sold AS IS. Buyer responsible for due diligence inquiry of all property information. Room sizes are approximate and not guaranteed. Condition of any appliances are not warranted. Closing agent of Buyers choice. FHA Financing subject to FHA Appraisal (IE - Insured Escrow)
Key facts
- Newer vinyl windows
- Newer hot water tank
- New kitchen cabinets
Tags
Property features AI
Exterior
- Parking: Detached garage with 1 garage space
- Utilities: Public water; Public sewer
- Home design: Above-grade finished area approximately 1,661
- Construction: Aluminum siding; Asphalt fiberglass roof
- Exterior features: Lot recorded at 0.0868 acres
Interior
- Bedrooms: Total of 7 rooms (includes bedrooms and living spaces)
- Bathrooms: One full bathroom
- Heating & cooling: Forced air heating; Gas heating
- Interior features: Full basement; One fireplace
Neighborhood map
What this means for you Summary
Snapshot
- This is a 4-bed/1.0-bath single-family listed at $130k.
Deal economics
- At list price, monthly cash flow is $43 ($518/yr) — positive.
- The deal already cash-flows at list — no discount required.
- To meet the 1% rule (rent ≥ 1% of price), the offer needs to be $124k (4.2% below list).
- Recommended offer: $124k (4.2% below list) — sets the bar for 1% rule.
Location & tenants
- Location reads 81/100 on livability (#104 in OH, #1,591 nationally) — a professional / high-income tenant draw. Strengths: amenities A+, commute A+, cost of living A+; Watch: crime F, employment F.
- Akron City (urban): math 22% / reading 30% proficiency, ranked #602 of 656 in OH (top 92%) — low school quality limits family demand, transient renter base, plan for 1-2y turnover; 66% free/reduced lunch — lower-income household profile, screen leases tightly.
- Zoned schools: Harris/Jackson Community Learning Center (math 17% / reading 28%, grade F, #1,239 of 1,584 statewide, top 78%, 628 students, 0% FRL); Jennings Community Learning Center (math 12% / reading 18%, grade F, #627 of 654 statewide, top 96%, 757 students, 0% FRL); North High School (math 2% / reading 15%, grade F, #755 of 781 statewide, top 97%, 916 students, 0% FRL) — zoned schools average 0% FRL vs 66% district-wide (66 pts lower); this property's tenant base skews higher-income than the district average.
- Market conditions: Rents rising fast (+4.8%/yr); 88 active listings in the ZIP; 13 comparable units currently listed for rent nearby; rentals lingering (median 46d on market — plan ~5-8 weeks vacancy on turnover, expect pricing pressure); 54% of comp listings sitting > 30 days — soft ceiling on asking rent; lower-income renter base — watch delinquency; 1,114 units permitted in Summit County in 2024 (397 in 5+ unit buildings).
- This rent runs 36% of the median local income ($41k/yr) — at the standard rent-burdened threshold; future hikes will face affordability resistance.
Forward outlook
- Local home prices are declining (-3.0%/yr); year-one equity from $898 of loan paydown is wiped out by about $4k of value loss. Plan a longer hold.
- Summit County population projected to shrink 6% by 2050 — rents likely to lag national; underwrite the cash flow, not the appreciation.
Negotiation context
- Only 7 days on market — expect competitive offers; lowballing is unlikely to land.
- 4 sale attempts since 20y ago with the ask held roughly flat each time — persistent listings suggest the price (not the market) is what's stuck; bring a comps-based counter.
- Current owner paid $25k; list at $130k implies a 420% gain — meaningful room to come down on a strong offer.
Risks & watch-outs
- Watch-outs: built in 1923 — expect roof / HVAC / electrical / plumbing capex.
Questions for the listing agent
- Built in 1923 — when were the roof, HVAC, electrical panel, plumbing, and water heater last replaced?
- Is there a deadline driving the sale (1031 exchange, divorce, estate, relocation)? That informs how much negotiation room exists.
- Crime grade is F in this area — have there been break-ins, vandalism, or insurance claims at this property in the last 3 years? What carrier currently insures it and at what premium?
- The area grade is low — what's the realistic commute time and amenity access for the typical tenant pool here? Any planned neighborhood developments (good or bad) we should know about?
- What's the average days-on-market for RENTAL listings here right now (not sales)? A rising rental-DOM trend means longer vacancies and softer asking-rent achievability than the comps imply.
- What's the recent tenant-quality profile in this submarket — average credit score on applications, eviction rate, late-payment / NSF rate, and stable-employment percentage? A property-management company in the area should have these aggregated.
- How much new for-sale + rental construction is in the pipeline within 1–3 miles? Heavy new supply typically softens prices + rents 12–24 months out; constrained supply supports both.
Investment metrics
- 1% rule
- 0.96% ✗
- Cap rate
- 6.69%
- Cash-on-cash
- 1.42%
- DSCR
- 1.06
- GRM
- 8.7
CMA / ARV
- ARV (on-the-fly)
- $144,507
- Comps found
- 12
Show comp detail 12 sales within ~0.75 mi
| Address | Dist | Beds/Ba | Sqft | Sold | Price | $/sf | Match |
|---|---|---|---|---|---|---|---|
| 482 E Tallmadge Ave | 0.19mi | 3/2.0 (-1) | 1,586 (-4%) | 4mo | $106,500 | $67 | 71 |
| 468 Delmar Ave | 0.33mi | 3/1.0 (-1) | 1,601 (-4%) | 5mo | $141,000 | $88 | 69 |
| 717 Columbia Ave | 0.24mi | 3/2.5 (-1) | 1,572 (-5%) | 1mo | $163,000 | $104 | 68 |
| 354 Julien Ave | 0.58mi | 4/1.5 | 1,680 (+1%) | 7mo | $75,000 | $45 | 63 |
| 307 E Glenwood Ave | 0.43mi | 4/2.0 | 1,528 (-8%) | 1mo | $65,000 | $43 | 62 |
| 508 E Tallmadge Ave | 0.24mi | 3/1.0 (-1) | 1,859 (+12%) | 3mo | $157,500 | $85 | 61 |
| 310 Ontario St | 0.25mi | 3/2.5 (-1) | 1,512 (-9%) | 5mo | $225,000 | $149 | 58 |
| 868 Iredell St | 0.49mi | 4/2.0 | 1,548 (-7%) | 6mo | $145,000 | $94 | 57 |
| 203 E York St | 0.38mi | 3/1.5 (-1) | 1,415 (-15%) | 6mo | $75,000 | $53 | 45 |
| 705 Damon St | 0.61mi | 3/2.0 (-1) | 1,486 (-10%) | 6mo | $175,000 | $118 | 40 |
| 748 Chalker St | 0.70mi | 5/2.0 (+1) | 1,829 (+10%) | 3mo | $160,000 | $87 | 39 |
| 958 Woodward Ave | 0.73mi | 3/1.5 (-1) | 1,439 (-13%) | 6mo | $115,000 | $80 | 32 |
Match score weights: distance 35% · size 25% · config 20% · recency 20%. Top-matched comps best support the ARV.
Projected returns pro-forma
-3.0% appreciation · 4.82% rent growth · sell at horizon
- IRR
- -11.9%
- Equity multiple
- 0.56×
- Total profit
- $-15,936
- Equity at exit
- $19,369
- IRR
- -0.1%
- Equity multiple
- 0.99×
- Total profit
- $-276
- Equity at exit
- $11,231
Cash invested: $36,372 (down + closing). Projections, not guarantees.
Landlord ↔ Tenant lean methodology
- Overall (STATE)
- 73 Landlord-Friendly
- State Ohio
- 73 Landlord-Friendly · R+6
- County
- — inherits STATE
- City
- — inherits STATE
ZIP-level market 44310
- Rents YoY
- 4.8%
- Active inventory
- 88
- Price-to-rent
- 8.7×
Monthly cashflow live
- Estimated rent
- $1,244 high interval (Pro) →
- Mortgage (P&I)
- −$681
- Tax from tax record
- −$204 /mo · $2,453/yr
- Insurance
- −$54
- HOA
- −$0
- Vacancy / Maint / Mgmt
- −$261
- Net cashflow
- $43
Break-even live
Sensitivity live
| Price | -10% $117 | -5% $80 | +0% $43 | +5% $6 | +10% $-30 |
|---|---|---|---|---|---|
| Rent | -10% $-55 | -5% $-6 | +0% $43 | +5% $92 | +10% $141 |
| Rate | -1.0pp $109 | -0.5pp $76 | base $43 | +0.5pp $10 | +1.0pp $-25 |
UW: 25.0% down · 7.5% · 30yr · 1.5% tax · 5.0% vac · 8.0% maint · 8.0% mgmt
Financing live
Cash to close
- Down payment
- $32,475
- Closing costs
- $3,897
- Reserves months
- —
- Total cash needed
- —
Loan-product check · same deal, 3 products live
Conventional
25% down · 7.5% · 30yr
- Down + closing
- —
- Monthly P&I
- —
- Monthly cashflow
- —
- DSCR
- —
- Eligible?
- —
Personal DTI + credit; lowest rate.
DSCR
20% down · 8.5% · 30yr
- Down + closing
- —
- Monthly P&I
- —
- Monthly cashflow
- —
- DSCR
- —
- Eligible?
- —
No personal income docs; deal must DSCR.
Hard money
10% down · 12.0% · 12mo
- Down + closing
- —
- Monthly P&I
- —
- Monthly cashflow
- —
- DSCR
- —
- Eligible?
- —
Short-term bridge; refi at stabilization.
Rent comps 13 comps
| Address | Beds | Baths | Sqft | Rent | $/sqft | DOM | Units | Dist |
|---|---|---|---|---|---|---|---|---|
| 649 Patterson Ave Unit B Akron, OH | 3.0 | 1.0 | 1200 | $900 | $0.75 | 45d | 1 | 0.10mi |
| 265 Cranz Pl Akron, OH | 4.0 | 1.0 | 1376 | $1,300 | $0.94 | 45d | 1 | 0.30mi |
| 559 Dayton St Akron, OH | 3.0 | 1.0 | 1200 | $1,200 | $1.00 | 45d | 1 | 0.34mi |
| 570 Dayton St Akron, OH | 3.0 | 1.0 | 1140 | $1,350 | $1.18 | 16d | 1 | 0.37mi |
| 15 W York St Akron, OH | 3.0 | 1.0 | 1178 | $1,150 | $0.98 | 23d | 1 | 0.80mi |
| 835 Carlysle St Akron, OH | 3.0 | 1.0 | 1152 | $1,250 | $1.09 | 45d | 1 | 0.98mi |
| 805 Carpenter St Akron, OH | 3.0 | 1.0 | 1056 | $1,100 | $1.04 | 25d | 1 | 1.01mi |
| 1180 Murray Ave Akron, OH | 3.0 | 2.0 | 1340 | $1,175 | $0.88 | 23d | 1 | 1.08mi |
| 248 Arch St Akron, OH | 3.0 | 1.0 | 1210 | $1,300 | $1.07 | 45d | 1 | 1.21mi |
| 240 Arch St Akron, OH | 3.0 | 1.0 | 1182 | $1,375 | $1.16 | 45d | 1 | 1.21mi |
| 1358 N Howard St Akron, OH | 4.0 | 2.0 | 2100 | $1,800 | $0.86 | 16d | 1 | 1.45mi |
| 1444 Hyde Park Ave Akron, OH | 3.0 | 1.0 | 1104 | $1,395 | $1.26 | 16d | 1 | 1.47mi |
| 208 Denver St Akron, OH | 3.0 | 1.0 | 1248 | $895 | $0.72 | 45d | 1 | 1.47mi |
Listing history 6 events
-
2026-06-13statusdays on market $129,900 Pending 7 DOM
-
2026-06-10days on market $129,900 Active 5 DOM
-
2026-06-09days on market $129,900 Active 4 DOM
-
2026-06-08days on market $129,900 Active 3 DOM
-
2026-06-07remarks 694-char remark
-
2026-06-07$129,900 Active 2 DOM
ⓘ Source: listings_history table (triggers on properties + properties_extension) + one-shot
backfill from property_details.listing_events for pre-trigger history.
Tax reassessment forecast OH · Partial reset (capped growth)
- Current annual tax
- $2,453 · $204/mo
- Projected year-2 tax
- $2,453 · $204/mo
- Expected delta
- $0/yr ($0/mo · 0.0%)
ⓘ Screening estimate from a state-policy table — verify with the county assessor before closing.
Climate risk First Street
- Flood 1/10 Low FEMA zone X (unshaded) · 0% chance over 30 yrs
- Wildfire 1/10 Low
- Heat 3/10 Moderate 7 d/yr ≥97°F today · 16 d/yr by 30 yrs out
- Wind 1/10 Low
- Air quality 3/10 Moderate 2 unhealthy d/yr today · 4 by 30 yrs out
Nearby sold comps map
Loading sold comps map…
Walkable amenities ~0.75 mi
Loading nearby amenities…
Taxation est. · year 1
- Rental income
- $14,930
- − Mortgage interest
- −$7,276
- − Property taxes
- −$2,453
- − Insurance
- −$650
- − Repairs & maintenance
- −$1,194
- − Management
- −$1,194
- − Depreciation
- −$3,779
- Taxable loss
- −$1,616
- Est. tax savings @ 24.0%
- +$388
- After-tax cash flow
- $906/yr
For passive investors: Depreciation is non-cash, so a rental often shows a tax loss while cash-flowing — sheltering income. Rental losses are passive: they offset passive income freely, and up to $25,000/yr can offset ordinary (W-2) income if you actively participate and your MAGI is under $100k (phasing out to $0 by $150k); unused losses carry forward. On sale, claimed depreciation is recaptured at up to 25%, and gains may owe capital-gains tax (a 1031 exchange can defer both). Figures are a year-1 estimate at your 24.0% rate — not tax advice; consult a CPA.
Schools (NCES district)
- District
- Akron City
- NCES district ID
- 3904348
- Math proficiency
- 22% ▼ -17.00%
- Reading proficiency
- 30% ▼ -12.00%
- Median HH income
- $33,811
- Composite
- 21.31/100
- National rank
- #8383
- State rank
- #602 of 656 in OH
Livability — Akron
- Score
- 81/100
- State rank
- #104
- US rank
- #1591
Category grades
Schools grade is shown separately in the Schools card above.
Census & demographics
- Census place
- Akron, OH
- County
- Summit County · 440,783 people
- City population
- 174,375
- Metro
- Akron, OH
- Population (ZIP)
- 25,496
- Household income
- $41,066
- Rent vs Own
- Severe rent burden
- 2058.0
Population outlook (Summit County) Hauer SSP2
- Today (2025)
- 546,583 people
- By 2030
- 544,028 · -0.5%
- By 2040
- 531,363 · -2.8%
- By 2050
- 514,923 · -5.8%
- By 2075
- 481,765 · -11.9%
- By 2100
- 432,265 · -20.9%
Race, ethnicity, and origin ACS 2023
- Neighborhood character
- Highly diverse neighborhood (Simpson 0.73)
- Race & ethnicity
- White 40% Black 25% Asian 20% Hispanic / Latino 10% Two or more races 9%
- Hispanic origin (detail)
- Mexican 6% Puerto Rican 2%
- Common ancestry
- Romanian 2% Slovak 1% Italian 1%
- Foreign-born
- 25% · Canada, India, Philippines
- Languages at home
- 69% English-only · Other Indo-European 13% Spanish 7% Other Asian/Pacific 6%
Political lean MEDSL · Summit
- 2024 margin
- Lean D (+7.0) · D 53.0% · R 46.0%
- 2008→2024 swing
- -9.6pp toward R · 2008: 16.6pp · 2024: 7.0pp
- All cycles
- 2024: D+7.0 2020: D+9.6 2016: D+8.2 2012: D+14.8 2008: D+16.6
Not yet ingested
- Civics
- —
Market trends
- HPI YoY
- ▼ -194.41%
- Current HPI
- 203.4431
- Rent YoY
- ▲ 4.82%
- Metro
- Akron, OH
- State GDP YoY
- ▲ 1.98%
- F500 in state
- 48
Industry mix (Fortune 500 HQ in OH)
| Industry | F500 HQs | Revenue |
|---|---|---|
| Insurance | 3 | $145B |
|
||
| Industrial Machinery | 3 | $49B |
|
||
| Financial Services | 3 | $24B |
|
||
| Consumer Goods | 2 | $93B |
|
||
| Aerospace / Defense | 2 | $47B |
|
||
| Utilities | 2 | $33B |
|
||
Price history
+62.6% since first listed12 events — show timeline
- 2026-06-05 Listed $129,900 MLSNOW
- 2017-05-31 Sold (MLS) $25,000 MLSNOW
- 2017-05-10 Pending — MLSNOW
- 2017-05-05 Contingent — MLSNOW
- 2017-04-27 Relisted — MLSNOW
- 2017-04-04 Pending — MLSNOW
- 2017-03-28 Contingent — MLSNOW
- 2017-03-15 Listed $25,000 MLSNOW
- 2006-09-29 Sold (Public Records) $79,000 Public Records
- 2006-09-29 Sold (MLS) $79,000 MLSNOW
- 2006-09-18 Listing Removed — MLSNOW
- 2006-05-18 Listed $79,900 MLSNOW
Property tax history
+3.7%/yrLatest (2025): $2,453 · +0.1% YoY. Source: county tax records.
Cash-flow waterfall
monthlySold comps — $/sqft
last 12 mo · ≤1 miLoading sold comps…