 Duplex
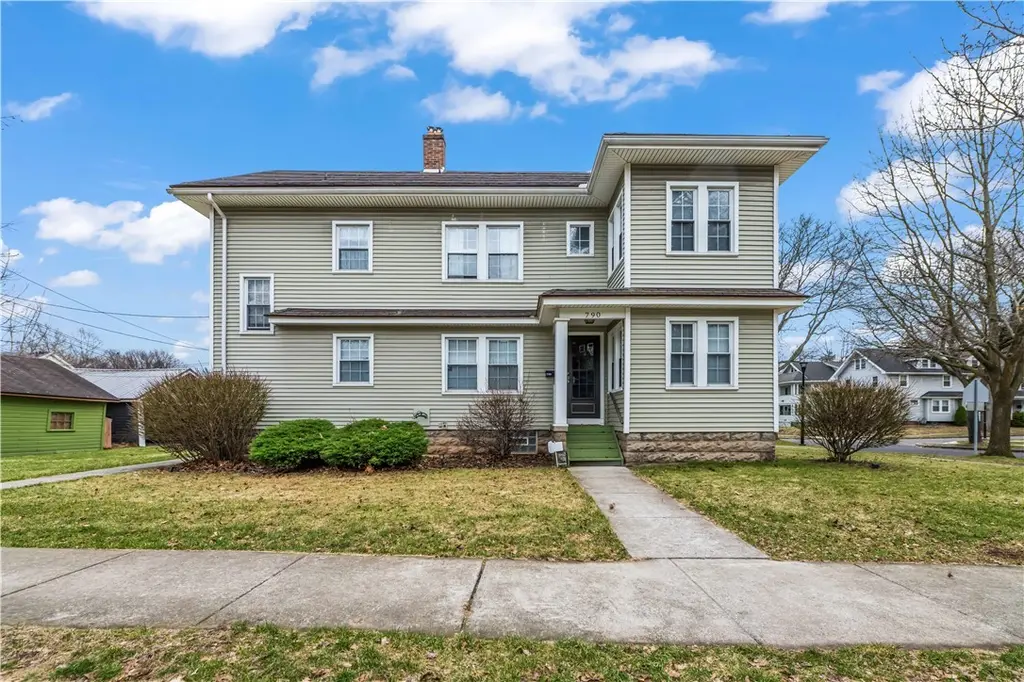
790 Thurston Rd · Rochester, NY
Flood risk 1/10 · Minimal
- FEMA flood zone
- X (unshaded)
- Chance of flooding over 30 yrs
- 0.0%
- Est. flood insurance / yr
- $473 – $860
Fire risk 3/10 · Minor
- Est. fire insurance / yr
- $691 – $1,283
Heat risk 2/10 · Minimal
- Hot days now (above 96°F)
- 7 days/yr
- Hot days in 30 yrs
- 15 days/yr
Wind risk 1/10 · Minimal
- Chance of severe wind over 30 yrs
- —
Air-quality risk 2/10 · Minimal
- Unhealthy air days now
- 1 days/yr
- Unhealthy air days in 30 yrs
- 1 days/yr
Risk factors via First Street. Map © Google.
Why this score? — see what drove the D+ grade
The composite is a weighted blend of 9 inputs, each scored 0–100. Each bar is that input's sub-score; the figure is the points it added to the 100-point composite (weight × sub-score).
- Cash flow +23.0/30.0
- DSCR +7.4/10.0
- 1% rule +6.0/10.0
- Livability +3.8/5.0
- Condition / age +3.8/5.0
- Rent growth +2.5/5.0
- Schools +1.9/10.0
- ARV discount +0.0/15.0
- Appreciation +0.0/10.0
$269,900
🖨 Deal sheet 📄 Offer letter ✓ Due diligence
Multi-family units
County records classify this as Multi-Family (2-4 Unit). Listing-text estimate: 2 units. confirmed
Listing remarks
Transparent Pricing!!!! - Meticulously maintained originally built upper/lower duplex located in the highly desirable 19th Ward! This fully renovated property is a true turn-key investment, offering many updates throughout. Each unit features a spacious 2 bedroom, 1 bath layout with separate utilities. Both units has been completely gutted and beautifully redone, and showcase stunning hardwood floors, updated kitchens with stainless steel appliances and quality KraftMaid cabinetry. Major improvements provide peace of mind, including all new vinyl windows, updated 200-amp electrical service for each unit, newer high-efficiency furnaces (the lower unit furnace is just 1 year old), and two cen
Key facts
- New vinyl windows
- Updated kitchens
- 5,880 sq ft lot
Tags
Neighborhood map
What this means for you Summary
Snapshot
- This is a 2 × 2-bed/1.0-bath units multifamily listed at $270k. Condition is rated good.
Deal economics
- At list price, monthly cash flow is $480 ($6k/yr) — positive. Per door: $240/mo.
- The deal already cash-flows at list — no discount required.
- Meets the 1% rule at list price ($3k rent vs $270k).
Location & tenants
- Location reads 76/100 on livability (#222 in NY, #3,482 nationally) — a middle-class / working-renter tenant base. Strengths: commute A+, cost of living A+, housing A+; Watch: schools D+, crime F, employment F.
- Rochester City School District (urban): math 21% / reading 26% proficiency, ranked #589 of 590 in NY (top 100%) — low school quality limits family demand, transient renter base, plan for 1-2y turnover; 82% free/reduced lunch — lower-income household profile, screen leases tightly.
- Market conditions: 48 active listings in the ZIP; 10 comparable units currently listed for rent nearby; rentals at typical pace (median 14d on market — plan ~3-4 weeks tenant-placement turnaround); 1,169 units permitted in Monroe County in 2024 (591 in 5+ unit buildings).
Forward outlook
- Local home prices are declining (-3.0%/yr); year-one equity from $2k of loan paydown is wiped out by about $8k of value loss. Plan a longer hold.
- Monroe County population projected to shrink 6% by 2050 — rents likely to lag national; underwrite the cash flow, not the appreciation.
Negotiation context
- Only 10 days on market — expect competitive offers; lowballing is unlikely to land.
Risks & watch-outs
- Watch-outs: built in 1925 — expect roof / HVAC / electrical / plumbing capex.
Questions for the listing agent
- Can we see the unit-by-unit rent roll, current vacancy, and any below-market leases? What's the average tenancy length?
- What capital expenditures (roof, boiler, parking lot, exteriors) have been made in the last 5 years, and what's planned in the next 2?
- Built in 1925 — when were the roof, HVAC, electrical panel, plumbing, and water heater last replaced?
- Is there a deadline driving the sale (1031 exchange, divorce, estate, relocation)? That informs how much negotiation room exists.
- Schools are D-rated, which usually means shorter tenancies and higher turnover. Who's the typical renter profile here, and what's been the actual vacancy rate?
- Crime grade is F in this area — have there been break-ins, vandalism, or insurance claims at this property in the last 3 years? What carrier currently insures it and at what premium?
- The area grade is low — what's the realistic commute time and amenity access for the typical tenant pool here? Any planned neighborhood developments (good or bad) we should know about?
- What's the average days-on-market for RENTAL listings here right now (not sales)? A rising rental-DOM trend means longer vacancies and softer asking-rent achievability than the comps imply.
- What's the recent tenant-quality profile in this submarket — average credit score on applications, eviction rate, late-payment / NSF rate, and stable-employment percentage? A property-management company in the area should have these aggregated.
- How much new apartment / multifamily construction is in the pipeline within 1–3 miles? Heavy new supply (>2% of stock underway) typically softens rents 12–24 months out; light construction supports rent growth.
Investment metrics
- 1% rule
- 1.10% ✓
- Cap rate
- 8.43%
- Cash-on-cash
- 7.63%
- DSCR
- 1.34
- GRM
- 7.6
CMA / ARV
- ARV (on-the-fly)
- $221,450
- Comps found
- 12
Show comp detail 12 sales within ~0.75 mi
| Address | Dist | Beds/Ba | Sqft | Sold | Price | $/sf | Match |
|---|---|---|---|---|---|---|---|
| 790 Thurston Rd | 0.00mi | 4/2.0 | 2,150 (0%) | 1mo | $290,000 | $135 | 99 |
| 178 Fairview Ave | 0.13mi | 4/2.0 | 2,016 (-6%) | 0mo | $240,000 | $119 | 83 |
| 741 Genesee Park Blvd | 0.30mi | 4/2.0 | 2,048 (-5%) | 7mo | $220,000 | $107 | 73 |
| 343 Genesee Park Blvd | 0.22mi | 4/2.0 | 2,208 (+3%) | 17mo | $240,000 | $109 | 71 |
| 185 Fairview Ave | 0.13mi | 4/2.0 | 2,312 (+8%) | 15mo | $200,000 | $87 | 69 |
| 3-5 Ravenwood Ave | 0.70mi | 4/2.0 | 2,152 (+0%) | 8mo | $210,000 | $98 | 60 |
| 151 Anthony St #153 | 0.54mi | 4/2.0 | 2,088 (-3%) | 21mo | $105,000 | $50 | 52 |
| 140 Weldon St | 0.44mi | 4/2.0 | 2,012 (-6%) | 21mo | $170,000 | $84 | 51 |
| 473 Sawyer St | 0.47mi | 4/2.0 | 2,378 (+11%) | 13mo | $245,000 | $103 | 50 |
| 30-32 Rosalind St | 0.31mi | 4/2.0 | 1,861 (-13%) | 17mo | $60,000 | $32 | 49 |
| 594 Thurston Rd | 0.28mi | 3/2.0 (-1) | 1,910 (-11%) | 20mo | $155,000 | $81 | 46 |
| 26 - 28 Mineola St | 0.56mi | 4/2.0 | 2,468 (+15%) | 12mo | $330,000 | $134 | 40 |
Match score weights: distance 35% · size 25% · config 20% · recency 20%. Top-matched comps best support the ARV.
Projected returns pro-forma
-3.0% appreciation · 3.0% rent growth · sell at horizon
- IRR
- -4.6%
- Equity multiple
- 0.83×
- Total profit
- $-13,101
- Equity at exit
- $40,243
- IRR
- 5.1%
- Equity multiple
- 1.37×
- Total profit
- $28,164
- Equity at exit
- $23,336
Cash invested: $75,572 (down + closing). Projections, not guarantees.
Landlord ↔ Tenant lean methodology
- Overall (STATE)
- 15 Strongly Tenant-Friendly
- State New York
- 15 Strongly Tenant-Friendly · D+10
- County
- — inherits STATE
- City
- — inherits STATE
ZIP-level market 14619
- Home prices YoY
- -10.0%
- Active inventory
- 48
- Price-to-rent
- 15.1×
Monthly cashflow live
- Estimated rent
- $2,969 high interval (Pro) →
- Mortgage (P&I)
- −$1,415
- Tax est. 1.5%
- −$337 /mo · $4,048/yr
- Insurance
- −$112
- HOA
- −$0
- Vacancy / Maint / Mgmt
- −$623
- Net cashflow
- $480
Break-even live
2-unit breakdown (identical units grouped — click to expand)
| Units | Beds | Baths | Est. rent |
|---|---|---|---|
| 2× units | 2 | 1 | $2,970 |
| #1 | 2 | 1 | $1,485 |
| #2 | 2 | 1 | $1,485 |
| Total (2 units) | $2,969 | ||
UW: 25.0% down · 7.5% · 30yr · 1.5% tax · 5.0% vac · 8.0% maint · 8.0% mgmt
Financing live
Cash to close
- Down payment
- $67,475
- Closing costs
- $8,097
- Reserves months
- —
- Total cash needed
- —
Loan-product check · same deal, 3 products live
Conventional
25% down · 7.5% · 30yr
- Down + closing
- —
- Monthly P&I
- —
- Monthly cashflow
- —
- DSCR
- —
- Eligible?
- —
Personal DTI + credit; lowest rate.
DSCR
20% down · 8.5% · 30yr
- Down + closing
- —
- Monthly P&I
- —
- Monthly cashflow
- —
- DSCR
- —
- Eligible?
- —
No personal income docs; deal must DSCR.
Hard money
10% down · 12.0% · 12mo
- Down + closing
- —
- Monthly P&I
- —
- Monthly cashflow
- —
- DSCR
- —
- Eligible?
- —
Short-term bridge; refi at stabilization.
Rent comps 10 comps
| Address | Beds | Baths | Sqft | Rent | $/sqft | DOM | Units | Dist |
|---|---|---|---|---|---|---|---|---|
| 102 Virginia Ave Rochester, NY | 4.0 | 1.5 | 1453 | $2,150 | $1.48 | 2d | 1 | 0.25mi |
| 793 Woodbine Ave Rochester, NY | 4.0 | 1.0 | 1700 | $2,200 | $1.29 | 2d | 1 | 0.30mi |
| 485 Sawyer St Unit 1 Rochester, NY | 3.0 | 1.0 | 1400 | $1,900 | $1.36 | 43d | 1 | 0.47mi |
| 485 Sawyer St Rochester, NY | 3.0 | 1.0 | 1400 | $1,900 | $1.36 | 2d | 1 | 0.47mi |
| 79 Evangeline St Rochester, NY | 3.0 | 2.0 | 1876 | $2,500 | $1.33 | 2d | 1 | 0.49mi |
| 1317 Genesee St Rochester, NY | 3.0 | 2.0 | 1720 | $2,550 | $1.48 | 2d | 1 | 0.60mi |
| 161 Fillmore St Rochester, NY | 4.0 | 2.0 | 1612 | $1,400 | $0.87 | 14d | 1 | 1.21mi |
| 48 Thorndale Ter Rochester, NY | 4.0 | 1.5 | 1700 | $1,400 | $0.82 | 14d | 1 | 1.40mi |
| 249 1/2 Columbia Ave #249 Rochester, NY | 3.0 | 1.0 | 1600 | $1,300 | $0.81 | 14d | 1 | 1.48mi |
| 175 Lattimore Rd Rochester, NY | 3.0 | 1.0 | 1480 | $2,265 | $1.53 | 14d | 1 | 1.49mi |
Listing history 2 events
-
2026-03-28status Pending
-
2026-03-18$269,900 Active
ⓘ Source: listings_history table (triggers on properties + properties_extension) + one-shot
backfill from property_details.listing_events for pre-trigger history.
Climate risk First Street
- Flood 1/10 Low FEMA zone X (unshaded) · 0% chance over 30 yrs
- Wildfire 3/10 Moderate
- Heat 2/10 Low 7 d/yr ≥96°F today · 15 d/yr by 30 yrs out
- Wind 1/10 Low
- Air quality 2/10 Low 1 unhealthy d/yr today · 1 by 30 yrs out
Nearby sold comps map
Loading sold comps map…
Walkable amenities ~0.75 mi
Loading nearby amenities…
Taxation est. · year 1
- Rental income
- $35,628
- − Mortgage interest
- −$15,119
- − Property taxes
- −$4,048
- − Insurance
- −$1,350
- − Repairs & maintenance
- −$2,850
- − Management
- −$2,850
- − Depreciation
- −$7,852
- Taxable income
- $1,559
- Est. tax owed @ 24.0%
- −$374
- After-tax cash flow
- $5,389/yr
For passive investors: Depreciation is non-cash, so a rental often shows a tax loss while cash-flowing — sheltering income. Rental losses are passive: they offset passive income freely, and up to $25,000/yr can offset ordinary (W-2) income if you actively participate and your MAGI is under $100k (phasing out to $0 by $150k); unused losses carry forward. On sale, claimed depreciation is recaptured at up to 25%, and gains may owe capital-gains tax (a 1031 exchange can defer both). Figures are a year-1 estimate at your 24.0% rate — not tax advice; consult a CPA.
Condition & rehab AI · 1 photo
This fully renovated and updated multi-family home in the 19th Ward is move-in ready with excellent curb appeal and high-quality finishes.
Value-add opportunities
- Both Landscaping improvements — Enhances curb appeal and property value.
- Both New flooring in bathrooms — Improves aesthetics and functionality.
- Both New kitchen appliances — Enhances functionality and appeal for potential buyers/renters.
Renovation cost estimate screening
Value-add ROI direction
- Both Landscaping improvements — Enhances curb appeal and property value. ↑
- Both New flooring in bathrooms — Improves aesthetics and functionality. ↑
- Both New kitchen appliances — Enhances functionality and appeal for potential buyers/renters. ↑
ⓘ Cost ranges are severity-bucket heuristics (US national rule-of-thumb). Get contractor quotes + a written scope before underwriting a rehab budget.
Schools (NCES district)
- District
- Rochester City School District
- NCES district ID
- 3624750
- Math proficiency
- 21% ▬ 0.00%
- Reading proficiency
- 26% ▲ 4.00%
- Median HH income
- $30,923
- Composite
- 18.98/100
- National rank
- #8850
- State rank
- #589 of 590 in NY
Livability — Rochester
- Score
- 76/100
- State rank
- #222
- US rank
- #3482
Category grades
Schools grade is shown separately in the Schools card above.
Census & demographics
- Census place
- Rochester, NY
- City population
- 432,803
- Population (ZIP)
- 14,223
Population outlook (Monroe County) Hauer SSP2
- Today (2025)
- 759,460 people
- By 2030
- 757,154 · -0.3%
- By 2040
- 740,644 · -2.5%
- By 2050
- 714,443 · -5.9%
- By 2075
- 645,883 · -15.0%
- By 2100
- 547,084 · -28.0%
Race, ethnicity, and origin ACS 2023
- Neighborhood character
- Predominantly Black (66%)
- Race & ethnicity
- Black 66% White 20% Two or more races 8% Hispanic / Latino 6% Asian 1%
- Hispanic origin (detail)
- Puerto Rican 5%
- Common ancestry
- Romanian 2% Swedish 1% Lithuanian 1%
- Foreign-born
- 8% · Canada
- Languages at home
- 92% English-only · Spanish 3% Arabic 1% French/Haitian/Cajun 1%
Political lean MEDSL · Monroe
- 2024 margin
- D (+19.1) · D 59.5% · R 40.5%
- 2008→2024 swing
- +1.4pp toward D · 2008: 17.7pp · 2024: 19.1pp
- All cycles
- 2024: D+19.1 2020: D+21.0 2016: D+14.1 2012: D+17.4 2008: D+17.7
Not yet ingested
- Civics
- —
Market trends
- HPI YoY
- ▼ -30.67%
- Current HPI
- 276.3851
- Rent YoY
- —
- Metro
- —
- State GDP YoY
- ▲ 2.60%
- F500 in state
- 92
Industry mix (Fortune 500 HQ in NY)
| Industry | F500 HQs | Revenue |
|---|---|---|
| Financial Services | 10 | $950B |
|
||
| Consumer Goods | 9 | $162B |
|
||
| Insurance | 4 | $225B |
|
||
| Telecommunications | 2 | $144B |
|
||
| Pharmaceuticals | 2 | $112B |
|
||
| Media / Entertainment | 2 | $69B |
|
||
Price history
2 events — show timeline
- 2026-03-28 Pending — UNYREIS
- 2026-03-18 Listed $269,900 UNYREIS
Cash-flow waterfall
monthlySold comps — $/sqft
last 12 mo · ≤1 miLoading sold comps…