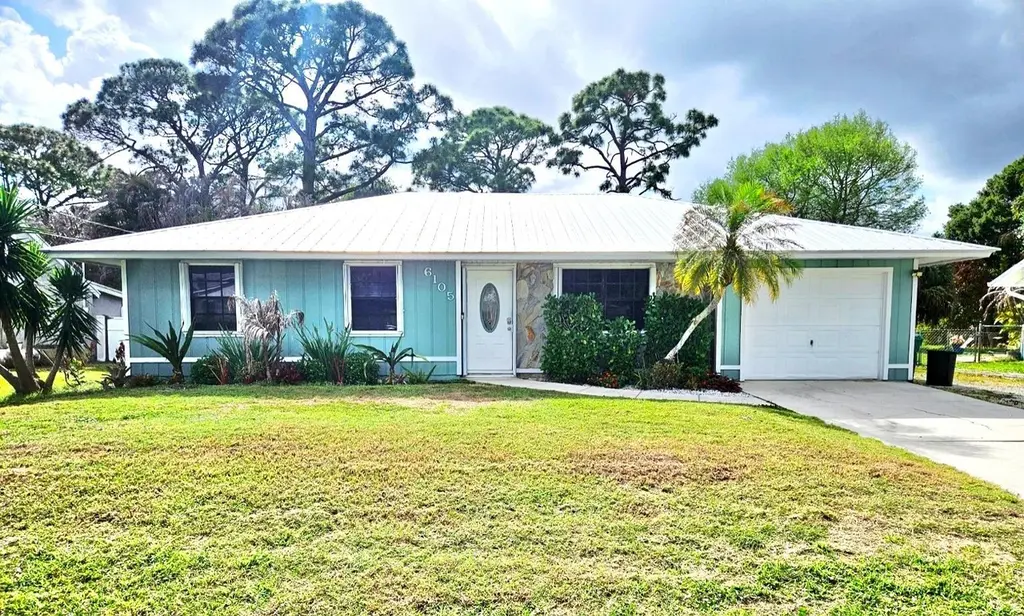
6105 Spruce Dr · Indian River Estates, FL
Flood risk 1/10 · Minimal
- FEMA flood zone
- X (unshaded)
- Chance of flooding over 30 yrs
- 0.0%
- Est. flood insurance / yr
- $507 – $1,088
Fire risk 3/10 · Minor
- Est. fire insurance / yr
- $947 – $1,759
Heat risk 10/10 · Severe
- Hot days now (above 106°F)
- 7 days/yr
- Hot days in 30 yrs
- 24 days/yr
Wind risk 10/10 · Severe
- Chance of severe wind over 30 yrs
- 99.0%
Air-quality risk 2/10 · Minimal
- Unhealthy air days now
- 1 days/yr
- Unhealthy air days in 30 yrs
- 1 days/yr
Risk factors via First Street. Map © Google.
Why this score? — see what drove the D grade
The composite is a weighted blend of 9 inputs, each scored 0–100. Each bar is that input's sub-score; the figure is the points it added to the 100-point composite (weight × sub-score).
- Cash flow +13.6/30.0
- ARV discount +6.8/15.0
- Rent growth +4.4/5.0
- DSCR +4.1/10.0
- Schools +3.7/10.0
- Livability +3.2/5.0
- 1% rule +2.6/10.0
- Condition / age +2.5/5.0
- Appreciation +0.0/10.0
$310,000
🖨 Deal sheet (PDF) 📄 Offer letter ✓ Due diligence
Listing remarks MLS
FRESHLY PAINTED, NEW CARPET, CEILING FANS, ALL APPLIANCES INCLUDED & GREAT HOME READY TO MOVE IN. MANY EXTRAS, SOME APPLIANCES WITH EXENTED WARRANTY.
Key facts
- New metal roof
- Walk-in shower
- 0.23 acre lot
Tags
Property features AI
Finance
- Other: Pets allowed (possible limits and restrictions)
Exterior
- Parking: Attached garage (1 car) with covered parking; Driveway; Aggregate and concrete surfaces; Boat access/parking; Total parking for 4 vehicles
- Utilities: Public water; Septic tank sewer; Electricity available; Cable available; Phone available
- Home design: Single-family residence; One story; Resale property; Faces east; Located east of US-1
- Construction: Stone veneer and stone accents; Wood siding and wood frame construction; Metal roof; Slab foundation; Built on a lot approximately 80 x 125
- Exterior features: Open patio and open porch; Patio and porch; Back yard fencing with chain link and gate; Room for a pool; Landscaped yard; Asphalt road frontage (publicly maintained)
Interior
- Kitchen: Dishwasher; Electric range / electric cooktop; Microwave; Refrigerator; Electric water heater (owned)
- Bedrooms: Three bedrooms on the main level
- Flooring: Tile; Wood
- Bathrooms: Two full bathrooms on the main level
- Heating & cooling: Central electric heating; Central electric air conditioning; Ceiling fans
- Interior features: Walk-in closets; Stacked bedroom layout
- Laundry & utility: Inside laundry room; Washer hookup; Electric dryer hookup
Neighborhood map
What this means for you Summary
Snapshot
- This is a 3-bed/2.0-bath single-family listed at $310k.
Deal economics
- At list price, monthly cash flow is $17 ($199/yr) — positive.
- The deal already cash-flows at list — no discount required.
- To meet the 1% rule (rent ≥ 1% of price), the offer needs to be $235k (24.2% below list).
- Recommended offer: $235k (24.2% below list) — sets the bar for 1% rule.
Location & tenants
- Location reads 65/100 on livability (#653 in FL) — a middle-class / working-renter tenant base. Strengths: cost of living A+, housing A+, crime B+; Watch: employment D+, amenities F, commute F.
- St. Lucie (urban): math 40% / reading 48% proficiency, ranked #51 of 73 in FL (top 70%) — families likely to look elsewhere, expect single-tenant / working-renter base with shorter leases.
- Zoned schools: Northport K-8 School (math 38% / reading 41%, grade F, #1,513 of 2,144 statewide, top 73%, 1,223 students, 76% FRL); Southern Oaks Middle School (math 39% / reading 43%, grade F, #353 of 571 statewide, top 63%, 894 students, 76% FRL); Port St. Lucie High School (math 21% / reading 43%, grade F, #415 of 667 statewide, top 63%, 1,748 students, 67% FRL).
- Market conditions: Rents rising fast (+7.4%/yr); 336 active listings in the ZIP; 3 comparable units currently listed for rent nearby; rentals at typical pace (median 26d on market — plan ~3-4 weeks tenant-placement turnaround); 4,868 units permitted in St. Lucie County in 2024 (268 in 5+ unit buildings).
- At $2,348/mo this rent would consume 52% of the median local household income ($54k/yr) (locally 1086% of renters already pay >50% of income on rent) — very limited rent-growth headroom before tenants either downsize or default.
Forward outlook
- Local home prices are declining (-3.0%/yr); year-one equity from $2k of loan paydown is wiped out by about $9k of value loss. Plan a longer hold.
- St. Lucie County population projected at +20% by 2050 — long-run rental-demand tailwind backs the buy-and-hold thesis.
Negotiation context
- It's been on market 20 days — a 2% lower offer ($305k) is reasonable based on typical stale-listing flexibility.
- 3 sale attempts since 27y ago with the ask held roughly flat each time — persistent listings suggest the price (not the market) is what's stuck; bring a comps-based counter.
- Current owner paid $68k; list at $310k implies a 356% gain — meaningful room to come down on a strong offer.
Risks & watch-outs
- Climate carrying-cost: severe wind risk, 99% chance of damaging wind over 30y; extreme-heat days projected 7→24/yr by 2055 (HVAC capex compounding) — expect insurance premiums to compound above CPI over the hold.
Questions for the listing agent
- Is there a deadline driving the sale (1031 exchange, divorce, estate, relocation)? That informs how much negotiation room exists.
- Schools are F-rated, which usually means shorter tenancies and higher turnover. Who's the typical renter profile here, and what's been the actual vacancy rate?
- The area grade is low — what's the realistic commute time and amenity access for the typical tenant pool here? Any planned neighborhood developments (good or bad) we should know about?
- What's the average days-on-market for RENTAL listings here right now (not sales)? A rising rental-DOM trend means longer vacancies and softer asking-rent achievability than the comps imply.
- What's the recent tenant-quality profile in this submarket — average credit score on applications, eviction rate, late-payment / NSF rate, and stable-employment percentage? A property-management company in the area should have these aggregated.
- How much new for-sale + rental construction is in the pipeline within 1–3 miles? Heavy new supply typically softens prices + rents 12–24 months out; constrained supply supports both.
Investment metrics
- 1% rule
- 0.76% ✗
- Cap rate
- 6.36%
- Cash-on-cash
- 0.23%
- DSCR
- 1.01
- GRM
- 11.0
CMA / ARV
- ARV (on-the-fly)
- $305,116
- Comps found
- 10
Show comp detail 10 sales within ~0.75 mi
| Address | Dist | Beds/Ba | Sqft | Sold | Price | $/sf | Match |
|---|---|---|---|---|---|---|---|
| 6115 Papaya Dr | 0.25mi | 3/2.0 | 1,242 (-3%) | 8mo | $340,000 | $274 | 76 |
| 6004 Bamboo Dr | 0.19mi | 3/2.0 | 1,275 (-0%) | 19mo | $299,900 | $235 | 74 |
| 5902 Yucca Dr | 0.42mi | 3/2.0 | 1,291 (+1%) | 13mo | $356,000 | $276 | 69 |
| 5717 Birch Dr | 0.50mi | 3/2.0 | 1,246 (-3%) | 8mo | $225,000 | $181 | 65 |
| 5909 Seagrape Dr | 0.51mi | 3/2.0 | 1,193 (-7%) | 2mo | $316,500 | $265 | 63 |
| 5707 Sunset Blvd | 0.51mi | 2/2.0 (-1) | 1,218 (-5%) | 8mo | $230,000 | $189 | 56 |
| 6103 Sunset Blvd | 0.18mi | 3/2.0 | 1,121 (-13%) | 18mo | $346,000 | $309 | 56 |
| 6103 Palm Dr | 0.36mi | 2/2.0 (-1) | 1,188 (-7%) | 20mo | $270,000 | $227 | 50 |
| 5802 Tangelo Dr | 0.37mi | 3/2.0 | 1,428 (+11%) | 23mo | $340,000 | $238 | 45 |
| 5607 Cassia Dr | 0.60mi | 2/1.0 (-1) | 1,104 (-14%) | 7mo | $125,000 | $113 | 34 |
Match score weights: distance 35% · size 25% · config 20% · recency 20%. Top-matched comps best support the ARV.
Projected returns pro-forma
-3.0% appreciation · 7.42% rent growth · sell at horizon
- IRR
- -11.8%
- Equity multiple
- 0.56×
- Total profit
- $-38,420
- Equity at exit
- $46,222
- IRR
- 2.3%
- Equity multiple
- 1.19×
- Total profit
- $16,334
- Equity at exit
- $26,803
Cash invested: $86,800 (down + closing). Projections, not guarantees.
Landlord ↔ Tenant lean methodology
- Overall (STATE)
- 87 Strongly Landlord-Friendly
- State Florida
- 87 Strongly Landlord-Friendly · R+3
- County
- — inherits STATE
- City
- — inherits STATE
ZIP-level market 34982
- Home prices YoY
- -33.4%
- Rents YoY
- 7.4%
- Active inventory
- 336
- Price-to-rent
- 11.0×
Monthly cashflow live
- Estimated rent
- $2,348 medium interval (Pro) →
- Mortgage (P&I)
- −$1,626
- Tax from tax record
- −$84 /mo · $1,005/yr
- Insurance
- −$129
- HOA
- −$0
- Vacancy / Maint / Mgmt
- −$493
- Net cashflow
- $17
Break-even live
Sensitivity live
| Price | -10% $192 | -5% $104 | +0% $17 | +5% $-71 | +10% $-159 |
|---|---|---|---|---|---|
| Rent | -10% $-169 | -5% $-76 | +0% $17 | +5% $109 | +10% $202 |
| Rate | -1.0pp $173 | -0.5pp $95 | base $17 | +0.5pp $-64 | +1.0pp $-145 |
UW: 25.0% down · 7.5% · 30yr · 1.5% tax · 5.0% vac · 8.0% maint · 8.0% mgmt
Financing live
Cash to close
- Down payment
- $77,500
- Closing costs
- $9,300
- Reserves months
- —
- Total cash needed
- —
Loan-product check · same deal, 3 products live
Conventional
25% down · 7.5% · 30yr
- Down + closing
- —
- Monthly P&I
- —
- Monthly cashflow
- —
- DSCR
- —
- Eligible?
- —
Personal DTI + credit; lowest rate.
DSCR
20% down · 8.5% · 30yr
- Down + closing
- —
- Monthly P&I
- —
- Monthly cashflow
- —
- DSCR
- —
- Eligible?
- —
No personal income docs; deal must DSCR.
Hard money
10% down · 12.0% · 12mo
- Down + closing
- —
- Monthly P&I
- —
- Monthly cashflow
- —
- DSCR
- —
- Eligible?
- —
Short-term bridge; refi at stabilization.
Rent comps 3 comps
| Address | Beds | Baths | Sqft | Rent | $/sqft | DOM | Units | Dist |
|---|---|---|---|---|---|---|---|---|
| 6113 Yucca Dr Fort Pierce, FL | 4.0 | 2.0 | 1638 | $2,450 | $1.50 | 25d | 1 | 0.33mi |
| 5315 Hickory Dr Fort Pierce, FL | 3.0 | 2.0 | 1400 | $2,045 | $1.46 | 25d | 1 | 0.92mi |
| 5300 Seagrape Dr Fort Pierce, FL | 3.0 | 2.0 | 1300 | $2,450 | $1.88 | 25d | 1 | 1.08mi |
Listing history 9 events
-
2026-05-10status Pending
-
2026-04-23status Active
-
2026-04-20status Pending
-
2026-04-13$310,000 Active
-
1999-12-22soldstatus $68,000 153-char remark
Show marketing remark (153 chars)
FRESHLY PAINTED, NEW CARPET, CEILING FANS, ALL APPLIANCES INCLUDED & GREAT HOME READY TO MOVE IN. MANY EXTRAS, SOME APPLIANCES WITH EXENTED WARRANTY.
-
1999-12-22soldstatus $68,000
Show marketing remark (153 chars)
FRESHLY PAINTED, NEW CARPET, CEILING FANS, ALL APPLIANCES INCLUDED & GREAT HOME READY TO MOVE IN. MANY EXTRAS, SOME APPLIANCES WITH EXENTED WARRANTY.
-
1999-11-06historical 153-char remark
Show marketing remark (153 chars)
FRESHLY PAINTED, NEW CARPET, CEILING FANS, ALL APPLIANCES INCLUDED & GREAT HOME READY TO MOVE IN. MANY EXTRAS, SOME APPLIANCES WITH EXENTED WARRANTY.
-
1999-03-01$69,000 153-char remark
Show marketing remark (153 chars)
FRESHLY PAINTED, NEW CARPET, CEILING FANS, ALL APPLIANCES INCLUDED & GREAT HOME READY TO MOVE IN. MANY EXTRAS, SOME APPLIANCES WITH EXENTED WARRANTY.
-
1988-04-01soldstatus $55,000
ⓘ Source: listings_history table (triggers on properties + properties_extension) + one-shot
backfill from property_details.listing_events for pre-trigger history.
Tax reassessment forecast FL · Resets to sale price
- Current annual tax
- $1,005 · $84/mo
- Projected year-2 tax
- $2,573 · $214/mo
- Expected delta
- +$1,568/yr (+$131/mo · 156.1%)
ⓘ Screening estimate from a state-policy table — verify with the county assessor before closing.
Climate risk First Street
- Flood 1/10 Low FEMA zone X (unshaded) · 0% chance over 30 yrs
- Wildfire 3/10 Moderate
- Heat 10/10 Extreme 7 d/yr ≥106°F today · 24 d/yr by 30 yrs out
- Wind 10/10 Extreme 99% chance of damaging wind over 30 yrs
- Air quality 2/10 Low 1 unhealthy d/yr today · 1 by 30 yrs out
Nearby sold comps map
Loading sold comps map…
Walkable amenities ~0.75 mi
Loading nearby amenities…
Taxation est. · year 1
- Rental income
- $28,180
- − Mortgage interest
- −$17,365
- − Property taxes
- −$1,005
- − Insurance
- −$1,550
- − Repairs & maintenance
- −$2,254
- − Management
- −$2,254
- − Depreciation
- −$9,018
- Taxable loss
- −$5,267
- Est. tax savings @ 24.0%
- +$1,264
- After-tax cash flow
- $1,463/yr
For passive investors: Depreciation is non-cash, so a rental often shows a tax loss while cash-flowing — sheltering income. Rental losses are passive: they offset passive income freely, and up to $25,000/yr can offset ordinary (W-2) income if you actively participate and your MAGI is under $100k (phasing out to $0 by $150k); unused losses carry forward. On sale, claimed depreciation is recaptured at up to 25%, and gains may owe capital-gains tax (a 1031 exchange can defer both). Figures are a year-1 estimate at your 24.0% rate — not tax advice; consult a CPA.
Schools (NCES district)
- District
- St. Lucie
- NCES district ID
- 1201770
- Math proficiency
- 40% ▼ -11.00%
- Reading proficiency
- 48% ▼ -4.00%
- Median HH income
- $44,737
- Composite
- 37.28/100
- National rank
- #4449
- State rank
- #51 of 73 in FL
Livability — Indian River Estates
- Score
- 65/100
- State rank
- #653
- US rank
- #12946
Category grades
Schools grade is shown separately in the Schools card above.
Census & demographics
- Census place
- Indian River Estates, FL
- County
- Saint Lucie County · 337,150 people
- City population
- 27,447
- Metro
- Port St. Lucie, FL
- Population (ZIP)
- 31,143
- Household income
- $54,082
- Rent vs Own
- Severe rent burden
- 1086.0
Population outlook (St. Lucie County) Hauer SSP2
- Today (2025)
- 338,016 people
- By 2030
- 355,687 · +5.2%
- By 2040
- 385,521 · +14.1%
- By 2050
- 406,106 · +20.1%
- By 2075
- 441,054 · +30.5%
- By 2100
- 436,885 · +29.2%
Race, ethnicity, and origin ACS 2023
- Neighborhood character
- Majority White (62%)
- Race & ethnicity
- White 62% Hispanic / Latino 22% Two or more races 12% Black 12%
- Hispanic origin (detail)
- Mexican 10% Puerto Rican 3% Cuban 3%
- Common ancestry
- Italian 7% Hispanic 2% Lithuanian 1%
- Foreign-born
- 12% · Canada
- Languages at home
- 80% English-only · Spanish 16% French/Haitian/Cajun 3%
Political lean MEDSL · St. Lucie
- 2024 margin
- Lean R (+9.1) · D 45.1% · R 54.2%
- 2008→2024 swing
- -21.2pp toward R · 2008: 12.1pp · 2024: -9.1pp
- All cycles
- 2024: R+9.1 2020: R+1.6 2016: R+2.5 2012: D+7.9 2008: D+12.1
Not yet ingested
- Civics
- —
Market trends
- HPI YoY
- ▼ -199.47%
- Current HPI
- 397.2649
- Rent YoY
- ▲ 7.42%
- Metro
- Port St. Lucie, FL
- State GDP YoY
- ▲ 3.28%
- F500 in state
- 36
Industry mix (Fortune 500 HQ in FL)
| Industry | F500 HQs | Revenue |
|---|---|---|
| Industrial Technology | 2 | $29B |
|
||
| Insurance | 2 | $17B |
|
||
| Retail | 1 | $60B |
|
||
| Technology Distribution | 1 | $58B |
|
||
| Homebuilding | 1 | $35B |
|
||
| Technology Manufacturing | 1 | $35B |
|
||
Price history
+463.6% since first listed9 events — show timeline
- 2026-05-10 Pending — Beaches MLS
- 2026-04-23 Relisted — Beaches MLS
- 2026-04-20 Pending — Beaches MLS
- 2026-04-13 Listed $310,000 Beaches MLS
- 1999-12-22 Sold (Public Records) $68,000 Public Records
- 1999-12-22 Sold (MLS) $68,000 Beaches MLS
- 1999-11-06 Listing Removed — Beaches MLS
- 1999-03-01 Listed $69,000 Beaches MLS
- 1988-04-01 Sold (Public Records) $55,000 Public Records
Property tax history
+3.4%/yrLatest (2025): $1,005 · +10.3% YoY. Source: county tax records.
Cash-flow waterfall
monthlySold comps — $/sqft
last 12 mo · ≤1 miLoading sold comps…