 🏗️ New Construction
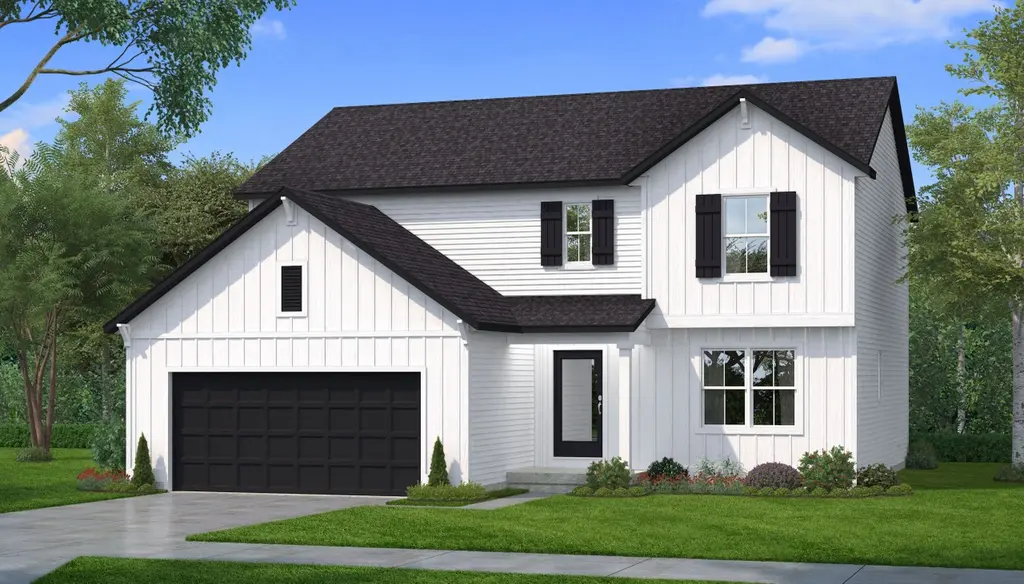
The Oakwood Plan · Georgetown, MI
Flood risk No data
- FEMA flood zone
- —
- Chance of flooding over 30 yrs
- —
- Est. flood insurance / yr
- —
Fire risk No data
- Est. fire insurance / yr
- —
Heat risk No data
- Hot days now (above threshold)
- —
- Hot days in 30 yrs
- —
Wind risk No data
- Chance of severe wind over 30 yrs
- —
Air-quality risk No data
- Unhealthy air days now
- —
- Unhealthy air days in 30 yrs
- —
Risk factors via First Street. Map © Google.
Why this score? — see what drove the F grade
The composite is a weighted blend of 9 inputs, each scored 0–100. Each bar is that input's sub-score; the figure is the points it added to the 100-point composite (weight × sub-score).
- Cash flow +7.8/30.0
- ARV discount +7.5/15.0
- Schools +5.5/10.0
- Condition / age +4.8/5.0
- Rent growth +2.5/5.0
- Livability +2.5/5.0
- 1% rule +2.4/10.0
- DSCR +1.9/10.0
- Appreciation +0.0/10.0
$423,100
🖨 Deal sheet 📄 Offer letter ✓ Due diligence
Listing remarks MLS
e ultimate family home might just be the Oakwood. As you pass through the Oakwood's entrance, you're greeted immediately by a cozy main floor den, then the spacious gathering area-a versatile space that's as comfortable supporting an afternoon nap, as it is entertaining several guests. If you enter through the garage, your family gets a generous "landing zone" for shoes, boots, backpacks, and the like. A fully equipped kitchen, dining area, half bath and deck complete the main floor. Upstairs you'll find 4 bedrooms, including an owner's suite with a walk-in closet. Now, back down two stair flights, to the lower level where a potential 5th bedroom, full bath, and rec room are just waiting to be built in, should you decide to go ahead with those options. All this, and priced at less than you'd expect to pay for such an all-around fantastic family home!
Key facts
- 2 garage spots
- Listed 379 days
Neighborhood map
What this means for you Summary
Snapshot
- This is a 4-bed/2.5-bath single-family listed at $423k. Condition is rated excellent.
Deal economics
- At list price, monthly cash flow is $-644 ($-8k/yr) — negative.
- The deal already cash-flows at list — no discount required.
- Meets the 1% rule at list price ($4k rent vs $423k).
- Recommended offer: $372k (12.0% below list) — sets the bar for market timing.
Location & tenants
- Location reads: area grade F — affects rentability + tenant quality, not the cash-flow math above.
- Hudsonville Public School District (suburban): math 55% / reading 70% proficiency, ranked #32 of 540 in MI (top 6%) — acceptable for families but not a draw, mixed tenant base, ~2y average lease; only 15% free/reduced lunch — higher-income household profile.
- Market conditions: 142 active listings in the ZIP; 2 comparable units currently listed for rent nearby; 1,237 units permitted in Ottawa County in 2024 (443 in 5+ unit buildings).
Forward outlook
- Local home prices are declining (-3.0%/yr); year-one equity from $4k of loan paydown is wiped out by about $18k of value loss. Plan a longer hold.
- Ottawa County population projected at +24% by 2050 — long-run rental-demand tailwind backs the buy-and-hold thesis.
Negotiation context
- It's been on market 379 days — a 12% lower offer ($372k) is reasonable based on typical stale-listing flexibility.
Questions for the listing agent
- What do current leases actually rent for vs. the listed asking? Can we see a recent rent roll and the last 12 months of T-12 income?
- It's been on market 379 days. Have you received any prior offers? Is the seller open to a 12% concession, seller financing, or rate buy-down credit?
- Why hasn't it sold? Are there any deal-killer items the seller is aware of (foundation, flood, title, zoning, code violations)?
- Is there a deadline driving the sale (1031 exchange, divorce, estate, relocation)? That informs how much negotiation room exists.
- The area grade is low — what's the realistic commute time and amenity access for the typical tenant pool here? Any planned neighborhood developments (good or bad) we should know about?
- What's the average days-on-market for RENTAL listings here right now (not sales)? A rising rental-DOM trend means longer vacancies and softer asking-rent achievability than the comps imply.
- What's the recent tenant-quality profile in this submarket — average credit score on applications, eviction rate, late-payment / NSF rate, and stable-employment percentage? A property-management company in the area should have these aggregated.
- How much new for-sale + rental construction is in the pipeline within 1–3 miles? Heavy new supply typically softens prices + rents 12–24 months out; constrained supply supports both.
Investment metrics
- 1% rule
- 0.74% ✗
- Cap rate
- 4.99%
- Cash-on-cash
- -4.67%
- DSCR
- 0.79
- GRM
- 11.3
CMA / ARV
- ARV (median comp)
- $591,298
- List price
- $423,100
- Delta
- -28.45%
- Verdict
- UNDERPRICED
- Comps
- 20 within 1.0 mi
Show comp detail 12 sales within ~0.75 mi
| Address | Dist | Beds/Ba | Sqft | Sold | Price | $/sf | Match |
|---|---|---|---|---|---|---|---|
| 3353 Eagle Peak Dr | 0.32mi | 4/2.5 | 2,308 (+5%) | 15mo | $550,000 | $238 | 64 |
| 8316 Bauerridge Ave | 0.38mi | 4/2.5 | 2,407 (+9%) | 4mo | $589,900 | $245 | 64 |
| 8271 Ironstone Ave | 0.48mi | 4/3.0 | 2,225 (+1%) | 13mo | $455,000 | $204 | 63 |
| 8089 Eagle Peak Dr | 0.48mi | 4/2.5 | 2,434 (+10%) | 2mo | $595,000 | $244 | 59 |
| 8540 Twin Lakes Dr | 0.65mi | 5/3.0 (+1) | 2,266 (+3%) | 3mo | $550,000 | $243 | 56 |
| 8253 Eagle Peak Dr | 0.45mi | 4/2.5 | 2,308 (+5%) | 21mo | $546,210 | $237 | 54 |
| 8143 Eagle Peak Dr | 0.42mi | 4/2.5 | 2,479 (+12%) | 16mo | $575,900 | $232 | 47 |
| 3367 Eagle Peak Dr | 0.30mi | 4/2.5 | 2,535 (+15%) | 23mo | $555,000 | $219 | 42 |
| 8342 Bauerridge Ave | 0.37mi | 4/2.5 | 2,519 (+14%) | 24mo | $605,000 | $240 | 39 |
| 8291 Bauerridge Ave | 0.35mi | 5/3.5 (+1) | 2,437 (+10%) | 23mo | $488,000 | $200 | 38 |
| 3048 Gilmore Ln | 0.73mi | 4/2.5 | 1,946 (-12%) | 12mo | $420,000 | $216 | 36 |
| 8460 Tucker Ct | 0.68mi | 4/2.5 | 2,370 (+8%) | 24mo | $420,000 | $177 | 36 |
Match score weights: distance 35% · size 25% · config 20% · recency 20%. Top-matched comps best support the ARV.
Projected returns pro-forma
-3.0% appreciation · 3.0% rent growth · sell at horizon
- IRR
- -24.2%
- Equity multiple
- 0.17×
- Total profit
- $-136,775
- Equity at exit
- $88,165
- IRR
- -19.5%
- Equity multiple
- -0.04×
- Total profit
- $-171,660
- Equity at exit
- $51,125
Cash invested: $165,564 (down + closing). Projections, not guarantees.
Landlord ↔ Tenant lean methodology
- Overall (STATE)
- 62 Landlord-Friendly
- State Michigan
- 62 Landlord-Friendly · EVEN
- County
- — inherits STATE
- City
- — inherits STATE
ZIP-level market 49428
- Active inventory
- 142
- Price-to-rent
- 8.1×
Monthly cashflow live
- Estimated rent
- $4,357 medium interval (Pro) →
- Mortgage (P&I)
- −$3,101
- Tax est. 1.5%
- −$739 /mo · $8,869/yr
- Insurance
- −$246
- HOA
- −$0
- Vacancy / Maint / Mgmt
- −$915
- Net cashflow
- $-644
Break-even live
UW: 25.0% down · 7.5% · 30yr · 1.5% tax · 5.0% vac · 8.0% maint · 8.0% mgmt
Financing live
Cash to close
- Down payment
- $147,825
- Closing costs
- $17,739
- Reserves months
- —
- Total cash needed
- —
Loan-product check · same deal, 3 products live
Conventional
25% down · 7.5% · 30yr
- Down + closing
- —
- Monthly P&I
- —
- Monthly cashflow
- —
- DSCR
- —
- Eligible?
- —
Personal DTI + credit; lowest rate.
DSCR
20% down · 8.5% · 30yr
- Down + closing
- —
- Monthly P&I
- —
- Monthly cashflow
- —
- DSCR
- —
- Eligible?
- —
No personal income docs; deal must DSCR.
Hard money
10% down · 12.0% · 12mo
- Down + closing
- —
- Monthly P&I
- —
- Monthly cashflow
- —
- DSCR
- —
- Eligible?
- —
Short-term bridge; refi at stabilization.
Rent comps 2 comps
| Address | Beds | Baths | Sqft | Rent | $/sqft | DOM | Units | Dist |
|---|---|---|---|---|---|---|---|---|
| 4638 Rockport Dr Hudsonville, MI | 2.0–3.0 | 2.0–2.5 | 1448 | $2,345 | $1.62 | 2d | 5 | 1.36mi |
| 7269 Yellowstone Dr Hudsonville, MI | 4.0 | 3.0 | 2566 | $6,000 | $2.34 | 14d | 1 | 1.45mi |
Listing history 16 events
-
2026-06-18days on market $423,100 Active 379 DOM
-
2026-06-17days on market $423,100 Active 378 DOM
-
2026-06-16days on market $423,100 Active 377 DOM
-
2026-06-15days on market $423,100 Active 376 DOM
-
2026-06-14days on market $423,100 Active 374 DOM
-
2026-06-10days on market $423,100 Active 371 DOM
-
2026-06-09days on market $423,100 Active 370 DOM
-
2026-06-08days on market $423,100 Active 369 DOM
-
2026-06-07days on market $423,100 Active 368 DOM
-
2026-06-03days on market $423,100 Active 364 DOM
-
2026-06-03days on market $423,100 Active 363 DOM
-
2026-06-01days on market $423,100 Active 362 DOM
-
2026-05-31days on market $423,100 Active 361 DOM
-
2026-04-03price $423,100 872-char remark
Show marketing remark (872 chars)
e ultimate family home might just be the Oakwood. As you pass through the Oakwood's entrance, you're greeted immediately by a cozy main floor den, then the spacious gathering area-a versatile space that's as comfortable supporting an afternoon nap, as it is entertaining several guests. If you enter through the garage, your family gets a generous "landing zone" for shoes, boots, backpacks, and the like. A fully equipped kitchen, dining area, half bath and deck complete the main floor. Upstairs you'll find 4 bedrooms, including an owner's suite with a walk-in closet. Now, back down two stair flights, to the lower level where a potential 5th bedroom, full bath, and rec room are just waiting to be built in, should you decide to go ahead with those options. All this, and priced at less than you'd expect to pay for such an all-around fantastic family home!
-
2025-07-15price $443,100 872-char remark
Show marketing remark (872 chars)
e ultimate family home might just be the Oakwood. As you pass through the Oakwood's entrance, you're greeted immediately by a cozy main floor den, then the spacious gathering area-a versatile space that's as comfortable supporting an afternoon nap, as it is entertaining several guests. If you enter through the garage, your family gets a generous "landing zone" for shoes, boots, backpacks, and the like. A fully equipped kitchen, dining area, half bath and deck complete the main floor. Upstairs you'll find 4 bedrooms, including an owner's suite with a walk-in closet. Now, back down two stair flights, to the lower level where a potential 5th bedroom, full bath, and rec room are just waiting to be built in, should you decide to go ahead with those options. All this, and priced at less than you'd expect to pay for such an all-around fantastic family home!
-
2025-06-04$440,500 Active 872-char remark
Show marketing remark (872 chars)
e ultimate family home might just be the Oakwood. As you pass through the Oakwood's entrance, you're greeted immediately by a cozy main floor den, then the spacious gathering area-a versatile space that's as comfortable supporting an afternoon nap, as it is entertaining several guests. If you enter through the garage, your family gets a generous "landing zone" for shoes, boots, backpacks, and the like. A fully equipped kitchen, dining area, half bath and deck complete the main floor. Upstairs you'll find 4 bedrooms, including an owner's suite with a walk-in closet. Now, back down two stair flights, to the lower level where a potential 5th bedroom, full bath, and rec room are just waiting to be built in, should you decide to go ahead with those options. All this, and priced at less than you'd expect to pay for such an all-around fantastic family home!
ⓘ Source: listings_history table (triggers on properties + properties_extension) + one-shot
backfill from property_details.listing_events for pre-trigger history.
Nearby sold comps map
Loading sold comps map…
Walkable amenities ~0.75 mi
Loading nearby amenities…
Taxation est. · year 1
- Rental income
- $52,287
- − Mortgage interest
- −$33,122
- − Property taxes
- −$8,869
- − Insurance
- −$2,956
- − Repairs & maintenance
- −$4,183
- − Management
- −$4,183
- − Depreciation
- −$17,201
- Taxable loss
- −$18,228
- Est. tax savings @ 24.0%
- +$4,375
- After-tax cash flow
- $-3,355/yr
For passive investors: Depreciation is non-cash, so a rental often shows a tax loss while cash-flowing — sheltering income. Rental losses are passive: they offset passive income freely, and up to $25,000/yr can offset ordinary (W-2) income if you actively participate and your MAGI is under $100k (phasing out to $0 by $150k); unused losses carry forward. On sale, claimed depreciation is recaptured at up to 25%, and gains may owe capital-gains tax (a 1031 exchange can defer both). Figures are a year-1 estimate at your 24.0% rate — not tax advice; consult a CPA.
Condition & rehab AI · 6 photos
This home is in excellent condition with no visible repairs or maintenance needed. It offers a great opportunity for an investor to make some cosmetic updates to enhance its curb appeal and value.
Value-add opportunities
- Both Painting the exterior — Refreshing the exterior paint can enhance curb appeal and increase the home's value.
- Both Landscaping improvements — Enhancing the landscaping can improve the home's curb appeal and attract more potential buyers or renters.
- Both Interior updates — Updating the interior can make the home more appealing and increase its value for both resale and rental purposes.
Renovation cost estimate screening
Value-add ROI direction
- Both Painting the exterior — Refreshing the exterior paint can enhance curb appeal and increase the home's value. ↑
- Both Landscaping improvements — Enhancing the landscaping can improve the home's curb appeal and attract more potential buyers or renters. ↑
- Both Interior updates — Updating the interior can make the home more appealing and increase its value for both resale and rental purposes. ↑
ⓘ Cost ranges are severity-bucket heuristics (US national rule-of-thumb). Get contractor quotes + a written scope before underwriting a rehab budget.
Schools (NCES district)
- District
- Hudsonville Public School District
- NCES district ID
- 2618840
- Math proficiency
- 55% ▼ -10.00%
- Reading proficiency
- 70% ▼ -4.00%
- Median HH income
- $69,784
- Composite
- 54.98/100
- National rank
- #1301
- State rank
- #32 of 540 in MI
Livability — Georgetown
No livability data for this city. (Only ~50 U.S. cities are tracked.)
Census & demographics
- Population (ZIP)
- 28,090
Population outlook (Ottawa County) Hauer SSP2
- Today (2025)
- 313,561 people
- By 2030
- 330,027 · +5.3%
- By 2040
- 361,118 · +15.2%
- By 2050
- 388,414 · +23.9%
- By 2075
- 452,175 · +44.2%
- By 2100
- 473,041 · +50.9%
Race, ethnicity, and origin ACS 2023
- Neighborhood character
- Predominantly White (91%)
- Race & ethnicity
- White 91% Hispanic / Latino 4% Two or more races 3% Asian 1%
- Common ancestry
- Iranian 37% Romanian 8% Lithuanian 3%
- Foreign-born
- 2% · Canada, China, South Korea
- Languages at home
- 97% English-only · Spanish 2%
Political lean MEDSL · Ottawa
- 2024 margin
- Strong R (+20.4) · D 39.0% · R 59.5% · Other 1.5%
- 2008→2024 swing
- +3.4pp toward D · 2008: -23.9pp · 2024: -20.4pp
- All cycles
- 2024: R+20.4 2020: R+21.5 2016: R+30.4 2012: R+34.2 2008: R+23.9
Not yet ingested
- Civics
- —
Market trends
- HPI YoY
- ▼ -234.19%
- Current HPI
- 264.7304
- Rent YoY
- —
- Metro
- —
- State GDP YoY
- ▲ 1.37%
- F500 in state
- 28
Industry mix (Fortune 500 HQ in MI)
| Industry | F500 HQs | Revenue |
|---|---|---|
| Automotive Parts | 3 | $48B |
|
||
| Automotive | 2 | $372B |
|
||
| Chemicals | 1 | $45B |
|
||
| Automotive Retail | 1 | $29B |
|
||
| Healthcare / Medical Devices | 1 | $23B |
|
||
| Automotive Technology | 1 | $20B |
|
||
Price history
-4.0% since first listed3 events — show timeline
- 2026-04-03 Price Changed $423,100 Zillow
- 2025-07-15 Price Changed $443,100 Zillow
- 2025-06-04 Listed $440,500 Zillow
Cash-flow waterfall
monthlySold comps — $/sqft
last 12 mo · ≤1 miLoading sold comps…