 🏗️ New Construction
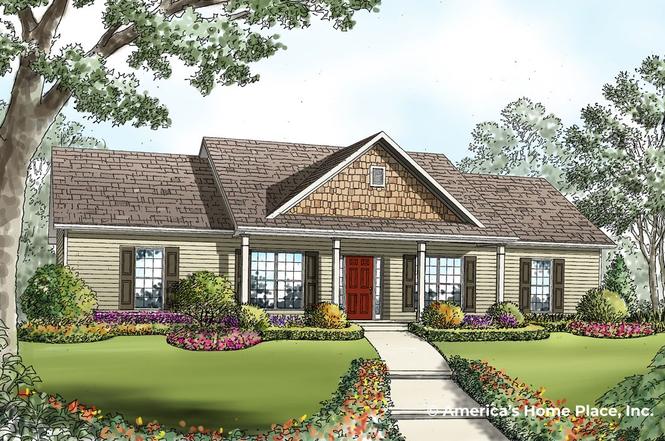
Bedford A Plan · Leland, NC
Flood risk No data
- FEMA flood zone
- —
- Chance of flooding over 30 yrs
- —
- Est. flood insurance / yr
- —
Fire risk No data
- Est. fire insurance / yr
- —
Heat risk No data
- Hot days now (above threshold)
- —
- Hot days in 30 yrs
- —
Wind risk No data
- Chance of severe wind over 30 yrs
- —
Air-quality risk No data
- Unhealthy air days now
- —
- Unhealthy air days in 30 yrs
- —
Risk factors via First Street. Map © Google.
Why this score? — see what drove the F grade
The composite is a weighted blend of 9 inputs, each scored 0–100. Each bar is that input's sub-score; the figure is the points it added to the 100-point composite (weight × sub-score).
- ARV discount +7.5/15.0
- Cash flow +5.2/30.0
- Schools +3.9/10.0
- Livability +3.4/5.0
- Rent growth +2.8/5.0
- Condition / age +2.5/5.0
- 1% rule +0.9/10.0
- DSCR +0.0/10.0
- Appreciation +0.0/10.0
$242,844
🖨 Deal sheet (PDF) 📄 Offer letter ✓ Due diligence
Listing remarks
This classic cottage welcomes you with a charming covered porch that opens into a thoughtfully designed four-bedroom floor plan. The master suite is set apart from the other bedrooms by the spacious central living area. From the dining room, step through the back door and discover the potential for a perfect outdoor entertainment space. The Bedford A offers endless opportunities for comfort and style.
Key facts
- Covered porch
- Master suite
- Optional deck
Tags
Property features AI
Finance
- Financial info: List price $242,844
Exterior
- Home design: Single-family home plan (Bedford A)
- Construction: New construction plan
- Exterior features: Located at W Gate Dr, Leland NC 28451
Interior
- Bedrooms: 4 bedrooms
- Bathrooms: 2 full bathrooms
- Interior features: Plan is the Bedford A model; Active new construction plan
Neighborhood map
What this means for you Summary
Snapshot
- This is a 4-bed/2.0-bath single-family listed at $243k.
Deal economics
- At list price, monthly cash flow is $-841 ($-10k/yr) — negative.
- The deal already cash-flows at list — no discount required.
- To meet the 1% rule (rent ≥ 1% of price), the offer needs to be $219k (10.0% below list).
- Recommended offer: $214k (12.0% below list) — sets the bar for market timing.
Location & tenants
- Location reads 68/100 on livability (#177 in NC) — a middle-class / working-renter tenant base. Strengths: crime A+, housing A+, employment A; Watch: health & safety D, amenities F, commute F.
- Brunswick County Schools (rural): math 45% / reading 47% proficiency, ranked #82 of 178 in NC (top 46%) — families likely to look elsewhere, expect single-tenant / working-renter base with shorter leases.
- Zoned schools: Town Creek Elementary (math 50% / reading 53%, grade C-, #392 of 1,410 statewide, top 28%, 654 students, 100% FRL); Leland Middle (math 26% / reading 36%, grade F, #326 of 475 statewide, top 69%, 780 students, 100% FRL); North Brunswick High (math 57% / reading 49%, grade C-, #281 of 535 statewide, top 53%, 1,450 students, 100% FRL) — zoned schools average 100% FRL vs 53% district-wide (46 pts higher); higher-poverty schools than district average — tighter screening recommended.
- Market conditions: Rents rising (+1.2%/yr); 1224 active listings in the ZIP; 11 comparable units currently listed for rent nearby; rentals at typical pace (median 16d on market — plan ~3-4 weeks tenant-placement turnaround); solid renter incomes; 6,112 units permitted in Brunswick County in 2024 (990 in 5+ unit buildings).
- This rent runs 32% of the median local income ($81k/yr) — at the standard rent-burdened threshold; future hikes will face affordability resistance.
Forward outlook
- Local home prices are declining (-3.0%/yr); year-one equity from $3k of loan paydown is wiped out by about $11k of value loss. Plan a longer hold.
- Brunswick County population projected at +36% by 2050 — long-run rental-demand tailwind backs the buy-and-hold thesis.
Negotiation context
- It's been on market 546 days — a 12% lower offer ($214k) is reasonable based on typical stale-listing flexibility.
Questions for the listing agent
- What do current leases actually rent for vs. the listed asking? Can we see a recent rent roll and the last 12 months of T-12 income?
- It's been on market 546 days. Have you received any prior offers? Is the seller open to a 12% concession, seller financing, or rate buy-down credit?
- Why hasn't it sold? Are there any deal-killer items the seller is aware of (foundation, flood, title, zoning, code violations)?
- Is there a deadline driving the sale (1031 exchange, divorce, estate, relocation)? That informs how much negotiation room exists.
- The area grade is low — what's the realistic commute time and amenity access for the typical tenant pool here? Any planned neighborhood developments (good or bad) we should know about?
- What's the average days-on-market for RENTAL listings here right now (not sales)? A rising rental-DOM trend means longer vacancies and softer asking-rent achievability than the comps imply.
- What's the recent tenant-quality profile in this submarket — average credit score on applications, eviction rate, late-payment / NSF rate, and stable-employment percentage? A property-management company in the area should have these aggregated.
- How much new for-sale + rental construction is in the pipeline within 1–3 miles? Heavy new supply typically softens prices + rents 12–24 months out; constrained supply supports both.
Investment metrics
- 1% rule
- 0.59% ✗
- Cap rate
- 3.58%
- Cash-on-cash
- -9.70%
- DSCR
- 0.57
- GRM
- 14.2
CMA / ARV
- ARV (on-the-fly)
- $371,520
- Comps found
- 9
Show comp detail 9 sales within ~0.75 mi
| Address | Dist | Beds/Ba | Sqft | Sold | Price | $/sf | Match |
|---|---|---|---|---|---|---|---|
| 1042 Maplechase Dr SE | 0.56mi | 3/2.0 (-1) | 1,781 (+4%) | 7mo | $370,000 | $208 | 57 |
| 1019 Cherrywood Ct | 0.63mi | 3/2.0 (-1) | 1,745 (+2%) | 11mo | $357,500 | $205 | 54 |
| 9384 Night Harbor Dr SE | 0.58mi | 3/2.0 (-1) | 1,955 (+14%) | 2mo | $408,000 | $209 | 44 |
| 1026 Cherrywood Ct | 0.69mi | 4/3.0 | 1,900 (+10%) | 6mo | $380,000 | $200 | 42 |
| 1148 Grandiflora Dr | 0.70mi | 3/2.0 (-1) | 1,941 (+13%) | 2mo | $428,000 | $221 | 39 |
| 1030 Garden Club Way | 0.74mi | 3/2.0 (-1) | 1,539 (-10%) | 9mo | $389,000 | $253 | 35 |
| 1133 Grandiflora Dr | 0.61mi | 3/2.0 (-1) | 1,965 (+14%) | 11mo | $425,000 | $216 | 34 |
| 1047 Garden Club Way | 0.71mi | 3/2.0 (-1) | 1,603 (-7%) | 22mo | $368,000 | $230 | 32 |
| 1041 Garden Club Way | 0.71mi | 3/2.0 (-1) | 1,500 (-13%) | 22mo | $364,000 | $243 | 22 |
Match score weights: distance 35% · size 25% · config 20% · recency 20%. Top-matched comps best support the ARV.
Projected returns pro-forma
-3.0% appreciation · 1.24% rent growth · sell at horizon
- IRR
- -35.6%
- Equity multiple
- -0.13×
- Total profit
- $-117,543
- Equity at exit
- $55,395
- IRR
- -60.9%
- Equity multiple
- -0.79×
- Total profit
- $-186,265
- Equity at exit
- $32,122
Cash invested: $104,026 (down + closing). Projections, not guarantees.
Landlord ↔ Tenant lean methodology
- Overall (STATE)
- 85 Strongly Landlord-Friendly
- State North Carolina
- 85 Strongly Landlord-Friendly · R+3
- County
- — inherits STATE
- City
- — inherits STATE
ZIP-level market 28451
- Rents YoY
- 1.2%
- Active inventory
- 1224
- Price-to-rent
- 9.3×
Monthly cashflow live
- Estimated rent
- $2,185 high interval (Pro) →
- Mortgage (P&I)
- −$1,948
- Tax est. 1.5%
- −$464 /mo · $5,573/yr
- Insurance
- −$155
- HOA
- −$0
- Vacancy / Maint / Mgmt
- −$459
- Net cashflow
- $-841
Break-even live
Sensitivity live
| Price | -10% $-584 | -5% $-713 | +0% $-841 | +5% $-969 | +10% $-1,098 |
|---|---|---|---|---|---|
| Rent | -10% $-1,014 | -5% $-927 | +0% $-841 | +5% $-755 | +10% $-668 |
| Rate | -1.0pp $-654 | -0.5pp $-747 | base $-841 | +0.5pp $-937 | +1.0pp $-1,035 |
UW: 25.0% down · 7.5% · 30yr · 1.5% tax · 5.0% vac · 8.0% maint · 8.0% mgmt
Financing live
Cash to close
- Down payment
- $92,880
- Closing costs
- $11,146
- Reserves months
- —
- Total cash needed
- —
Loan-product check · same deal, 3 products live
Conventional
25% down · 7.5% · 30yr
- Down + closing
- —
- Monthly P&I
- —
- Monthly cashflow
- —
- DSCR
- —
- Eligible?
- —
Personal DTI + credit; lowest rate.
DSCR
20% down · 8.5% · 30yr
- Down + closing
- —
- Monthly P&I
- —
- Monthly cashflow
- —
- DSCR
- —
- Eligible?
- —
No personal income docs; deal must DSCR.
Hard money
10% down · 12.0% · 12mo
- Down + closing
- —
- Monthly P&I
- —
- Monthly cashflow
- —
- DSCR
- —
- Eligible?
- —
Short-term bridge; refi at stabilization.
Rent comps 11 comps
| Address | Beds | Baths | Sqft | Rent | $/sqft | DOM | Units | Dist |
|---|---|---|---|---|---|---|---|---|
| 1001 Hunterstone Dr Leland, NC | 1.0–3.0 | 1.0–2.0 | 850 | $1,482 | $1.74 | 15d | 29 | 0.22mi |
| 2108 Silty Soil Ct Leland, NC | 2.0–3.0 | 2.5 | 1442 | $2,074 | $1.44 | 15d | 23 | 0.55mi |
| 214 Kingsmeadow CIR Belville, NC | 1.0–3.0 | 1.0–2.0 | 1021 | $1,950 | $1.91 | 15d | 9 | 0.63mi |
| 212 Sand Pebble Dr SE Leland, NC | 3.0 | 2.0 | 1425 | $2,150 | $1.51 | 15d | 1 | 0.65mi |
| 9409 Night Harbor Dr Leland, NC | 3.0 | 2.0 | 1603 | $1,899 | $1.18 | 25d | 1 | 0.70mi |
| 2915 Shoals Point Way Leland, NC | 1.0–3.0 | 1.0–2.5 | 901 | $2,035 | $2.26 | 15d | 49 | 0.81mi |
| 1018 Cordgrass Ln Leland, NC | 3.0 | 2.0 | 2117 | $2,400 | $1.13 | 25d | 1 | 0.85mi |
| 2626 Goose Island Dr Leland, NC | 2.0–3.0 | 2.5 | 1369 | $2,030 | $1.48 | 15d | 10 | 1.01mi |
| 9543 Mermaids Watch Ct Leland, NC | 3.0 | 2.0 | 1116 | $2,250 | $2.02 | 15d | 1 | 1.35mi |
| 4756 Scaup Way Winnabow, NC | 3.0 | 2.0 | 1618 | $3,500 | $2.16 | 15d | 1 | 1.42mi |
| 304 Bedstone DR Leland, NC | 3.0–4.0 | 2.0–2.5 | 1669 | $2,600 | $1.56 | 15d | 1 | 1.44mi |
Listing history 16 events
-
2026-06-22days on market $242,844 Active 546 DOM
-
2026-06-18days on market $242,844 Active 543 DOM
-
2026-06-17days on market $242,844 Active 542 DOM
-
2026-06-16days on market $242,844 Active 541 DOM
-
2026-06-15days on market $242,844 Active 540 DOM
-
2026-06-14days on market $242,844 Active 538 DOM
-
2026-06-13days on market $242,844 Active 537 DOM
-
2026-06-10days on market $242,844 Active 535 DOM
-
2026-06-09days on market $242,844 Active 534 DOM
-
2026-06-08days on market $242,844 Active 533 DOM
-
2026-06-07days on market $242,844 Active 532 DOM
-
2026-06-05days on market $242,844 Active 529 DOM
-
2026-06-02days on market $242,844 Active 527 DOM
-
2026-06-01days on market $242,844 Active 526 DOM
-
2026-05-31days on market $242,844 Active 525 DOM
-
2026-05-30days on market $242,844 Active 524 DOM
ⓘ Source: listings_history table (triggers on properties + properties_extension) + one-shot
backfill from property_details.listing_events for pre-trigger history.
Nearby sold comps map
Loading sold comps map…
Walkable amenities ~0.75 mi
Loading nearby amenities…
Taxation est. · year 1
- Rental income
- $26,224
- − Mortgage interest
- −$20,811
- − Property taxes
- −$5,573
- − Insurance
- −$1,858
- − Repairs & maintenance
- −$2,098
- − Management
- −$2,098
- − Depreciation
- −$10,808
- Taxable loss
- −$17,021
- Est. tax savings @ 24.0%
- +$4,085
- After-tax cash flow
- $-6,008/yr
For passive investors: Depreciation is non-cash, so a rental often shows a tax loss while cash-flowing — sheltering income. Rental losses are passive: they offset passive income freely, and up to $25,000/yr can offset ordinary (W-2) income if you actively participate and your MAGI is under $100k (phasing out to $0 by $150k); unused losses carry forward. On sale, claimed depreciation is recaptured at up to 25%, and gains may owe capital-gains tax (a 1031 exchange can defer both). Figures are a year-1 estimate at your 24.0% rate — not tax advice; consult a CPA.
Schools (NCES district)
- District
- Brunswick County Schools
- NCES district ID
- 3700420
- Math proficiency
- 45% ▲ 4.00%
- Reading proficiency
- 47% ▲ 4.00%
- Median HH income
- $47,494
- Composite
- 39.23/100
- National rank
- #4011
- State rank
- #82 of 178 in NC
Livability — Leland
- Score
- 68/100
- State rank
- #177
- US rank
- #9158
Category grades
Schools grade is shown separately in the Schools card above.
Census & demographics
- Census place
- Leland, NC
- County
- Brunswick County · 131,536 people
- City population
- 46,933
- Metro
- Myrtle Beach-Conway-North Myrtle Beach, SC-NC
- Population (ZIP)
- 46,933
- Household income
- $81,481
- Rent vs Own
- Severe rent burden
- 1049.0
Population outlook (Brunswick County) Hauer SSP2
- Today (2025)
- 152,111 people
- By 2030
- 165,705 · +8.9%
- By 2040
- 188,494 · +23.9%
- By 2050
- 206,228 · +35.6%
- By 2075
- 237,876 · +56.4%
- By 2100
- 251,451 · +65.3%
Race, ethnicity, and origin ACS 2023
- Neighborhood character
- Predominantly White (71%)
- Race & ethnicity
- White 71% Black 12% Hispanic / Latino 11% Two or more races 8%
- Hispanic origin (detail)
- Mexican 7% Puerto Rican 1%
- Common ancestry
- Slovak 2% Lithuanian 2% Romanian 2%
- Foreign-born
- 5% · Canada
- Languages at home
- 91% English-only · Spanish 7% Other Indo-European 1%
Political lean MEDSL · Brunswick
- 2024 margin
- Strong R (+24.9) · D 37.2% · R 62.0%
- 2008→2024 swing
- -6.9pp toward R · 2008: -17.9pp · 2024: -24.9pp
- All cycles
- 2024: R+24.9 2020: R+25.0 2016: R+28.7 2012: R+22.2 2008: R+17.9
Not yet ingested
- Civics
- —
Market trends
- HPI YoY
- ▼ -99.99%
- Current HPI
- 148.6217
- Rent YoY
- ▲ 1.24%
- Metro
- Myrtle Beach-Conway-North Myrtle Beach, SC-NC
- State GDP YoY
- ▲ 3.28%
- F500 in state
- 26
Industry mix (Fortune 500 HQ in NC)
| Industry | F500 HQs | Revenue |
|---|---|---|
| Financial Services | 2 | $213B |
|
||
| Retail | 2 | $95B |
|
||
| Industrial Conglomerate | 1 | $38B |
|
||
| Metals / Steel | 1 | $35B |
|
||
| Utilities | 1 | $30B |
|
||
| Industrial Machinery | 1 | $19B |
|
||
Cash-flow waterfall
monthlySold comps — $/sqft
last 12 mo · ≤1 miLoading sold comps…