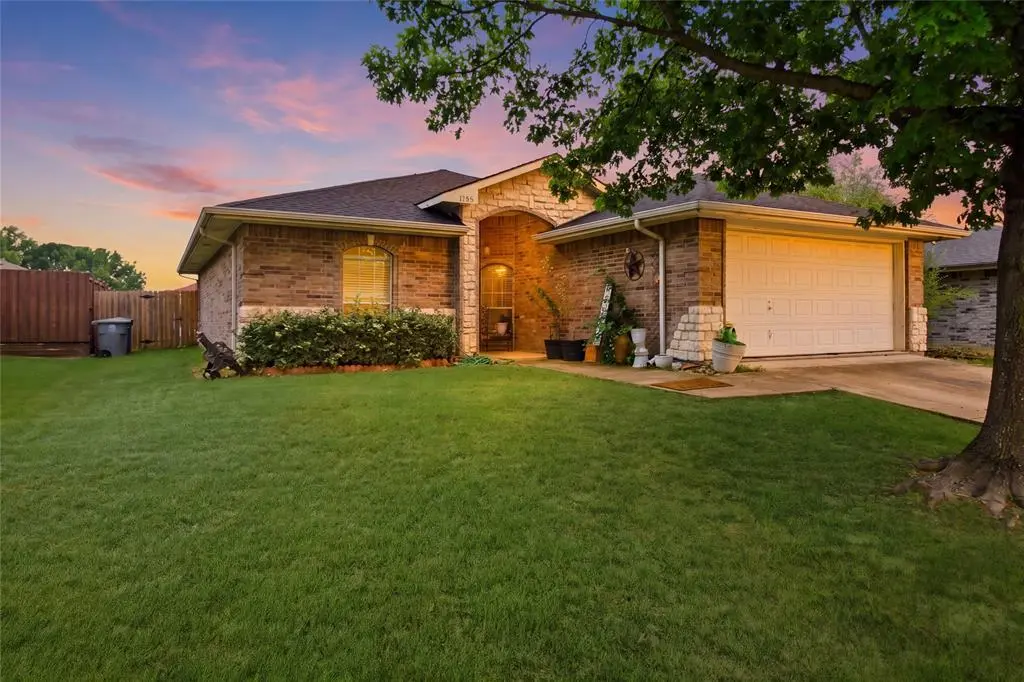
1648 Tampa Bay Dr · Dallas, TX
Flood risk 1/10 · Minimal
- FEMA flood zone
- X (unshaded)
- Chance of flooding over 30 yrs
- 0.0%
- Est. flood insurance / yr
- $507 – $1,088
Fire risk 4/10 · Minor
- Est. fire insurance / yr
- $1,222 – $2,270
Heat risk 8/10 · Major
- Hot days now (above 110°F)
- 7 days/yr
- Hot days in 30 yrs
- 26 days/yr
Wind risk 6/10 · Moderate
- Chance of severe wind over 30 yrs
- 27.0%
Air-quality risk 2/10 · Minimal
- Unhealthy air days now
- 1 days/yr
- Unhealthy air days in 30 yrs
- 2 days/yr
Risk factors via First Street. Map © Google.
Why this score? — see what drove the D- grade
The composite is a weighted blend of 9 inputs, each scored 0–100. Each bar is that input's sub-score; the figure is the points it added to the 100-point composite (weight × sub-score).
- Cash flow +9.6/30.0
- ARV discount +9.5/15.0
- Livability +4.0/5.0
- 1% rule +3.8/10.0
- Rent growth +2.8/5.0
- Schools +2.8/10.0
- DSCR +2.7/10.0
- Condition / age +2.5/5.0
- Appreciation +0.0/10.0
$249,997
🖨 Deal sheet (PDF) 📄 Offer letter ✓ Due diligence
Listing remarks
Charming and well-maintained 4-bedroom, 2-bath AS IS home in the heart of Dallas! This property offers a functional layout with spacious living areas, comfortable bedrooms, and plenty of potential for homeowners looking for extra space. Located in the established Sandyland Estates subdivision with low HOA dues, this home is conveniently close to major highways, shopping, dining, and schools within Dallas ISD. The neighborhood offers an established residential feel with natural gas utilities in the area. Whether you’re looking for a primary residence or additional space for a growing household, this home is priced to sell and move quickly! Don’t miss this great opportunity in a c
Key facts
- Functional layout
- Low hoa dues
- 7,492 sq ft lot
Tags
Property features AI
Finance
- Other: Community features include playground and sidewalks
- HOA & community: Mandatory HOA; HOA covers management fees; HOA fee $120 annually
Exterior
- Parking: Attached 2-car garage; Covered parking for 2 vehicles; Driveway and on-street parking
- Security: Wireless security features
- Utilities: City water; City sewer; Electricity connected
- Home design: Single family residence; One story; Residential property
- Construction: Built in 2008; Composition/shingle roof; Slab foundation
- Exterior features: Privacy fencing; Sidewalks; Curbs; Playground in community
Interior
- Kitchen: Dishwasher; Disposal; Electric cooktop; Electric oven; Microwave
- Bedrooms: 4 bedrooms (all on main level); Primary bedroom with walk-in closet
- Flooring: Ceramic tile
- Bathrooms: 2 full bathrooms (on main level)
- Heating & cooling: Central heating; Central air; Ceiling fan(s)
- Interior features: Open floorplan; Pantry; Cable TV available
- Laundry & utility: Washer/dryer connections (standard - laundry details not otherwise specified)
Neighborhood map
What this means for you Summary
Snapshot
- This is a 4-bed/2.0-bath single-family listed at $250k.
Deal economics
- At list price, monthly cash flow is $-170 ($-2k/yr) — negative.
- To cash-flow at today's rent, offer at most $220k (12.0% below list).
- To meet the 1% rule (rent ≥ 1% of price), the offer needs to be $221k (11.6% below list).
- Recommended offer: $220k (12.0% below list) — sets the bar for cash-flow.
- Cap rate 5.5% vs local median 2.3% in Dallas — top-decile yield for the area; either an underpriced asset or a hidden risk that comps aren't pricing in. Stress-test before assuming the spread holds.
Location & tenants
- Location reads 81/100 on livability (#24 in TX, #1,380 nationally) — a professional / high-income tenant draw. Strengths: amenities A+, commute A+, housing A+; Watch: crime F.
- Dallas ISD (urban): math 31% / reading 36% proficiency, ranked #559 of 826 in TX (top 68%) — families likely to look elsewhere, expect single-tenant / working-renter base with shorter leases; 83% free/reduced lunch — lower-income household profile, screen leases tightly.
- Zoned schools: Nancy Moseley El (math 38% / reading 45%, grade F, #1,437 of 4,322 statewide, top 34%, 618 students, 96% FRL); Young Women'S Steam Academy At Balch Springs Middl (math 31% / reading 34%, grade F, #947 of 1,662 statewide, top 58%, 869 students, 91% FRL); H Grady Spruce H S (math 21% / reading 18%, grade F, #1,424 of 1,632 statewide, top 88%, 1,558 students, 96% FRL).
- Market conditions: Rents rising (+1.0%/yr); 203 active listings in the ZIP; 13 comparable units currently listed for rent nearby; rentals leasing fast (median 8d on market — plan ~1-2 weeks tenant-placement turnaround); 12,577 units permitted in Dallas County in 2024 (6,829 in 5+ unit buildings).
- At $2,209/mo this rent would consume 48% of the median local household income ($56k/yr) (locally 2649% of renters already pay >50% of income on rent) — very limited rent-growth headroom before tenants either downsize or default.
Forward outlook
- Local home prices are declining (-3.0%/yr); year-one equity from $2k of loan paydown is wiped out by about $8k of value loss. Plan a longer hold.
- Dallas County population projected at +35% by 2050 — long-run rental-demand tailwind backs the buy-and-hold thesis.
Negotiation context
- It's been on market 39 days — a 3% lower offer ($242k) is reasonable based on typical stale-listing flexibility.
Risks & watch-outs
- Climate carrying-cost: major wind risk, 27% chance of damaging wind over 30y; extreme-heat days projected 7→26/yr by 2055 (HVAC capex compounding) — expect insurance premiums to compound above CPI over the hold.
Questions for the listing agent
- What do current leases actually rent for vs. the listed asking? Can we see a recent rent roll and the last 12 months of T-12 income?
- It's been on market 39 days. Have you received any prior offers? Is the seller open to a 12% concession, seller financing, or rate buy-down credit?
- What does the HOA fee cover, when was the last increase, and are there any pending special assessments or reserve-fund shortfalls?
- Is there a deadline driving the sale (1031 exchange, divorce, estate, relocation)? That informs how much negotiation room exists.
- Crime grade is F in this area — have there been break-ins, vandalism, or insurance claims at this property in the last 3 years? What carrier currently insures it and at what premium?
- The area grade is low — what's the realistic commute time and amenity access for the typical tenant pool here? Any planned neighborhood developments (good or bad) we should know about?
- What's the average days-on-market for RENTAL listings here right now (not sales)? A rising rental-DOM trend means longer vacancies and softer asking-rent achievability than the comps imply.
- What's the recent tenant-quality profile in this submarket — average credit score on applications, eviction rate, late-payment / NSF rate, and stable-employment percentage? A property-management company in the area should have these aggregated.
- How much new for-sale + rental construction is in the pipeline within 1–3 miles? Heavy new supply typically softens prices + rents 12–24 months out; constrained supply supports both.
Investment metrics
- 1% rule
- 0.88% ✗
- Cap rate
- 5.48%
- Cash-on-cash
- -2.92%
- DSCR
- 0.87
- GRM
- 9.4
CMA / ARV
- ARV (median comp)
- $261,608
- List price
- $249,997
- Delta
- -4.44%
- Verdict
- FAIR
- Comps
- 20 within 1.0 mi
Show comp detail 12 sales within ~0.75 mi
| Address | Dist | Beds/Ba | Sqft | Sold | Price | $/sf | Match |
|---|---|---|---|---|---|---|---|
| 9480 Sandyland Blvd | 0.17mi | 3/2.5 (-1) | 1,500 (-3%) | 2mo | $299,000 | $199 | 78 |
| 9628 Michelle Dr | 0.43mi | 3/2.5 (-1) | 1,533 (-1%) | 4mo | $231,000 | $151 | 68 |
| 1646 Portofino Dr | 0.17mi | 4/2.0 | 1,705 (+10%) | 10mo | $309,900 | $182 | 67 |
| 1573 Portofino Dr | 0.22mi | 4/2.0 | 1,735 (+12%) | 4mo | $310,000 | $179 | 67 |
| 1655 Palm Beach Ave | 0.09mi | 4/2.0 | 1,742 (+12%) | 12mo | $315,000 | $181 | 65 |
| 9470 Sandyland Blvd | 0.16mi | 3/2.0 (-1) | 1,350 (-13%) | 4mo | $295,000 | $219 | 63 |
| 9917 Oakwood Dr | 0.64mi | 3/2.0 (-1) | 1,527 (-1%) | 6mo | $299,950 | $196 | 58 |
| 2015 Teagarden Ct | 0.63mi | 3/2.0 (-1) | 1,602 (+3%) | 5mo | $220,000 | $137 | 56 |
| 9820 Michelle Dr | 0.63mi | 3/2.0 (-1) | 1,562 (+1%) | 14mo | $249,900 | $160 | 53 |
| 8916 Catalonia Dr | 0.58mi | 3/2.0 (-1) | 1,408 (-9%) | 2mo | $264,900 | $188 | 51 |
| 9735 Jo Pierce St | 0.64mi | 3/2.0 (-1) | 1,440 (-7%) | 8mo | $130,000 | $90 | 47 |
| 8418 Plainview Dr | 0.61mi | 4/3.5 | 1,744 (+13%) | 9mo | $270,000 | $155 | 37 |
Match score weights: distance 35% · size 25% · config 20% · recency 20%. Top-matched comps best support the ARV.
Projected returns pro-forma
-3.0% appreciation · 1.02% rent growth · sell at horizon
- IRR
- -23.6%
- Equity multiple
- 0.21×
- Total profit
- $-55,514
- Equity at exit
- $37,275
- IRR
- -25.7%
- Equity multiple
- -0.12×
- Total profit
- $-78,712
- Equity at exit
- $21,615
Cash invested: $69,999 (down + closing). Projections, not guarantees.
Landlord ↔ Tenant lean methodology
- Overall (STATE)
- 87 Strongly Landlord-Friendly
- State Texas
- 87 Strongly Landlord-Friendly · R+5
- County
- — inherits STATE
- City
- — inherits STATE
ZIP-level market 75217
- Home prices YoY
- -4.3%
- Rents YoY
- 1.0%
- Active inventory
- 203
- Price-to-rent
- 9.4×
Monthly cashflow live
- Estimated rent
- $2,209 high interval (Pro) →
- Mortgage (P&I)
- −$1,311
- Tax from tax record
- −$490 /mo · $5,885/yr
- Insurance
- −$104
- HOA
- −$10
- Vacancy / Maint / Mgmt
- −$464
- Net cashflow
- $-170
Break-even live
Sensitivity live
| Price | -10% $-29 | -5% $-99 | +0% $-170 | +5% $-241 | +10% $-312 |
|---|---|---|---|---|---|
| Rent | -10% $-345 | -5% $-257 | +0% $-170 | +5% $-83 | +10% $4 |
| Rate | -1.0pp $-44 | -0.5pp $-107 | base $-170 | +0.5pp $-235 | +1.0pp $-301 |
UW: 25.0% down · 7.5% · 30yr · 1.5% tax · 5.0% vac · 8.0% maint · 8.0% mgmt
Financing live
Cash to close
- Down payment
- $62,499
- Closing costs
- $7,500
- Reserves months
- —
- Total cash needed
- —
Loan-product check · same deal, 3 products live
Conventional
25% down · 7.5% · 30yr
- Down + closing
- —
- Monthly P&I
- —
- Monthly cashflow
- —
- DSCR
- —
- Eligible?
- —
Personal DTI + credit; lowest rate.
DSCR
20% down · 8.5% · 30yr
- Down + closing
- —
- Monthly P&I
- —
- Monthly cashflow
- —
- DSCR
- —
- Eligible?
- —
No personal income docs; deal must DSCR.
Hard money
10% down · 12.0% · 12mo
- Down + closing
- —
- Monthly P&I
- —
- Monthly cashflow
- —
- DSCR
- —
- Eligible?
- —
Short-term bridge; refi at stabilization.
Rent comps 13 comps
| Address | Beds | Baths | Sqft | Rent | $/sqft | DOM | Units | Dist |
|---|---|---|---|---|---|---|---|---|
| 1609 Portofino Dr Dallas, TX | 4.0 | 2.0 | 1735 | $2,320 | $1.34 | 16d | 1 | 0.23mi |
| 9720 Brierwyck Dr Dallas, TX | 3.0 | 2.0 | 1229 | $1,986 | $1.62 | 8d | 1 | 0.49mi |
| 9444 Lipton Ln Dallas, TX | 3.0 | 2.0 | 1638 | $2,150 | $1.31 | 45d | 1 | 0.76mi |
| 9290 Crimnson Ct Dallas, TX | 3.0 | 2.0 | 1606 | $2,050 | $1.28 | 45d | 1 | 0.99mi |
| 9290 Crimnson Ct Dallas, TX | 3.0 | 2.0 | 1606 | $1,900 | $1.18 | 4d | 1 | 0.99mi |
| 9431 Crimnson Ct Dallas, TX | 4.0 | 2.0 | 1919 | $2,299 | $1.20 | 4d | 1 | 1.05mi |
| 1903 Education Way Dallas, TX | 3.0–4.0 | 2.0–2.5 | 1775 | $2,550 | $1.44 | 1d | 13 | 1.08mi |
| 2356 Licorice Pl Dallas, TX | 3.0 | 2.0 | 1287 | $1,800 | $1.40 | 45d | 1 | 1.10mi |
| 9234 Crimnson Ct Dallas, TX | 3.0 | 2.0 | 1266 | $2,080 | $1.64 | 13d | 1 | 1.10mi |
| 1304 Haymarket Rd Dallas, TX | 3.0 | 2.0 | 1481 | $1,200 | $0.81 | 5d | 1 | 1.35mi |
| 10022 Everton Pl Dallas, TX | 4.0 | 2.0 | 1773 | $2,450 | $1.38 | 1d | 1 | 1.39mi |
| 1339 Mosely Cir Dallas, TX | 3.0 | 2.0 | 1498 | $1,000 | $0.67 | 1d | 1 | 1.45mi |
| 1256 Mosely Cir Dallas, TX | 3.0 | 2.0 | 1267 | $1,500 | $1.18 | 45d | 1 | 1.48mi |
HOA detail
- Monthly dues
- $10 · $120/yr
- Likely covers
- gas
Listing history 15 events
-
2026-06-21days on market $249,997 Active 39 DOM
-
2026-06-18days on market $249,997 Active 36 DOM
-
2026-06-17days on market $249,997 Active 35 DOM
-
2026-06-16days on market $249,997 Active 34 DOM
-
2026-06-15days on market $249,997 Active 33 DOM
-
2026-06-13days on market $249,997 Active 31 DOM
-
2026-06-09days on market $249,997 Active 27 DOM
-
2026-06-08days on market $249,997 Active 26 DOM
-
2026-06-07days on market $249,997 Active 25 DOM
-
2026-06-04pricedays on market $249,997 Active 22 DOM
-
2026-06-03days on market $269,999 Active 21 DOM
-
2026-06-02days on market $269,999 Active 20 DOM
-
2026-06-01days on market $269,999 Active 19 DOM
-
2026-05-31days on market $269,999 Active 18 DOM
-
2026-05-11$269,999 Active 759-char remark
ⓘ Source: listings_history table (triggers on properties + properties_extension) + one-shot
backfill from property_details.listing_events for pre-trigger history.
Tax reassessment forecast TX · Resets to sale price
- Current annual tax
- $5,885 · $490/mo
- Projected year-2 tax
- $5,885 · $490/mo
- Expected delta
- $0/yr ($0/mo · 0.0%)
ⓘ Screening estimate from a state-policy table — verify with the county assessor before closing.
Climate risk First Street
- Flood 1/10 Low FEMA zone X (unshaded) · 0% chance over 30 yrs
- Wildfire 4/10 Moderate
- Heat 8/10 Severe 7 d/yr ≥110°F today · 26 d/yr by 30 yrs out
- Wind 6/10 Major 27% chance of damaging wind over 30 yrs
- Air quality 2/10 Low 1 unhealthy d/yr today · 2 by 30 yrs out
Nearby sold comps map
Loading sold comps map…
Walkable amenities ~0.75 mi
Loading nearby amenities…
Taxation est. · year 1
- Rental income
- $26,513
- − Mortgage interest
- −$14,004
- − Property taxes
- −$5,885
- − Insurance
- −$1,250
- − Repairs & maintenance
- −$2,121
- − Management
- −$2,121
- − HOA
- −$120
- − Depreciation
- −$7,273
- Taxable loss
- −$6,260
- Est. tax savings @ 24.0%
- +$1,502
- After-tax cash flow
- $-539/yr
For passive investors: Depreciation is non-cash, so a rental often shows a tax loss while cash-flowing — sheltering income. Rental losses are passive: they offset passive income freely, and up to $25,000/yr can offset ordinary (W-2) income if you actively participate and your MAGI is under $100k (phasing out to $0 by $150k); unused losses carry forward. On sale, claimed depreciation is recaptured at up to 25%, and gains may owe capital-gains tax (a 1031 exchange can defer both). Figures are a year-1 estimate at your 24.0% rate — not tax advice; consult a CPA.
Schools (NCES district)
- District
- Dallas ISD
- NCES district ID
- 4816230
- Math proficiency
- 31% ▼ -16.00%
- Reading proficiency
- 36% ▼ -4.00%
- Median HH income
- $42,881
- Composite
- 28.41/100
- National rank
- #6763
- State rank
- #559 of 826 in TX
Livability — Dallas
- Score
- 81/100
- State rank
- #24
- US rank
- #1380
Category grades
Schools grade is shown separately in the Schools card above.
Census & demographics
- Census place
- Dallas, TX
- County
- Dallas County · 2,612,404 people
- City population
- 1,168,437
- Metro
- Dallas-Fort Worth-Arlington, TX
- Population (ZIP)
- 85,028
- Household income
- $55,723
- Rent vs Own
- Severe rent burden
- 2649.0
Population outlook (Dallas County) Hauer SSP2
- Today (2025)
- 2,979,839 people
- By 2030
- 3,191,823 · +7.1%
- By 2040
- 3,619,611 · +21.5%
- By 2050
- 4,026,915 · +35.1%
- By 2075
- 4,957,073 · +66.4%
- By 2100
- 5,508,725 · +84.9%
Race, ethnicity, and origin ACS 2023
- Neighborhood character
- Predominantly Hispanic (73%)
- Race & ethnicity
- Hispanic / Latino 73% Two or more races 34% Black 20% White 6%
- Hispanic origin (detail)
- Mexican 68%
- Foreign-born
- 30% · Canada, Philippines
- Languages at home
- 34% English-only · Spanish 65% Other Asian/Pacific 1%
Political lean MEDSL · Dallas
- 2024 margin
- Strong D (+22.2) · D 60.2% · R 38.0% · Other 1.8%
- 2008→2024 swing
- +6.9pp toward D · 2008: 15.3pp · 2024: 22.2pp
- All cycles
- 2024: D+22.2 2020: D+31.6 2016: D+26.2 2012: D+15.4 2008: D+15.3
Not yet ingested
- Civics
- —
Market trends
- HPI YoY
- ▼ -17.04%
- Current HPI
- 382.5527
- Rent YoY
- ▲ 1.02%
- Metro
- Dallas-Fort Worth-Arlington, TX
- State GDP YoY
- ▲ 3.95%
- F500 in state
- 110
Industry mix (Fortune 500 HQ in TX)
| Industry | F500 HQs | Revenue |
|---|---|---|
| Energy | 16 | $1,198B |
|
||
| Technology | 5 | $198B |
|
||
| Engineering / Construction | 4 | $72B |
|
||
| Energy Services | 3 | $60B |
|
||
| Utilities | 3 | $41B |
|
||
| Healthcare | 2 | $330B |
|
||
Price history
-7.4% since first listed3 events — show timeline
- 2026-06-03 Price Changed $249,997 NTREIS
- 2026-06-02 Sold (Public Records) — Public Records
- 2026-05-11 Listed $269,999 NTREIS
Property tax history
+3.1%/yrLatest (2025): $5,885 · -0.4% YoY. Source: county tax records.
Cash-flow waterfall
monthlySold comps — $/sqft
last 12 mo · ≤1 miLoading sold comps…