235 Gibson Cir · Hortense, GA
Flood risk 1/10 · Minimal
- FEMA flood zone
- X (unshaded)
- Chance of flooding over 30 yrs
- 0.0%
- Est. flood insurance / yr
- $507 – $1,088
Fire risk 7/10 · Major
- Est. fire insurance / yr
- $963 – $1,789
Heat risk 9/10 · Severe
- Hot days now (above 108°F)
- 7 days/yr
- Hot days in 30 yrs
- 18 days/yr
Wind risk 8/10 · Major
- Chance of severe wind over 30 yrs
- 99.0%
Air-quality risk 3/10 · Minor
- Unhealthy air days now
- 4 days/yr
- Unhealthy air days in 30 yrs
- 4 days/yr
Risk factors via First Street. Map © Google.
Why this score? — see what drove the D- grade
The composite is a weighted blend of 9 inputs, each scored 0–100. Each bar is that input's sub-score; the figure is the points it added to the 100-point composite (weight × sub-score).
- ARV discount +11.1/15.0
- Appreciation +7.9/10.0
- Cash flow +6.0/30.0
- Schools +3.8/10.0
- Rent growth +2.5/5.0
- Livability +2.5/5.0
- Condition / age +2.5/5.0
- 1% rule +1.3/10.0
- DSCR +0.3/10.0
$183,000
🖨 Deal sheet 📄 Offer letter ✓ Due diligence
Listing remarks MLS
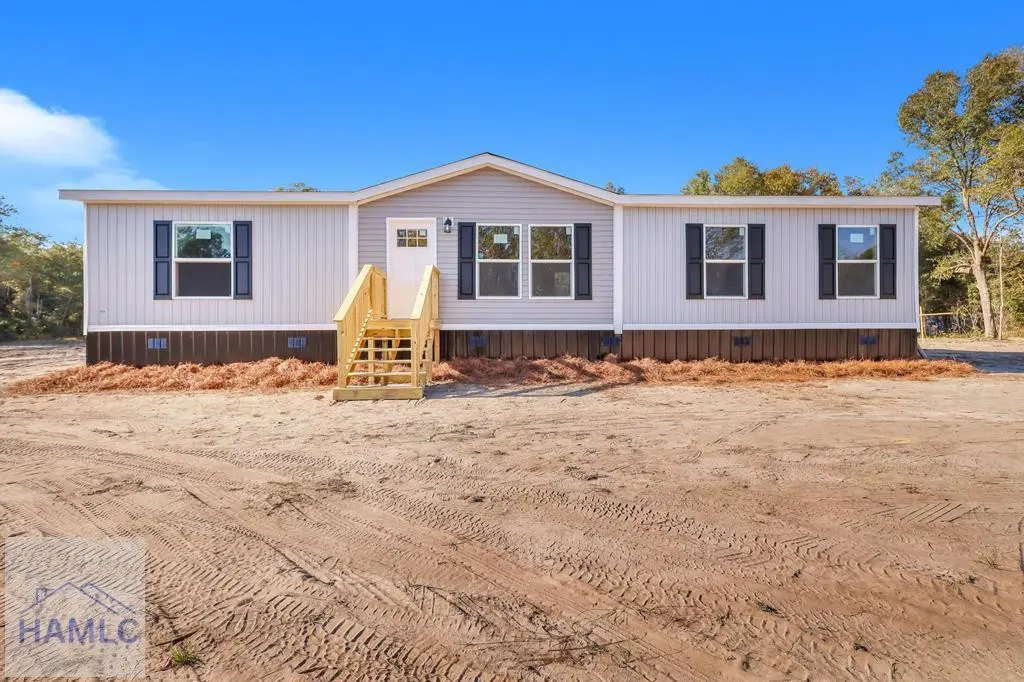
HOME IS LOCATED ON THE PROPERTY! EASY TO SHOW! Check out this 3 Bedroom, 2 Bath Home located on 1.1 acres in Hortense, Ga. Will qualify for FHA, VA, & USDA Financing.
Key facts
- 1.1 acre lot
- Built 2026
- Listed 58 days
Neighborhood map
What this means for you Summary
Snapshot
- This is a 3-bed/2.0-bath other listed at $183k.
Deal economics
- At list price, monthly cash flow is $-353 ($-4k/yr) — negative.
- To cash-flow at today's rent, offer at most $132k (27.9% below list).
- To meet the 1% rule (rent ≥ 1% of price), the offer needs to be $115k (36.9% below list).
- Recommended offer: $115k (36.9% below list) — sets the bar for 1% rule.
Location & tenants
- Location reads: area grade D — affects rentability + tenant quality, not the cash-flow math above.
- Brantley County (rural): math 48% / reading 43% proficiency, ranked #26 of 174 in GA (top 15%) — families likely to look elsewhere, expect single-tenant / working-renter base with shorter leases.
- Market conditions: 43 active listings in the ZIP; 49 units permitted in Brantley County in 2024 (0 in 5+ unit buildings).
Forward outlook
- In year one you build about $12k of equity ($1k loan paydown + $11k appreciation (5.9% local appreciation)).
- Brantley County population projected at -13% by 2050 — secular population decline; favor cash flow + early exit over multi-decade hold.
- By year 4, paydown + projected appreciation supports a ~$41k cash-out refi (75% LTV) — recoverable capital for the next deal without selling this one.
Negotiation context
- It's been on market 58 days — a 3% lower offer ($178k) is reasonable based on typical stale-listing flexibility.
- 2 sale attempts since 2y ago with the ask held roughly flat each time — persistent listings suggest the price (not the market) is what's stuck; bring a comps-based counter.
- Current owner paid $19k; list at $183k implies a 887% gain — meaningful room to come down on a strong offer.
Risks & watch-outs
- Climate carrying-cost: severe wind risk, 99% chance of damaging wind over 30y; major wildfire risk; extreme-heat days projected 7→18/yr by 2055 (HVAC capex compounding) — expect insurance premiums to compound above CPI over the hold.
Questions for the listing agent
- What do current leases actually rent for vs. the listed asking? Can we see a recent rent roll and the last 12 months of T-12 income?
- It's been on market 58 days. Have you received any prior offers? Is the seller open to a 37% concession, seller financing, or rate buy-down credit?
- Is there a deadline driving the sale (1031 exchange, divorce, estate, relocation)? That informs how much negotiation room exists.
- The area grade is low — what's the realistic commute time and amenity access for the typical tenant pool here? Any planned neighborhood developments (good or bad) we should know about?
- What's the average days-on-market for RENTAL listings here right now (not sales)? A rising rental-DOM trend means longer vacancies and softer asking-rent achievability than the comps imply.
- What's the recent tenant-quality profile in this submarket — average credit score on applications, eviction rate, late-payment / NSF rate, and stable-employment percentage? A property-management company in the area should have these aggregated.
- How much new for-sale + rental construction is in the pipeline within 1–3 miles? Heavy new supply typically softens prices + rents 12–24 months out; constrained supply supports both.
Investment metrics
- 1% rule
- 0.63% ✗
- Cap rate
- 3.98%
- Cash-on-cash
- -8.26%
- DSCR
- 0.63
- GRM
- 13.2
CMA / ARV
- ARV (median comp)
- $199,083
- List price
- $183,000
- Delta
- -8.08%
- Verdict
- FAIR
- Comps
- 6 within 1.0 mi
Projected returns pro-forma
5.9% appreciation · 3.0% rent growth · sell at horizon
- IRR
- 8.4%
- Equity multiple
- 1.57×
- Total profit
- $29,300
- Equity at exit
- $113,879
- IRR
- 10.1%
- Equity multiple
- 3.03×
- Total profit
- $104,097
- Equity at exit
- $205,517
Cash invested: $51,240 (down + closing). Projections, not guarantees.
Landlord ↔ Tenant lean methodology
- Overall (STATE)
- 90 Strongly Landlord-Friendly
- State Georgia
- 90 Strongly Landlord-Friendly · R+3
- County
- — inherits STATE
- City
- — inherits STATE
ZIP-level market 31543
- Home prices YoY
- 3.7%
- Active inventory
- 43
- Price-to-rent
- 13.2×
Monthly cashflow live
- Estimated rent
- $1,154 medium interval (Pro) →
- Mortgage (P&I)
- −$960
- Tax est. 1.5%
- −$229 /mo · $2,745/yr
- Insurance
- −$76
- HOA
- −$0
- Vacancy / Maint / Mgmt
- −$242
- Net cashflow
- $-353
Break-even live
UW: 25.0% down · 7.5% · 30yr · 1.5% tax · 5.0% vac · 8.0% maint · 8.0% mgmt
Financing live
Cash to close
- Down payment
- $45,750
- Closing costs
- $5,490
- Reserves months
- —
- Total cash needed
- —
Loan-product check · same deal, 3 products live
Conventional
25% down · 7.5% · 30yr
- Down + closing
- —
- Monthly P&I
- —
- Monthly cashflow
- —
- DSCR
- —
- Eligible?
- —
Personal DTI + credit; lowest rate.
DSCR
20% down · 8.5% · 30yr
- Down + closing
- —
- Monthly P&I
- —
- Monthly cashflow
- —
- DSCR
- —
- Eligible?
- —
No personal income docs; deal must DSCR.
Hard money
10% down · 12.0% · 12mo
- Down + closing
- —
- Monthly P&I
- —
- Monthly cashflow
- —
- DSCR
- —
- Eligible?
- —
Short-term bridge; refi at stabilization.
Listing history 24 events
-
2026-06-18days on market $183,000 Active 58 DOM
-
2026-06-17days on market $183,000 Active 57 DOM
-
2026-06-16days on market $183,000 Active 56 DOM
-
2026-06-15days on market $183,000 Active 55 DOM
-
2026-06-13days on market $183,000 Active 53 DOM
-
2026-06-12days on market $183,000 Active 52 DOM
-
2026-06-09days on market $183,000 Active 49 DOM
-
2026-06-09price $183,000 Active 48 DOM
-
2026-06-08days on market $185,000 Active 48 DOM
-
2026-06-07days on market $185,000 Active 47 DOM
-
2026-06-07days on market $185,000 Active 46 DOM
-
2026-06-04days on market $185,000 Active 43 DOM
-
2026-06-02days on market $185,000 Active 42 DOM
-
2026-06-01days on market $185,000 Active 41 DOM
-
2026-05-31days on market $185,000 Active 40 DOM
-
2026-05-31days on market $185,000 Active 39 DOM
-
2026-04-21$185,000 Active 171-char remark
Show marketing remark (171 chars)
HOME IS LOCATED ON THE PROPERTY! EASY TO SHOW! Check out this 3 Bedroom, 2 Bath Home located on 1.1 acres in Hortense, Ga. Will qualify for FHA, VA, & USDA Financing.
-
2025-12-03price $159,000
-
2025-06-27price $194,500
-
2025-05-21price $195,000
-
2025-04-21soldstatus $18,540 Closed
-
2025-04-03status Pending
-
2025-04-02price $23,000
-
2024-10-31$38,000 Active
ⓘ Source: listings_history table (triggers on properties + properties_extension) + one-shot
backfill from property_details.listing_events for pre-trigger history.
Climate risk First Street
- Flood 1/10 Low FEMA zone X (unshaded) · 0% chance over 30 yrs
- Wildfire 7/10 Severe
- Heat 9/10 Extreme 7 d/yr ≥108°F today · 18 d/yr by 30 yrs out
- Wind 8/10 Severe 99% chance of damaging wind over 30 yrs
- Air quality 3/10 Moderate 4 unhealthy d/yr today · 4 by 30 yrs out
Nearby sold comps map
Loading sold comps map…
Walkable amenities ~0.75 mi
Loading nearby amenities…
Taxation est. · year 1
- Rental income
- $13,853
- − Mortgage interest
- −$10,251
- − Property taxes
- −$2,745
- − Insurance
- −$915
- − Repairs & maintenance
- −$1,108
- − Management
- −$1,108
- − Depreciation
- −$5,324
- Taxable loss
- −$7,598
- Est. tax savings @ 24.0%
- +$1,823
- After-tax cash flow
- $-2,408/yr
For passive investors: Depreciation is non-cash, so a rental often shows a tax loss while cash-flowing — sheltering income. Rental losses are passive: they offset passive income freely, and up to $25,000/yr can offset ordinary (W-2) income if you actively participate and your MAGI is under $100k (phasing out to $0 by $150k); unused losses carry forward. On sale, claimed depreciation is recaptured at up to 25%, and gains may owe capital-gains tax (a 1031 exchange can defer both). Figures are a year-1 estimate at your 24.0% rate — not tax advice; consult a CPA.
Schools (NCES district)
- District
- Brantley County
- NCES district ID
- 1300480
- Math proficiency
- 48% ▼ -5.00%
- Reading proficiency
- 43% ▼ -4.00%
- Median HH income
- $37,053
- Composite
- 37.85/100
- National rank
- #4328
- State rank
- #26 of 174 in GA
Livability — Hortense
No livability data for this city. (Only ~50 U.S. cities are tracked.)
Census & demographics
- Population (ZIP)
- 4,914
Population outlook (Brantley County) Hauer SSP2
- Today (2025)
- 18,422 people
- By 2030
- 18,220 · -1.1%
- By 2040
- 17,441 · -5.3%
- By 2050
- 16,044 · -12.9%
- By 2075
- 11,707 · -36.5%
- By 2100
- 7,006 · -62.0%
Race, ethnicity, and origin ACS 2023
- Neighborhood character
- Predominantly White (91%)
- Race & ethnicity
- White 91% Black 5% Hispanic / Latino 3% Two or more races 2%
- Common ancestry
- Scotch-Irish 1% Romanian 1% Lithuanian 1%
- Foreign-born
- 3% · Canada
Political lean MEDSL · Brantley
- 2024 margin
- Solid R (+82.5) · D 8.7% · R 91.1%
- 2008→2024 swing
- -19.4pp toward R · 2008: -63.1pp · 2024: -82.5pp
- All cycles
- 2024: R+82.5 2020: R+81.2 2016: R+78.6 2012: R+67.0 2008: R+63.1
Not yet ingested
- Civics
- —
Market trends
- HPI YoY
- ▲ 5.90%
- Current HPI
- 167.0028
- Rent YoY
- —
- Metro
- —
- State GDP YoY
- ▲ 2.66%
- F500 in state
- 28
Industry mix (Fortune 500 HQ in GA)
| Industry | F500 HQs | Revenue |
|---|---|---|
| Paper / Packaging | 2 | $29B |
|
||
| Retail | 1 | $160B |
|
||
| Transportation / Logistics | 1 | $91B |
|
||
| Airlines | 1 | $62B |
|
||
| Consumer Goods | 1 | $47B |
|
||
| Utilities | 1 | $25B |
|
||
Price history
+386.8% since first listed8 events — show timeline
- 2026-04-21 Listed $185,000 HABR
- 2025-12-03 Price Changed $159,000 HABR
- 2025-06-27 Price Changed $194,500 HABR
- 2025-05-21 Price Changed $195,000 HABR
- 2025-04-21 Sold (MLS) $18,540 GIAR
- 2025-04-03 Pending — GIAR
- 2025-04-02 Price Changed $23,000 GIAR
- 2024-10-31 Listed $38,000 GIAR
Property tax history
-2.4%/yrLatest (2025): $214 · -2.0% YoY. Source: county tax records.
Cash-flow waterfall
monthlySold comps — $/sqft
last 12 mo · ≤1 miLoading sold comps…