96915 Mcgirts Creek Loop · Yulee, FL
Flood risk 5/10 · Moderate
- FEMA flood zone
- X (unshaded)
- Chance of flooding over 30 yrs
- 0.36%
- Est. flood insurance / yr
- $507 – $1,088
Fire risk 6/10 · Moderate
- Est. fire insurance / yr
- $947 – $1,759
Heat risk 9/10 · Severe
- Hot days now (above 106°F)
- 7 days/yr
- Hot days in 30 yrs
- 19 days/yr
Wind risk 9/10 · Severe
- Chance of severe wind over 30 yrs
- 99.0%
Air-quality risk 4/10 · Minor
- Unhealthy air days now
- 5 days/yr
- Unhealthy air days in 30 yrs
- 5 days/yr
Risk factors via First Street. Map © Google.
Why this score? — see what drove the D- grade
The composite is a weighted blend of 9 inputs, each scored 0–100. Each bar is that input's sub-score; the figure is the points it added to the 100-point composite (weight × sub-score).
- Appreciation +10.0/10.0
- ARV discount +7.5/15.0
- Schools +6.0/10.0
- Cash flow +5.5/30.0
- Livability +3.3/5.0
- Rent growth +3.2/5.0
- Condition / age +2.5/5.0
- 1% rule +0.1/10.0
- DSCR +0.0/10.0
$509,900
🖨 Deal sheet 📄 Offer letter ✓ Due diligence
Listing remarks
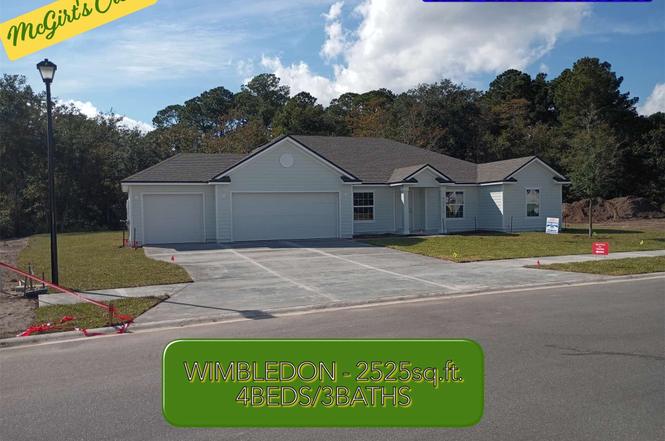
MOVE-IN READY - Our Wimbledon - 2525s. f. floor plan features an open living room seamlessly connected to a spacious Gourmet Kitchen, ideal for entertaining. This 4BR/3BA/3CG home includes a Master Suite with a walk-in shower as well as a walk-in closet. A covered porch extends the living area outdoors, while a separate guest bedroom with an adjoining bath ideal for guests during backyard parties/events. Our home sits on a 0.28-acre lot (12,212s. f. ), that backs to a preserve area.
Key facts
- Master suite
- Covered porch
- Open living room
Tags
Property features AI
Finance
- HOA & community: Homeowners association with annual fee of $850
Exterior
- Parking: Three-car garage; Garage door opener; Three or more parking spaces
- Utilities: Public water; Septic tank
- Home design: Single-story; Under construction; Preservation frontage; Residential zoning
- Construction: Frame construction; Shingle roof; Built by NEW ATLANTIC BUILDERS
- Exterior features: Sprinkler/irrigation system; Rear covered porch; Patio
Interior
- Kitchen: Dishwasher; Disposal; Microwave; Oven; Stove
- Bathrooms: 3 full bathrooms
- Heating & cooling: Central electric heating; Central electric cooling
- Interior features: Vinyl windows
Neighborhood map
What this means for you Summary
Snapshot
- This is a 4-bed/3.0-bath land listed at $510k.
Deal economics
- At list price, monthly cash flow is $-1k ($-13k/yr) — negative.
- To cash-flow at today's rent, offer at most $319k (37.5% below list).
- To meet the 1% rule (rent ≥ 1% of price), the offer needs to be $259k (49.2% below list).
- Recommended offer: $259k (49.2% below list) — sets the bar for 1% rule.
Location & tenants
- Location reads 66/100 on livability (#605 in FL) — a middle-class / working-renter tenant base. Strengths: housing A+, cost of living A-, crime B+; Watch: amenities F, commute F, health & safety F.
- Nassau (town): math 74% / reading 65% proficiency, ranked #4 of 73 in FL (top 6%) — acceptable for families but not a draw, mixed tenant base, ~2y average lease.
- Market conditions: Rents rising (+2.9%/yr); 596 active listings in the ZIP; 1 comparable units currently listed for rent nearby; solid renter incomes; 953 units permitted in Nassau County in 2024 (24 in 5+ unit buildings).
- This rent runs 33% of the median local income ($93k/yr) — at the standard rent-burdened threshold; future hikes will face affordability resistance.
Forward outlook
- In year one you build about $55k of equity ($4k loan paydown + $51k appreciation (10.0% local appreciation)).
- Nassau County population projected at +17% by 2050 — long-run rental-demand tailwind backs the buy-and-hold thesis.
- By year 2, paydown + projected appreciation supports a ~$88k cash-out refi (75% LTV) — recoverable capital for the next deal without selling this one.
Negotiation context
- It's been on market 161 days — a 12% lower offer ($449k) is reasonable based on typical stale-listing flexibility.
- 2 sale attempts; this cycle's ask has dropped $40k (7%) from the opening price — seller is motivated, your offer sets the floor, not the list.
Risks & watch-outs
- Climate carrying-cost: moderate flood risk; severe wind risk, 99% chance of damaging wind over 30y; major wildfire risk; extreme-heat days projected 7→19/yr by 2055 (HVAC capex compounding) — expect insurance premiums to compound above CPI over the hold.
Questions for the listing agent
- What do current leases actually rent for vs. the listed asking? Can we see a recent rent roll and the last 12 months of T-12 income?
- It's been on market 161 days. Have you received any prior offers? Is the seller open to a 49% concession, seller financing, or rate buy-down credit?
- What does the HOA fee cover, when was the last increase, and are there any pending special assessments or reserve-fund shortfalls?
- Why hasn't it sold? Are there any deal-killer items the seller is aware of (foundation, flood, title, zoning, code violations)?
- Is there a deadline driving the sale (1031 exchange, divorce, estate, relocation)? That informs how much negotiation room exists.
- Schools are B-rated — typically a magnet for longer-tenancy family renters. What's the average tenant stay here, and is there a school-zone premium baked into asking?
- The area grade is low — what's the realistic commute time and amenity access for the typical tenant pool here? Any planned neighborhood developments (good or bad) we should know about?
- What's the average days-on-market for RENTAL listings here right now (not sales)? A rising rental-DOM trend means longer vacancies and softer asking-rent achievability than the comps imply.
- What's the recent tenant-quality profile in this submarket — average credit score on applications, eviction rate, late-payment / NSF rate, and stable-employment percentage? A property-management company in the area should have these aggregated.
- How much new for-sale + rental construction is in the pipeline within 1–3 miles? Heavy new supply typically softens prices + rents 12–24 months out; constrained supply supports both.
Investment metrics
- 1% rule
- 0.51% ✗
- Cap rate
- 3.74%
- Cash-on-cash
- -9.10%
- DSCR
- 0.59
- GRM
- 16.4
CMA / ARV
No comps found within radius.
Projected returns pro-forma
10.0% appreciation · 2.88% rent growth · sell at horizon
- IRR
- 17.8%
- Equity multiple
- 2.46×
- Total profit
- $208,211
- Equity at exit
- $459,358
- IRR
- 16.7%
- Equity multiple
- 5.67×
- Total profit
- $666,358
- Equity at exit
- $990,624
Cash invested: $142,772 (down + closing). Projections, not guarantees.
Landlord ↔ Tenant lean methodology
- Overall (STATE)
- 87 Strongly Landlord-Friendly
- State Florida
- 87 Strongly Landlord-Friendly · R+3
- County
- — inherits STATE
- City
- — inherits STATE
ZIP-level market 32097
- Home prices YoY
- 19.5%
- Rents YoY
- 2.9%
- Active inventory
- 596
- Price-to-rent
- 16.4×
Monthly cashflow live
- Estimated rent
- $2,591 medium interval (Pro) →
- Mortgage (P&I)
- −$2,674
- Tax from tax record
- −$173 /mo · $2,072/yr
- Insurance
- −$212
- HOA
- −$71
- Vacancy / Maint / Mgmt
- −$544
- Net cashflow
- $-1,083
Break-even live
UW: 25.0% down · 7.5% · 30yr · 1.5% tax · 5.0% vac · 8.0% maint · 8.0% mgmt
Financing live
Cash to close
- Down payment
- $127,475
- Closing costs
- $15,297
- Reserves months
- —
- Total cash needed
- —
Loan-product check · same deal, 3 products live
Conventional
25% down · 7.5% · 30yr
- Down + closing
- —
- Monthly P&I
- —
- Monthly cashflow
- —
- DSCR
- —
- Eligible?
- —
Personal DTI + credit; lowest rate.
DSCR
20% down · 8.5% · 30yr
- Down + closing
- —
- Monthly P&I
- —
- Monthly cashflow
- —
- DSCR
- —
- Eligible?
- —
No personal income docs; deal must DSCR.
Hard money
10% down · 12.0% · 12mo
- Down + closing
- —
- Monthly P&I
- —
- Monthly cashflow
- —
- DSCR
- —
- Eligible?
- —
Short-term bridge; refi at stabilization.
Rent comps 1 comps
| Address | Beds | Baths | Sqft | Rent | $/sqft | DOM | Units | Dist |
|---|---|---|---|---|---|---|---|---|
| 84143 Swallowtail Dr Yulee, FL | 4.0 | 4.0 | 2875 | $2,500 | $0.87 | 7d | 1 | 0.48mi |
HOA detail
- Monthly dues
- $71 · $852/yr
Listing history 6 events
-
2026-04-02price $509,900
-
2026-03-20price $514,900
-
2026-02-19price $519,900
-
2026-01-18price $529,900
-
2025-12-11$549,900 Active
-
2025-08-29$549,900 Active
ⓘ Source: listings_history table (triggers on properties + properties_extension) + one-shot
backfill from property_details.listing_events for pre-trigger history.
Tax reassessment forecast FL · Resets to sale price
- Current annual tax
- $2,072 · $173/mo
- Projected year-2 tax
- $4,232 · $353/mo
- Expected delta
- +$2,160/yr (+$180/mo · 104.2%)
ⓘ Screening estimate from a state-policy table — verify with the county assessor before closing.
Climate risk First Street
- Flood 5/10 Major FEMA zone X (unshaded) · 36% chance over 30 yrs
- Wildfire 6/10 Major
- Heat 9/10 Extreme 7 d/yr ≥106°F today · 19 d/yr by 30 yrs out
- Wind 9/10 Extreme 99% chance of damaging wind over 30 yrs
- Air quality 4/10 Moderate 5 unhealthy d/yr today · 5 by 30 yrs out
Nearby sold comps map
Loading sold comps map…
Walkable amenities ~0.75 mi
Loading nearby amenities…
Taxation est. · year 1
- Rental income
- $31,095
- − Mortgage interest
- −$28,562
- − Property taxes
- −$2,072
- − Insurance
- −$2,550
- − Repairs & maintenance
- −$2,488
- − Management
- −$2,488
- − HOA
- −$852
- − Depreciation
- −$14,833
- Taxable loss
- −$22,750
- Est. tax savings @ 24.0%
- +$5,460
- After-tax cash flow
- $-7,536/yr
For passive investors: Depreciation is non-cash, so a rental often shows a tax loss while cash-flowing — sheltering income. Rental losses are passive: they offset passive income freely, and up to $25,000/yr can offset ordinary (W-2) income if you actively participate and your MAGI is under $100k (phasing out to $0 by $150k); unused losses carry forward. On sale, claimed depreciation is recaptured at up to 25%, and gains may owe capital-gains tax (a 1031 exchange can defer both). Figures are a year-1 estimate at your 24.0% rate — not tax advice; consult a CPA.
Schools (NCES district)
- District
- Nassau
- NCES district ID
- 1201350
- Math proficiency
- 74% ▼ -2.00%
- Reading proficiency
- 65% ▼ -2.00%
- Median HH income
- $58,267
- Composite
- 59.79/100
- National rank
- #899
- State rank
- #4 of 73 in FL
Livability — Yulee
- Score
- 66/100
- State rank
- #605
- US rank
- #11615
Category grades
Schools grade is shown separately in the Schools card above.
Census & demographics
- Census place
- Yulee, FL
- County
- Nassau County · 67,729 people
- City population
- 26,700
- Metro
- Jacksonville, FL
- Population (ZIP)
- 26,700
- Household income
- $93,161
- Rent vs Own
- Severe rent burden
- 404.0
Population outlook (Nassau County) Hauer SSP2
- Today (2025)
- 88,419 people
- By 2030
- 92,679 · +4.8%
- By 2040
- 99,257 · +12.3%
- By 2050
- 103,378 · +16.9%
- By 2075
- 109,726 · +24.1%
- By 2100
- 107,006 · +21.0%
Race, ethnicity, and origin ACS 2023
- Neighborhood character
- Predominantly White (75%)
- Race & ethnicity
- White 75% Two or more races 9% Black 9% Hispanic / Latino 8% Asian 1% Native American 1%
- Hispanic origin (detail)
- Mexican 2% Puerto Rican 2%
- Common ancestry
- Lithuanian 4% Italian 3% Romanian 2%
- Foreign-born
- 4% · Canada, Vietnam
- Languages at home
- 93% English-only · Spanish 5% Vietnamese 1%
Political lean MEDSL · Nassau
- 2024 margin
- Solid R (+46.9) · D 26.1% · R 73.1%
- 2008→2024 swing
- -3.1pp toward R · 2008: -43.8pp · 2024: -46.9pp
- All cycles
- 2024: R+46.9 2020: R+45.9 2016: R+50.2 2012: R+48.6 2008: R+43.8
Not yet ingested
- Civics
- —
Market trends
- HPI YoY
- ▲ 49.35%
- Current HPI
- 301.9299
- Rent YoY
- ▲ 2.88%
- Metro
- Jacksonville, FL
- State GDP YoY
- ▲ 3.28%
- F500 in state
- 36
Industry mix (Fortune 500 HQ in FL)
| Industry | F500 HQs | Revenue |
|---|---|---|
| Industrial Technology | 2 | $29B |
|
||
| Insurance | 2 | $17B |
|
||
| Retail | 1 | $60B |
|
||
| Technology Distribution | 1 | $58B |
|
||
| Homebuilding | 1 | $35B |
|
||
| Technology Manufacturing | 1 | $35B |
|
||
Price history
-7.3% since first listed6 events — show timeline
- 2026-04-02 Price Changed $509,900 AINCAR
- 2026-03-20 Price Changed $514,900 AINCAR
- 2026-02-19 Price Changed $519,900 AINCAR
- 2026-01-18 Price Changed $529,900 AINCAR
- 2025-12-11 Listed $549,900 AINCAR
- 2025-08-29 Listed $549,900 AINCAR
Property tax history
+357.3%/yrLatest (2025): $2,072 · +357.3% YoY. Source: county tax records.
Cash-flow waterfall
monthlySold comps — $/sqft
last 12 mo · ≤1 miLoading sold comps…