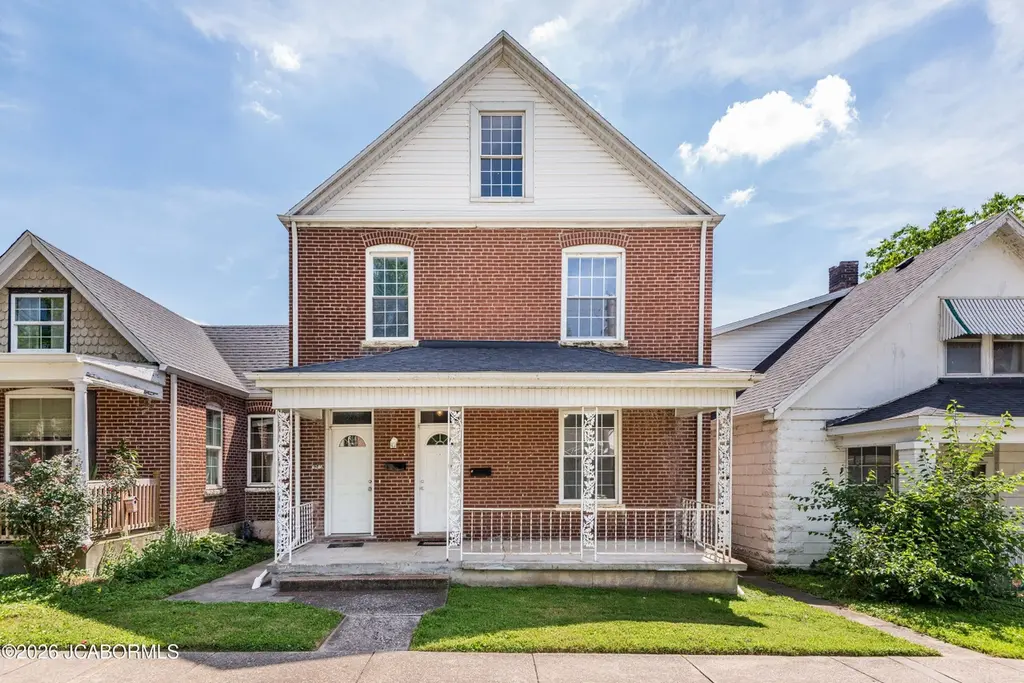
 Duplex
624 School St · Jefferson City, MO
Flood risk 9/10 · Severe
- FEMA flood zone
- AE
- Chance of flooding over 30 yrs
- 0.99%
- Est. flood insurance / yr
- $2,026 – $9,024
Fire risk 1/10 · Minimal
- Est. fire insurance / yr
- $1,054 – $1,958
Heat risk 4/10 · Minor
- Hot days now (above 106°F)
- 7 days/yr
- Hot days in 30 yrs
- 19 days/yr
Wind risk 2/10 · Minimal
- Chance of severe wind over 30 yrs
- —
Air-quality risk 2/10 · Minimal
- Unhealthy air days now
- 0 days/yr
- Unhealthy air days in 30 yrs
- 1 days/yr
Risk factors via First Street. Map © Google.
Why this score? — see what drove the F grade
The composite is a weighted blend of 9 inputs, each scored 0–100. Each bar is that input's sub-score; the figure is the points it added to the 100-point composite (weight × sub-score).
- ARV discount +7.5/15.0
- Cash flow +7.3/30.0
- Livability +4.2/5.0
- Schools +3.5/10.0
- Rent growth +2.5/5.0
- Condition / age +2.5/5.0
- DSCR +1.4/10.0
- 1% rule +0.7/10.0
- Appreciation +0.0/10.0
$185,000
🖨 Deal sheet 📄 Offer letter ✓ Due diligence
Multi-family units
County records classify this as Multi-Family (5+ Unit). Listing-text estimate: 2 units. estimate disagrees with records
5+ unit building — per-unit beds/baths from public records are typically unavailable; the breakdown below (if shown) is an estimate from the listing text.
Listing remarks MLS
4 side brick duplex in Jefferson City. Lower unit is a 1 bedroom, 1 bath and leases for $450. Upstairs unit is a 2 bedroom, 1 bath and is leased for $500. Upstairs unit has the possibility of adding an additional bedroom and bathroom on third floor. Plumbing for the bathroom is ran upstairs. Laundry hookups in both units. Tenants pay electric, gas, and trash. Landlord pays water, sewer, insurance, taxes, and grounds care. Many updates have been done and property has been well maintained. Property is located in the flood zone.
Key facts
- Well maintained
- 4 side brick duplex
- 3,484 sq ft lot
Tags
Property features AI
Finance
- Financial info: Actual rent example: $850 for a 2-bedroom unit
Exterior
- Parking: Open parking; On-street parking; Other parking
- Utilities: Public water; Public sewer
- Home design: Residential income property
- Construction: Brick construction
- Exterior features: Brick exterior; Zoned RA-2
Interior
- Bedrooms: Two 2-bedroom units; One 1-bedroom unit
- Flooring: Wood
- Bathrooms: Two full bathrooms
- Heating & cooling: Central air conditioning; Forced air heating (natural gas)
- Interior features: Wood flooring; Interior-entry basement; Updated/remodeled condition
Neighborhood map
What this means for you Summary
Snapshot
- This is a 1×1bd/1ba + 1×2bd/1ba units multifamily listed at $185k.
Deal economics
- At list price, monthly cash flow is $-711 ($-9k/yr) — negative. Per door: $-355/mo.
- To cash-flow at today's rent, offer at most $59k (67.8% below list).
- To meet the 1% rule (rent ≥ 1% of price), the offer needs to be $105k (43.2% below list).
- Recommended offer: $59k (67.8% below list) — sets the bar for cash-flow.
- Cap rate 4.7% vs local median 3.7% in Jefferson City — meaningfully above typical; check what's discounted (condition, days-on-market, listing class) to confirm the premium yield is real.
Location & tenants
- Location reads 83/100 on livability (#7 in MO, #838 nationally) — a professional / high-income tenant draw. Strengths: cost of living A+, housing A+, health & safety A+; Watch: crime C-.
- Jefferson City (urban): math 34% / reading 48% proficiency, ranked #121 of 324 in MO (top 37%) — families likely to look elsewhere, expect single-tenant / working-renter base with shorter leases.
- Market conditions: 189 active listings in the ZIP; 173 units permitted in Cole County in 2024 (0 in 5+ unit buildings).
Forward outlook
- Local home prices are declining (-3.0%/yr); year-one equity from $1k of loan paydown is wiped out by about $6k of value loss. Plan a longer hold.
- Cole County population projected to shrink 5% by 2050 — rents likely to lag national; underwrite the cash flow, not the appreciation.
Negotiation context
- It's been on market 16 days — a 2% lower offer ($182k) is reasonable based on typical stale-listing flexibility.
- 4 sale attempts since 10y ago with the ask held roughly flat each time — persistent listings suggest the price (not the market) is what's stuck; bring a comps-based counter.
Risks & watch-outs
- Watch-outs: flood insurance adds $460/mo; built in 1910 — expect roof / HVAC / electrical / plumbing capex.
- Climate carrying-cost: in FEMA flood zone AE (mandatory federal flood insurance) — expect insurance premiums to compound above CPI over the hold.
Questions for the listing agent
- What do current leases actually rent for vs. the listed asking? Can we see a recent rent roll and the last 12 months of T-12 income?
- Can we see the unit-by-unit rent roll, current vacancy, and any below-market leases? What's the average tenancy length?
- What capital expenditures (roof, boiler, parking lot, exteriors) have been made in the last 5 years, and what's planned in the next 2?
- Built in 1910 — when were the roof, HVAC, electrical panel, plumbing, and water heater last replaced?
- What's the actual annual flood-insurance premium (NFIP or private), and is the property in a SFHA with mandatory coverage?
- Is there a deadline driving the sale (1031 exchange, divorce, estate, relocation)? That informs how much negotiation room exists.
- Schools are B-rated — typically a magnet for longer-tenancy family renters. What's the average tenant stay here, and is there a school-zone premium baked into asking?
- The area grade is low — what's the realistic commute time and amenity access for the typical tenant pool here? Any planned neighborhood developments (good or bad) we should know about?
- What's the average days-on-market for RENTAL listings here right now (not sales)? A rising rental-DOM trend means longer vacancies and softer asking-rent achievability than the comps imply.
- What's the recent tenant-quality profile in this submarket — average credit score on applications, eviction rate, late-payment / NSF rate, and stable-employment percentage? A property-management company in the area should have these aggregated.
- How much new apartment / multifamily construction is in the pipeline within 1–3 miles? Heavy new supply (>2% of stock underway) typically softens rents 12–24 months out; light construction supports rent growth.
Investment metrics
- 1% rule
- 0.57% ✗
- Cap rate
- 4.67%
- Cash-on-cash
- -5.79%
- DSCR
- 0.74
- GRM
- 14.7
CMA / ARV
No comps found within radius.
Projected returns pro-forma
-3.0% appreciation · 3.0% rent growth · sell at horizon
- IRR
- -48.4%
- Equity multiple
- -0.45×
- Total profit
- $-75,056
- Equity at exit
- $27,584
- IRR
- -92.3%
- Equity multiple
- -1.37×
- Total profit
- $-122,913
- Equity at exit
- $15,995
Cash invested: $51,800 (down + closing). Projections, not guarantees.
Landlord ↔ Tenant lean methodology
- Overall (STATE)
- 81 Strongly Landlord-Friendly
- State Missouri
- 81 Strongly Landlord-Friendly · R+10
- County
- — inherits STATE
- City
- — inherits STATE
ZIP-level market 65101
- Home prices YoY
- -29.1%
- Active inventory
- 189
- Price-to-rent
- 29.4×
Monthly cashflow live
- Estimated rent
- $1,050 medium interval (Pro) →
- Mortgage (P&I)
- −$970
- Tax from tax record
- −$32 /mo · $389/yr
- Insurance
- −$77
- Flood insurance flood zone
- −$460 /mo · $5,525/yr
- HOA
- −$0
- Vacancy / Maint / Mgmt
- −$220
- Net cashflow
- $-711
Break-even live
2-unit breakdown (identical units grouped — click to expand)
| Units | Beds | Baths | Est. rent |
|---|---|---|---|
| 1× unit | 1 | 1 | $525 |
| 1× unit | 2 | 1 | $525 |
| Total (2 units) | $1,050 | ||
UW: 25.0% down · 7.5% · 30yr · 1.5% tax · 5.0% vac · 8.0% maint · 8.0% mgmt
Financing live
Cash to close
- Down payment
- $46,250
- Closing costs
- $5,550
- Reserves months
- —
- Total cash needed
- —
Loan-product check · same deal, 3 products live
Conventional
25% down · 7.5% · 30yr
- Down + closing
- —
- Monthly P&I
- —
- Monthly cashflow
- —
- DSCR
- —
- Eligible?
- —
Personal DTI + credit; lowest rate.
DSCR
20% down · 8.5% · 30yr
- Down + closing
- —
- Monthly P&I
- —
- Monthly cashflow
- —
- DSCR
- —
- Eligible?
- —
No personal income docs; deal must DSCR.
Hard money
10% down · 12.0% · 12mo
- Down + closing
- —
- Monthly P&I
- —
- Monthly cashflow
- —
- DSCR
- —
- Eligible?
- —
Short-term bridge; refi at stabilization.
Listing history 13 events
-
2026-06-19days on market $185,000 Active 16 DOM
-
2026-06-18days on market $185,000 Active 15 DOM
-
2026-06-17days on market $185,000 Active 14 DOM
-
2026-06-16days on market $185,000 Active 13 DOM
-
2026-06-15days on market $185,000 Active 12 DOM
-
2026-06-14days on market $185,000 Active 10 DOM
-
2026-06-13days on market $185,000 Active 9 DOM
-
2026-06-10days on market $185,000 Active 7 DOM
-
2026-06-09days on market $185,000 Active 6 DOM
-
2026-06-08days on market $185,000 Active 5 DOM
-
2026-06-07days on market $185,000 Active 4 DOM
-
2026-06-03remarks 699-char remark
-
2026-06-03$185,000 Active 1 DOM
ⓘ Source: listings_history table (triggers on properties + properties_extension) + one-shot
backfill from property_details.listing_events for pre-trigger history.
Tax reassessment forecast MO · Resets to sale price
- Current annual tax
- $389 · $32/mo
- Projected year-2 tax
- $1,794 · $150/mo
- Expected delta
- +$1,406/yr (+$117/mo · 361.8%)
ⓘ Screening estimate from a state-policy table — verify with the county assessor before closing.
Climate risk First Street
- Flood 9/10 Extreme FEMA zone AE · 99% chance over 30 yrs
- Wildfire 1/10 Low
- Heat 4/10 Moderate 7 d/yr ≥106°F today · 19 d/yr by 30 yrs out
- Wind 2/10 Low
- Air quality 2/10 Low 0 unhealthy d/yr today · 1 by 30 yrs out
Nearby sold comps map
Loading sold comps map…
Walkable amenities ~0.75 mi
Loading nearby amenities…
Taxation est. · year 1
- Rental income
- $12,600
- − Mortgage interest
- −$10,363
- − Property taxes
- −$389
- − Insurance
- −$6,450
- − Repairs & maintenance
- −$1,008
- − Management
- −$1,008
- − Depreciation
- −$5,382
- Taxable loss
- −$11,999
- Est. tax savings @ 24.0%
- +$2,880
- After-tax cash flow
- $-5,647/yr
For passive investors: Depreciation is non-cash, so a rental often shows a tax loss while cash-flowing — sheltering income. Rental losses are passive: they offset passive income freely, and up to $25,000/yr can offset ordinary (W-2) income if you actively participate and your MAGI is under $100k (phasing out to $0 by $150k); unused losses carry forward. On sale, claimed depreciation is recaptured at up to 25%, and gains may owe capital-gains tax (a 1031 exchange can defer both). Figures are a year-1 estimate at your 24.0% rate — not tax advice; consult a CPA.
Schools (NCES district)
- District
- Jefferson City
- NCES district ID
- 2916190
- Math proficiency
- 34% ▼ -1.00%
- Reading proficiency
- 48% ▲ 5.00%
- Median HH income
- $51,903
- Composite
- 35.45/100
- National rank
- #4930
- State rank
- #121 of 324 in MO
Livability — Jefferson City
- Score
- 83/100
- State rank
- #7
- US rank
- #838
Category grades
Schools grade is shown separately in the Schools card above.
Census & demographics
- Census place
- Jefferson City, MO
- City population
- 41,145
- Population (ZIP)
- 29,777
Population outlook (Cole County) Hauer SSP2
- Today (2025)
- 78,107 people
- By 2030
- 78,089 · +-0.0%
- By 2040
- 76,814 · -1.7%
- By 2050
- 74,515 · -4.6%
- By 2075
- 67,687 · -13.3%
- By 2100
- 55,023 · -29.6%
Race, ethnicity, and origin ACS 2023
- Neighborhood character
- Predominantly White (73%)
- Race & ethnicity
- White 73% Black 19% Two or more races 5% Hispanic / Latino 3%
- Common ancestry
- Slovak 2% Lithuanian 2% Italian 1%
- Foreign-born
- 3% · Canada
- Languages at home
- 96% English-only · Spanish 2%
Political lean MEDSL · Cole
- 2024 margin
- Solid R (+34.4) · D 32.1% · R 66.5% · Other 1.4%
- 2008→2024 swing
- -7.5pp toward R · 2008: -26.9pp · 2024: -34.4pp
- All cycles
- 2024: R+34.4 2020: R+33.9 2016: R+36.8 2012: R+33.7 2008: R+26.9
Not yet ingested
- Civics
- —
Market trends
- HPI YoY
- ▼ -86.16%
- Current HPI
- 209.3832
- Rent YoY
- —
- Metro
- —
- State GDP YoY
- ▲ 1.84%
- F500 in state
- 20
Industry mix (Fortune 500 HQ in MO)
| Industry | F500 HQs | Revenue |
|---|---|---|
| Healthcare | 1 | $163B |
|
||
| Insurance | 1 | $21B |
|
||
| Industrial Technology | 1 | $17B |
|
||
| Retail | 1 | $16B |
|
||
| Industrial Distribution | 1 | $10B |
|
||
| Utilities | 1 | $9B |
|
||
Price history
+363.7% since first listed10 events — show timeline
- 2026-06-03 Listed $185,000 JCMLS
- 2022-12-05 Sold (Public Records) — Public Records
- 2022-12-01 Sold (MLS) — JCMLS
- 2022-11-11 Pending — JCMLS
- 2022-10-31 Price Changed $105,000 JCMLS
- 2022-10-24 Relisted — JCMLS
- 2022-10-03 Pending — JCMLS
- 2022-08-25 Listed $119,900 JCMLS
- 2017-01-11 Sold (MLS) — JCMLS
- 2016-12-13 Listed $39,900 JCMLS
Property tax history
-2.5%/yrLatest (2025): $389 · +5.1% YoY. Source: county tax records.
Cash-flow waterfall
monthlySold comps — $/sqft
last 12 mo · ≤1 miLoading sold comps…