98 Mongaup Rd · Mongaup Valley, NY
Flood risk 1/10 · Minimal
- FEMA flood zone
- X (unshaded)
- Chance of flooding over 30 yrs
- 0.0%
- Est. flood insurance / yr
- $507 – $1,088
Fire risk 3/10 · Minor
- Est. fire insurance / yr
- $691 – $1,283
Heat risk 2/10 · Minimal
- Hot days now (above 91°F)
- 7 days/yr
- Hot days in 30 yrs
- 14 days/yr
Wind risk 2/10 · Minimal
- Chance of severe wind over 30 yrs
- 4.0%
Air-quality risk 2/10 · Minimal
- Unhealthy air days now
- 1 days/yr
- Unhealthy air days in 30 yrs
- 1 days/yr
Risk factors via First Street. Map © Google.
Why this score? — see what drove the B grade
The composite is a weighted blend of 9 inputs, each scored 0–100. Each bar is that input's sub-score; the figure is the points it added to the 100-point composite (weight × sub-score).
- Cash flow +28.9/30.0
- DSCR +10.0/10.0
- Appreciation +10.0/10.0
- 1% rule +8.0/10.0
- ARV discount +7.5/15.0
- Rent growth +2.5/5.0
- Schools +2.5/10.0
- Livability +2.5/5.0
- Condition / age +2.5/5.0
$119,000
🖨 Deal sheet (PDF) 📄 Offer letter ✓ Due diligence
Listing remarks MLS
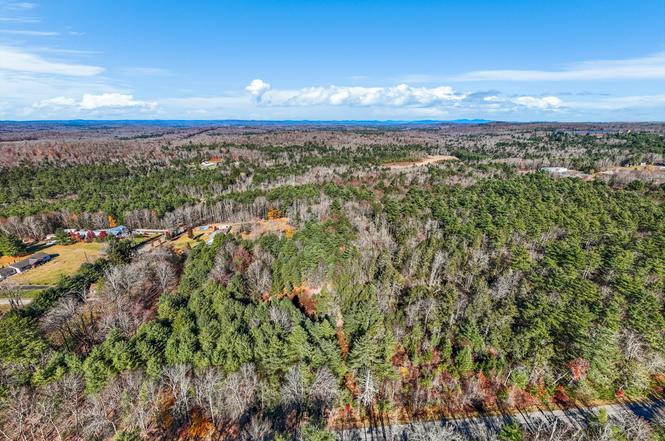
Sackett Lake Paradise Awaits! Nestled in the heart of Monticello, New York, lies this stunning 2.14-acre property on picturesque Sackett Lake. Offering breathtaking, serene surroundings, this tranquil retreat is perfect for nature lovers, outdoor enthusiasts, and those seeking a peaceful escape. Property Highlights: - Over two-acre property with abundant natural beauty. - Prime location on Sackett Lake. - Serene and private setting, ideal for relaxation and recreation. - Proximity to Monticello's amenities, including shopping, dining, and entertainment - Endless opportunities for outdoor activities, such as boating and hiking. - Walking distance to launch a boat in Sackett Lake. - Existing plans for a large home are ready to be built on this beautiful oasis. Build Your Dream Home or Escape! This exceptional property presents a unique opportunity to build your dream home or weekend getaway or invest in a lucrative rental property. With its picturesque setting and abundant natural beauty, this Sackett Lake property will surely captivate and inspire. Schedule a viewing and make your dreams a reality!
Key facts
- 2.14-acre property
- 2.14 acre lot
- Listed 45 days
Tags
Property features AI
Exterior
- Parking: Attached garage; Three garage spaces; No carport
- Utilities: Septic tank; Utilities: See remarks
- Home design: Single family residence
- Construction: Frame construction
- Exterior features: Private pool; Frame construction; Not waterfront
Interior
- Kitchen: Stainless steel appliances
- Bathrooms: Five full bathrooms; One half bathroom
- Heating & cooling: Baseboard heating; Central air conditioning
- Interior features: Breakfast bar; Cathedral ceilings; Open floor plan; Open kitchen; Unfinished basement; Pull-down attic stairs; Fireplace
Neighborhood map
What this means for you Summary
Snapshot
- This is a land listed at $119k.
Deal economics
- At list price, monthly cash flow is $402 ($5k/yr) — positive.
- The deal already cash-flows at list — no discount required.
- Meets the 1% rule at list price ($2k rent vs $119k).
- Recommended offer: $115k (3.0% below list) — sets the bar for market timing.
- Cap rate 10.3% vs local median 1.9% in Mongaup Valley — top-decile yield for the area; either an underpriced asset or a hidden risk that comps aren't pricing in. Stress-test before assuming the spread holds.
Location & tenants
- Location reads: area grade B — affects rentability + tenant quality, not the cash-flow math above.
- Monticello Central School District (town): math 29% / reading 30% proficiency, ranked #577 of 590 in NY (top 98%) — low school quality limits family demand, transient renter base, plan for 1-2y turnover.
- Zoned schools: Kenneth L Rutherford School (math 12% / reading 20%, grade F, #2,020 of 2,108 statewide, top 96%, 492 students, 81% FRL); Robert J Kaiser Middle School (math 7% / reading 35%, grade F, #661 of 729 statewide, top 91%, 595 students, 66% FRL); Monticello High School (math 82% / reading 34%, grade C, #879 of 1,100 statewide, top 80%, 844 students, 63% FRL) — zoned schools average 70% FRL vs 50% district-wide (20 pts higher); higher-poverty schools than district average — tighter screening recommended.
- Market conditions: 188 active listings in the ZIP; 1 comparable units currently listed for rent nearby; 739 units permitted in Sullivan County in 2024 (5 in 5+ unit buildings).
- This rent runs 33% of the median local income ($57k/yr) — at the standard rent-burdened threshold; future hikes will face affordability resistance.
Forward outlook
- In year one you build about $13k of equity ($823 loan paydown + $12k appreciation (10.0% local appreciation)).
- Sullivan County population projected at -24% by 2050 — secular population decline; favor cash flow + early exit over multi-decade hold.
- At projected returns (10.0% appreciation + 3.0% rent growth), your $33k cash investment doubles in ~2 years — after that, you're playing with house money.
- By year 3, paydown + projected appreciation supports a ~$32k cash-out refi (75% LTV) — recoverable capital for the next deal without selling this one.
Negotiation context
- It's been on market 45 days — a 3% lower offer ($115k) is reasonable based on typical stale-listing flexibility.
- 6 sale attempts since 2y ago with the ask held roughly flat each time — persistent listings suggest the price (not the market) is what's stuck; bring a comps-based counter.
Questions for the listing agent
- It's been on market 45 days. Have you received any prior offers? Is the seller open to a 3% concession, seller financing, or rate buy-down credit?
- Is there a deadline driving the sale (1031 exchange, divorce, estate, relocation)? That informs how much negotiation room exists.
- What's the average days-on-market for RENTAL listings here right now (not sales)? A rising rental-DOM trend means longer vacancies and softer asking-rent achievability than the comps imply.
- What's the recent tenant-quality profile in this submarket — average credit score on applications, eviction rate, late-payment / NSF rate, and stable-employment percentage? A property-management company in the area should have these aggregated.
- How much new for-sale + rental construction is in the pipeline within 1–3 miles? Heavy new supply typically softens prices + rents 12–24 months out; constrained supply supports both.
Investment metrics
- 1% rule
- 1.30% ✓
- Cap rate
- 10.35%
- Cash-on-cash
- 14.48%
- DSCR
- 1.64
- GRM
- 6.4
CMA / ARV
No comps found within radius.
Projected returns pro-forma
10.0% appreciation · 3.0% rent growth · sell at horizon
- IRR
- 35.0%
- Equity multiple
- 3.71×
- Total profit
- $90,445
- Equity at exit
- $107,205
- IRR
- 30.1%
- Equity multiple
- 8.39×
- Total profit
- $246,252
- Equity at exit
- $231,191
Cash invested: $33,320 (down + closing). Projections, not guarantees.
Landlord ↔ Tenant lean methodology
- Overall (STATE)
- 15 Strongly Tenant-Friendly
- State New York
- 15 Strongly Tenant-Friendly · D+10
- County
- — inherits STATE
- City
- — inherits STATE
ZIP-level market 12701
- Home prices YoY
- 16.7%
- Active inventory
- 188
- Price-to-rent
- 6.4×
Monthly cashflow live
- Estimated rent
- $1,550 medium interval (Pro) →
- Mortgage (P&I)
- −$624
- Tax est. 1.5%
- −$149 /mo · $1,785/yr
- Insurance
- −$50
- HOA
- −$0
- Lot rent
- −$0
- Vacancy / Maint / Mgmt
- −$326
- Net cashflow
- $402
Break-even live
Sensitivity live
| Price | -10% $484 | -5% $443 | +0% $402 | +5% $361 | +10% $320 |
|---|---|---|---|---|---|
| Rent | -10% $280 | -5% $341 | +0% $402 | +5% $463 | +10% $525 |
| Rate | -1.0pp $462 | -0.5pp $432 | base $402 | +0.5pp $371 | +1.0pp $340 |
UW: 25.0% down · 7.5% · 30yr · 1.5% tax · 5.0% vac · 8.0% maint · 8.0% mgmt
Financing live
Cash to close
- Down payment
- $29,750
- Closing costs
- $3,570
- Reserves months
- —
- Total cash needed
- —
Loan-product check · same deal, 3 products live
Conventional
25% down · 7.5% · 30yr
- Down + closing
- —
- Monthly P&I
- —
- Monthly cashflow
- —
- DSCR
- —
- Eligible?
- —
Personal DTI + credit; lowest rate.
DSCR
20% down · 8.5% · 30yr
- Down + closing
- —
- Monthly P&I
- —
- Monthly cashflow
- —
- DSCR
- —
- Eligible?
- —
No personal income docs; deal must DSCR.
Hard money
10% down · 12.0% · 12mo
- Down + closing
- —
- Monthly P&I
- —
- Monthly cashflow
- —
- DSCR
- —
- Eligible?
- —
Short-term bridge; refi at stabilization.
Rent comps 1 comps
| Address | Beds | Baths | Sqft | Rent | $/sqft | DOM | Units | Dist |
|---|---|---|---|---|---|---|---|---|
| 443 Sackett Lake Rd Unit 16-3 Monticello, NY | 1.0 | 1.0 | 950 | $1,250 | $1.32 | 23d | 1 | 0.55mi |
Listing history 17 events
-
2026-06-22days on market $119,000 Active 45 DOM
-
2026-06-21days on market $119,000 Active 3 DOM
-
2026-06-19days on market $119,000 Active 1 DOM
-
2026-06-18days on market $119,000 Active 42 DOM
-
2026-06-17days on market $119,000 Active 41 DOM
-
2026-06-16days on market $119,000 Active 40 DOM
-
2026-06-15days on market $119,000 Active 39 DOM
-
2026-06-14days on market $119,000 Active 37 DOM
-
2026-06-10days on market $119,000 Active 34 DOM
-
2026-06-09days on market $119,000 Active 33 DOM
-
2026-06-08days on market $119,000 Active 32 DOM
-
2026-06-07days on market $119,000 Active 31 DOM
-
2026-06-03days on market $119,000 Active 27 DOM
-
2026-06-02days on market $119,000 Active 26 DOM
-
2026-06-01days on market $119,000 Active 25 DOM
-
2026-05-31days on market $119,000 Active 24 DOM
-
2026-05-31days on market $119,000 Active 23 DOM
ⓘ Source: listings_history table (triggers on properties + properties_extension) + one-shot
backfill from property_details.listing_events for pre-trigger history.
Climate risk First Street
- Flood 1/10 Low FEMA zone X (unshaded) · 0% chance over 30 yrs
- Wildfire 3/10 Moderate
- Heat 2/10 Low 7 d/yr ≥91°F today · 14 d/yr by 30 yrs out
- Wind 2/10 Low 4% chance of damaging wind over 30 yrs
- Air quality 2/10 Low 1 unhealthy d/yr today · 1 by 30 yrs out
Nearby sold comps map
Loading sold comps map…
Walkable amenities ~0.75 mi
Loading nearby amenities…
Taxation est. · year 1
- Rental income
- $18,600
- − Mortgage interest
- −$6,666
- − Property taxes
- −$1,785
- − Insurance
- −$595
- − Repairs & maintenance
- −$1,488
- − Management
- −$1,488
- − Depreciation
- −$3,462
- Taxable income
- $3,116
- Est. tax owed @ 24.0%
- −$748
- After-tax cash flow
- $4,077/yr
For passive investors: Depreciation is non-cash, so a rental often shows a tax loss while cash-flowing — sheltering income. Rental losses are passive: they offset passive income freely, and up to $25,000/yr can offset ordinary (W-2) income if you actively participate and your MAGI is under $100k (phasing out to $0 by $150k); unused losses carry forward. On sale, claimed depreciation is recaptured at up to 25%, and gains may owe capital-gains tax (a 1031 exchange can defer both). Figures are a year-1 estimate at your 24.0% rate — not tax advice; consult a CPA.
Schools (NCES district)
- District
- Monticello Central School District
- NCES district ID
- 3619740
- Math proficiency
- 29% ▼ -4.00%
- Reading proficiency
- 30% ▼ -2.00%
- Median HH income
- $44,696
- Composite
- 25.28/100
- National rank
- #7491
- State rank
- #577 of 590 in NY
Livability — Mongaup Valley
No livability data for this city. (Only ~50 U.S. cities are tracked.)
Census & demographics
- County
- Sullivan County · 12,197 people
- City population
- 453
- Metro
- nan
- Population (ZIP)
- 12,197
- Household income
- $57,222
- Rent vs Own
- Severe rent burden
- 814.0
Population outlook (Sullivan County) Hauer SSP2
- Today (2025)
- 68,974 people
- By 2030
- 65,609 · -4.9%
- By 2040
- 58,878 · -14.6%
- By 2050
- 52,500 · -23.9%
- By 2075
- 39,941 · -42.1%
- By 2100
- 28,880 · -58.1%
Race, ethnicity, and origin ACS 2023
- Neighborhood character
- Diverse neighborhood (Simpson 0.69)
- Race & ethnicity
- White 43% Hispanic / Latino 31% Black 15% Two or more races 15% Asian 5%
- Hispanic origin (detail)
- Mexican 1% Puerto Rican 19% Dominican 3%
- Common ancestry
- Scotch-Irish 3% Romanian 2% Iranian 1%
- Foreign-born
- 15% · Canada, China, Jamaica
- Languages at home
- 71% English-only · Spanish 20% Other Indo-European 3% Russian/Polish/Slavic 2%
Political lean MEDSL · Sullivan
- 2024 margin
- R (+16.7) · D 41.6% · R 58.4%
- 2008→2024 swing
- -26.2pp toward R · 2008: 9.5pp · 2024: -16.7pp
- All cycles
- 2024: R+16.7 2020: R+9.2 2016: R+13.7 2012: D+10.4 2008: D+9.5
Not yet ingested
- Civics
- —
Market trends
- HPI YoY
- ▲ 72.71%
- Current HPI
- 507.739
- Rent YoY
- —
- Metro
- nan
- State GDP YoY
- ▲ 2.60%
- F500 in state
- 92
Industry mix (Fortune 500 HQ in NY)
| Industry | F500 HQs | Revenue |
|---|---|---|
| Financial Services | 10 | $950B |
|
||
| Consumer Goods | 9 | $162B |
|
||
| Insurance | 4 | $225B |
|
||
| Telecommunications | 2 | $144B |
|
||
| Pharmaceuticals | 2 | $112B |
|
||
| Media / Entertainment | 2 | $69B |
|
||
Price history
-20.7% since first listed8 events — show timeline
- 2026-06-18 Listed $119,000 OneKey® MLS as Distributed by MLS Grid
- 2026-05-07 Listed $119,000 OneKey® MLS as Distributed by MLS Grid
- 2025-10-01 Listing Removed — OneKey® MLS as Distributed by MLS Grid
- 2025-03-28 Listed $139,000 OneKey® MLS as Distributed by MLS Grid
- 2024-12-19 Listing Removed — OneKey® MLS as Distributed by MLS Grid
- 2024-07-22 Relisted — OneKey® MLS as Distributed by MLS Grid
- 2024-07-09 Listed $150,000 OneKey® MLS as Distributed by MLS Grid
- 2024-02-18 Listed $150,000 OneKey® MLS as Distributed by MLS Grid
Cash-flow waterfall
monthlySold comps — $/sqft
last 12 mo · ≤1 miLoading sold comps…