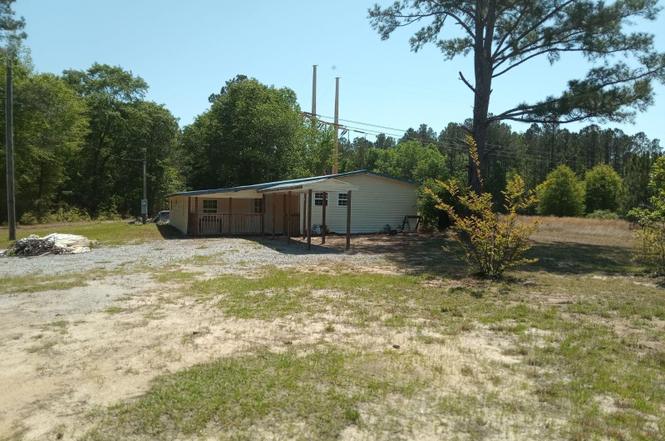
237 Charles Rd · Marion, SC
Flood risk 1/10 · Minimal
- FEMA flood zone
- X (unshaded)
- Chance of flooding over 30 yrs
- 0.0%
- Est. flood insurance / yr
- $507 – $1,088
Fire risk 6/10 · Moderate
- Est. fire insurance / yr
- $783 – $1,453
Heat risk 7/10 · Major
- Hot days now (above 109°F)
- 7 days/yr
- Hot days in 30 yrs
- 16 days/yr
Wind risk 8/10 · Major
- Chance of severe wind over 30 yrs
- 80.0%
Air-quality risk 2/10 · Minimal
- Unhealthy air days now
- 1 days/yr
- Unhealthy air days in 30 yrs
- 1 days/yr
Risk factors via First Street. Map © Google.
Why this score? — see what drove the D grade
The composite is a weighted blend of 9 inputs, each scored 0–100. Each bar is that input's sub-score; the figure is the points it added to the 100-point composite (weight × sub-score).
- Cash flow +16.2/30.0
- ARV discount +7.5/15.0
- DSCR +5.0/10.0
- 1% rule +3.3/10.0
- Livability +2.8/5.0
- Rent growth +2.5/5.0
- Condition / age +2.5/5.0
- Schools +1.3/10.0
- Appreciation +0.0/10.0
$129,900
🖨 Deal sheet 📄 Offer letter ✓ Due diligence
Listing remarks
SELLER FINANCING AVAILABLE! Located in Marion, SC, this 2-bedroom, 2-bathroom home has endless potential! Whether you're looking for an investment opportunity or a home to make your own, this property is waiting for your vision and TLC to bring it back to life and there is no HOA so you can truly make it your dream. The home features a spacious layout, an open living area, and a kitchen with plenty of cabinet space. While some updates have been started, additional work is needed to restore this home to its full potential. Sitting on a large lot, this property offers plenty of outdoor space for future enhancements. Conveniently located near local shops, dining, and downtown Marion, this home
Key facts
- Large lot
- Open living area
- No hoa
Tags
Property features AI
Finance
- HOA & community: Monthly association fee
Exterior
- Parking: Carport; 4 parking spaces (total)
- Home design: Single-story property; Resale property
- Exterior features: Front porch; 1 acre lot; Zoned residential
Interior
- Bedrooms: Bedroom on main level
- Bathrooms: 2 full bathrooms
- Interior features: Main level primary bedroom; Bedroom on main level; Unfurnished
Neighborhood map
What this means for you Summary
Snapshot
- This is a 2-bed/2.0-bath other listed at $130k.
Deal economics
- At list price, monthly cash flow is $68 ($815/yr) — positive.
- The deal already cash-flows at list — no discount required.
- To meet the 1% rule (rent ≥ 1% of price), the offer needs to be $107k (17.5% below list).
- Recommended offer: $107k (17.5% below list) — sets the bar for 1% rule.
- Cap rate 6.9% vs local median 3.3% in Marion — top-decile yield for the area; either an underpriced asset or a hidden risk that comps aren't pricing in. Stress-test before assuming the spread holds.
Location & tenants
- Location reads 55/100 on livability (#306 in SC) — a working-class tenant base; expect higher turnover. Strengths: cost of living A+, health & safety A+; Watch: schools F, crime F, amenities F.
- Marion 10 (town): math 9% / reading 23% proficiency, ranked #79 of 80 in SC (top 99%) — low school quality limits family demand, transient renter base, plan for 1-2y turnover; 79% free/reduced lunch — lower-income household profile, screen leases tightly.
- Market conditions: 122 active listings in the ZIP; 76 units permitted in Marion County in 2024 (0 in 5+ unit buildings).
Forward outlook
- Local home prices are declining (-3.0%/yr); year-one equity from $898 of loan paydown is wiped out by about $4k of value loss. Plan a longer hold.
- Marion County population projected at -26% by 2050 — secular population decline; favor cash flow + early exit over multi-decade hold.
Negotiation context
- It's been on market 155 days — a 12% lower offer ($114k) is reasonable based on typical stale-listing flexibility.
- 5 sale attempts with the ask held roughly flat each time — persistent listings suggest the price (not the market) is what's stuck; bring a comps-based counter.
Risks & watch-outs
- Climate carrying-cost: severe wind risk, 80% chance of damaging wind over 30y; major wildfire risk; extreme-heat days projected 7→16/yr by 2055 (HVAC capex compounding) — expect insurance premiums to compound above CPI over the hold.
Questions for the listing agent
- It's been on market 155 days. Have you received any prior offers? Is the seller open to a 17% concession, seller financing, or rate buy-down credit?
- Built in 1978 — when were the roof, HVAC, electrical panel, plumbing, and water heater last replaced?
- Why hasn't it sold? Are there any deal-killer items the seller is aware of (foundation, flood, title, zoning, code violations)?
- Is there a deadline driving the sale (1031 exchange, divorce, estate, relocation)? That informs how much negotiation room exists.
- Schools are F-rated, which usually means shorter tenancies and higher turnover. Who's the typical renter profile here, and what's been the actual vacancy rate?
- Crime grade is F in this area — have there been break-ins, vandalism, or insurance claims at this property in the last 3 years? What carrier currently insures it and at what premium?
- The area grade is low — what's the realistic commute time and amenity access for the typical tenant pool here? Any planned neighborhood developments (good or bad) we should know about?
- What's the average days-on-market for RENTAL listings here right now (not sales)? A rising rental-DOM trend means longer vacancies and softer asking-rent achievability than the comps imply.
- What's the recent tenant-quality profile in this submarket — average credit score on applications, eviction rate, late-payment / NSF rate, and stable-employment percentage? A property-management company in the area should have these aggregated.
- How much new for-sale + rental construction is in the pipeline within 1–3 miles? Heavy new supply typically softens prices + rents 12–24 months out; constrained supply supports both.
Investment metrics
- 1% rule
- 0.83% ✗
- Cap rate
- 6.92%
- Cash-on-cash
- 2.24%
- DSCR
- 1.10
- GRM
- 10.1
CMA / ARV
No comps found within radius.
Projected returns pro-forma
-3.0% appreciation · 3.0% rent growth · sell at horizon
- IRR
- -12.8%
- Equity multiple
- 0.54×
- Total profit
- $-16,779
- Equity at exit
- $19,369
- IRR
- -3.8%
- Equity multiple
- 0.75×
- Total profit
- $-9,270
- Equity at exit
- $11,231
Cash invested: $36,372 (down + closing). Projections, not guarantees.
Landlord ↔ Tenant lean methodology
- Overall (STATE)
- 90 Strongly Landlord-Friendly
- State South Carolina
- 90 Strongly Landlord-Friendly · R+6
- County
- — inherits STATE
- City
- — inherits STATE
ZIP-level market 29571
- Active inventory
- 122
- Price-to-rent
- 10.1×
Monthly cashflow live
- Estimated rent
- $1,072 medium interval (Pro) →
- Mortgage (P&I)
- −$681
- Tax from tax record
- −$43 /mo · $522/yr
- Insurance
- −$54
- HOA
- −$0
- Vacancy / Maint / Mgmt
- −$225
- Net cashflow
- $68
Break-even live
UW: 25.0% down · 7.5% · 30yr · 1.5% tax · 5.0% vac · 8.0% maint · 8.0% mgmt
Financing live
Cash to close
- Down payment
- $32,475
- Closing costs
- $3,897
- Reserves months
- —
- Total cash needed
- —
Loan-product check · same deal, 3 products live
Conventional
25% down · 7.5% · 30yr
- Down + closing
- —
- Monthly P&I
- —
- Monthly cashflow
- —
- DSCR
- —
- Eligible?
- —
Personal DTI + credit; lowest rate.
DSCR
20% down · 8.5% · 30yr
- Down + closing
- —
- Monthly P&I
- —
- Monthly cashflow
- —
- DSCR
- —
- Eligible?
- —
No personal income docs; deal must DSCR.
Hard money
10% down · 12.0% · 12mo
- Down + closing
- —
- Monthly P&I
- —
- Monthly cashflow
- —
- DSCR
- —
- Eligible?
- —
Short-term bridge; refi at stabilization.
Listing history 24 events
-
2026-06-18days on market $129,900 Active 155 DOM
-
2026-06-17days on market $129,900 Active 154 DOM
-
2026-06-16days on market $129,900 Active 153 DOM
-
2026-06-15days on market $129,900 Active 152 DOM
-
2026-06-14days on market $129,900 Active 150 DOM
-
2026-06-13days on market $129,900 Active 149 DOM
-
2026-06-10days on market $129,900 Active 147 DOM
-
2026-06-09days on market $129,900 Active 146 DOM
-
2026-06-08days on market $129,900 Active 145 DOM
-
2026-06-07days on market $129,900 Active 144 DOM
-
2026-06-05days on market $129,900 Active 141 DOM
-
2026-06-03days on market $129,900 Active 140 DOM
-
2026-06-02days on market $129,900 Active 139 DOM
-
2026-06-01days on market $129,900 Active 138 DOM
-
2026-05-31days on market $129,900 Active 137 DOM
-
2026-05-30days on market $129,900 Active 136 DOM
-
2026-03-25status Active
-
2026-02-24historical Active Under Contract
-
2026-01-12$129,900 Active
-
2025-05-12status Active
-
2025-04-30historical Active Under Contract
-
2025-04-16status Active
-
2025-03-17historical Active Under Contract
-
2025-03-07$74,900 Active
ⓘ Source: listings_history table (triggers on properties + properties_extension) + one-shot
backfill from property_details.listing_events for pre-trigger history.
Tax reassessment forecast SC · Resets to sale price
- Current annual tax
- $522 · $43/mo
- Projected year-2 tax
- $740 · $62/mo
- Expected delta
- +$219/yr (+$18/mo · 42.0%)
ⓘ Screening estimate from a state-policy table — verify with the county assessor before closing.
Climate risk First Street
- Flood 1/10 Low FEMA zone X (unshaded) · 0% chance over 30 yrs
- Wildfire 6/10 Major
- Heat 7/10 Severe 7 d/yr ≥109°F today · 16 d/yr by 30 yrs out
- Wind 8/10 Severe 80% chance of damaging wind over 30 yrs
- Air quality 2/10 Low 1 unhealthy d/yr today · 1 by 30 yrs out
Nearby sold comps map
Loading sold comps map…
Walkable amenities ~0.75 mi
Loading nearby amenities…
Taxation est. · year 1
- Rental income
- $12,862
- − Mortgage interest
- −$7,276
- − Property taxes
- −$522
- − Insurance
- −$650
- − Repairs & maintenance
- −$1,029
- − Management
- −$1,029
- − Depreciation
- −$3,779
- Taxable loss
- −$1,422
- Est. tax savings @ 24.0%
- +$341
- After-tax cash flow
- $1,157/yr
For passive investors: Depreciation is non-cash, so a rental often shows a tax loss while cash-flowing — sheltering income. Rental losses are passive: they offset passive income freely, and up to $25,000/yr can offset ordinary (W-2) income if you actively participate and your MAGI is under $100k (phasing out to $0 by $150k); unused losses carry forward. On sale, claimed depreciation is recaptured at up to 25%, and gains may owe capital-gains tax (a 1031 exchange can defer both). Figures are a year-1 estimate at your 24.0% rate — not tax advice; consult a CPA.
Schools (NCES district)
- District
- Marion 10
- NCES district ID
- 4503908
- Math proficiency
- 9% ▼ -9.00%
- Reading proficiency
- 23% ▲ 1.00%
- Median HH income
- $31,200
- Composite
- 12.75/100
- National rank
- #9600
- State rank
- #79 of 80 in SC
Livability — Marion
- Score
- 55/100
- State rank
- #306
- US rank
- #23400
Category grades
Schools grade is shown separately in the Schools card above.
Census & demographics
- Population (ZIP)
- 13,788
Population outlook (Marion County) Hauer SSP2
- Today (2025)
- 29,121 people
- By 2030
- 27,539 · -5.4%
- By 2040
- 24,391 · -16.2%
- By 2050
- 21,566 · -25.9%
- By 2075
- 15,537 · -46.6%
- By 2100
- 10,680 · -63.3%
Race, ethnicity, and origin ACS 2023
- Neighborhood character
- Majority Black (57%)
- Race & ethnicity
- Black 57% White 40% Hispanic / Latino 2%
- Common ancestry
- Serbian 1%
- Foreign-born
- 2% · Canada
- Languages at home
- 97% English-only · Spanish 2%
Political lean MEDSL · Marion
- 2024 margin
- D (+10.5) · D 54.6% · R 44.1% · Other 1.2%
- 2008→2024 swing
- -15.2pp toward R · 2008: 25.7pp · 2024: 10.5pp
- All cycles
- 2024: D+10.5 2020: D+21.5 2016: D+21.7 2012: D+29.8 2008: D+25.7
Not yet ingested
- Civics
- —
Market trends
- HPI YoY
- ▼ -90.98%
- Current HPI
- 125.5834
- Rent YoY
- —
- Metro
- —
- State GDP YoY
- ▲ 4.51%
- F500 in state
- 2
Industry mix (Fortune 500 HQ in SC)
| Industry | F500 HQs | Revenue |
|---|---|---|
| Packaging | 1 | $7B |
|
||
Price history
+73.4% since first listed8 events — show timeline
- 2026-03-25 Relisted — CCAR
- 2026-02-24 Contingent — CCAR
- 2026-01-12 Listed $129,900 CCAR
- 2025-05-12 Relisted — CCAR
- 2025-04-30 Contingent — CCAR
- 2025-04-16 Relisted — CCAR
- 2025-03-17 Contingent — CCAR
- 2025-03-07 Listed $74,900 CCAR
Property tax history
+4.5%/yrLatest (2025): $522 · +2.1% YoY. Source: county tax records.
Cash-flow waterfall
monthlySold comps — $/sqft
last 12 mo · ≤1 miLoading sold comps…