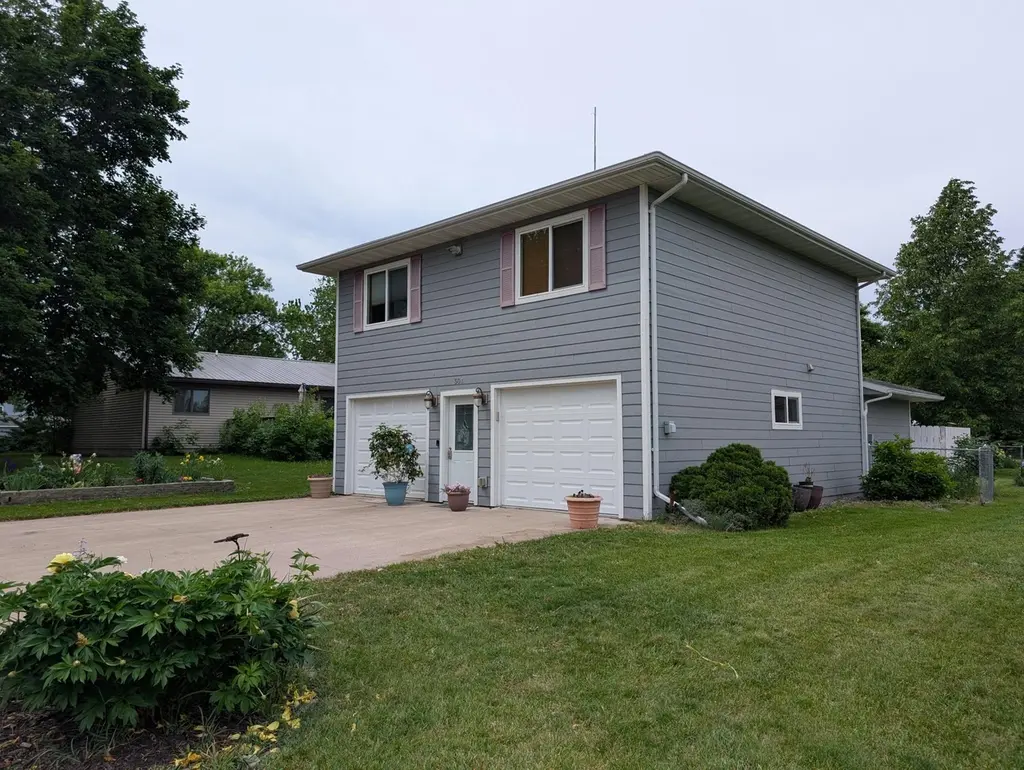
501 Prospect St · Milroy, MN
Flood risk 1/10 · Minimal
- FEMA flood zone
- X (unshaded)
- Chance of flooding over 30 yrs
- 0.0%
- Est. flood insurance / yr
- $473 – $860
Fire risk 1/10 · Minimal
- Est. fire insurance / yr
- $888 – $1,650
Heat risk 2/10 · Minimal
- Hot days now (above 98°F)
- 7 days/yr
- Hot days in 30 yrs
- 15 days/yr
Wind risk 2/10 · Minimal
- Chance of severe wind over 30 yrs
- —
Air-quality risk 1/10 · Minimal
- Unhealthy air days now
- 0 days/yr
- Unhealthy air days in 30 yrs
- 0 days/yr
Risk factors via First Street. Map © Google.
Why this score? — see what drove the D grade
The composite is a weighted blend of 9 inputs, each scored 0–100. Each bar is that input's sub-score; the figure is the points it added to the 100-point composite (weight × sub-score).
- Cash flow +10.5/30.0
- ARV discount +7.5/15.0
- Appreciation +5.0/10.0
- Schools +3.7/10.0
- Livability +3.4/5.0
- 1% rule +3.1/10.0
- DSCR +3.0/10.0
- Rent growth +2.5/5.0
- Condition / age +2.5/5.0
$144,000
🖨 Deal sheet (PDF) 📄 Offer letter ✓ Due diligence
Listing remarks MLS
2 bedroom 2 bathroom, 2 car garage, like new smart siding and shingles, excellent windows, 4 seasons room, Modern kitchen includes Oak cupboards with sliders and tile back splash, with patio door to the raised composite deck. Easy clean interior with hardwood and tile floors. like new home is a easy keeper with dual heat, (electric and propane) 4 seasons room or craft room could easily be a third bedroom. Spacious finished garages could be divided for more living space. (no basement) The spacious back yard has a patio area, garden area, new trees, and storage shed. If you are looking for a modest sized home in terrific condition, this is a must see!
Key facts
- 6,969 sq ft lot
- 2 garage spots
- Built 2000
Property features AI
Finance
- Financial info: Other annual assessment amount noted
Exterior
- Parking: Attached tuckunder garage with heated and insulated space; Concrete floor with floor drain and garage door opener; Two garage spaces
- Utilities: City water (connected); City sewer (connected); 200+ amp electric service; Propane and electric fuel
- Home design: Residential property; Split entry (bi-level) design; Two levels (main and upper)
- Construction: Frame construction; Asphalt roof (age 8 years or less); Block foundation
- Exterior features: Deck and patio; Wood exterior; Full wire fencing; Storage shed; Light tree coverage
Interior
- Kitchen: Eat-in kitchen / kitchen-dining area; Range; Refrigerator; Garbage disposal
- Bedrooms: Three bedrooms (rooms located on main and upper levels as noted)
- Flooring: Tile floors; Natural woodwork (wood trim/finish)
- Bathrooms: One full bath (upper level); One three-quarter bath (main floor)
- Heating & cooling: Forced air heating; Central air conditioning; Propane and electric fuel options; Fuel tank owned
- Interior features: Ceiling fan(s); Natural woodwork; Tile floors; Water softener (owned); Kitchen window; Washer/dryer hookup; Second-floor laundry; Main floor bedroom; Has basement (no finished basement features listed)
- Laundry & utility: Laundry closet; Washer; Dryer; Washer/dryer hookup
Neighborhood map
What this means for you Summary
Snapshot
- This is a 3-bed/2.0-bath single-family listed at $144k.
Deal economics
- At list price, monthly cash flow is $-73 ($-875/yr) — negative.
- To cash-flow at today's rent, offer at most $131k (8.9% below list).
- To meet the 1% rule (rent ≥ 1% of price), the offer needs to be $116k (19.2% below list).
- Recommended offer: $116k (19.2% below list) — sets the bar for 1% rule.
Location & tenants
- Location reads 67/100 on livability (#449 in MN) — a middle-class / working-renter tenant base. Strengths: cost of living A+, housing A+; Watch: crime D+, health & safety D+, amenities F.
- Milroy Public School District (rural): math 40% / reading 40% proficiency, ranked #352 of 467 in MN (top 75%) — families likely to look elsewhere, expect single-tenant / working-renter base with shorter leases.
- Zoned schools: Milroy Elementary (math 50% / reading 50%, grade D, #423 of 857 statewide, top 55%, 32 students, 50% FRL) — zoned schools average 50% FRL vs 27% district-wide (23 pts higher); higher-poverty schools than district average — tighter screening recommended.
- Market conditions: 7 active listings in the ZIP; 25 units permitted in Redwood County in 2024 (0 in 5+ unit buildings).
Forward outlook
- In year one you build about $5k of equity ($996 loan paydown + $4k appreciation (3.0% local appreciation)).
- Redwood County population projected at -16% by 2050 — secular population decline; favor cash flow + early exit over multi-decade hold.
- At projected returns (3.0% appreciation + 3.0% rent growth), your $40k cash investment doubles in ~7 years — after that, you're playing with house money.
- By year 7, paydown + projected appreciation supports a ~$34k cash-out refi (75% LTV) — recoverable capital for the next deal without selling this one.
Negotiation context
- Only 10 days on market — expect competitive offers; lowballing is unlikely to land.
- Current owner paid $82k; list at $144k implies a 76% gain — meaningful room to come down on a strong offer.
Questions for the listing agent
- What do current leases actually rent for vs. the listed asking? Can we see a recent rent roll and the last 12 months of T-12 income?
- Is there a deadline driving the sale (1031 exchange, divorce, estate, relocation)? That informs how much negotiation room exists.
- Crime grade is D in this area — have there been break-ins, vandalism, or insurance claims at this property in the last 3 years? What carrier currently insures it and at what premium?
- The area grade is low — what's the realistic commute time and amenity access for the typical tenant pool here? Any planned neighborhood developments (good or bad) we should know about?
- What's the average days-on-market for RENTAL listings here right now (not sales)? A rising rental-DOM trend means longer vacancies and softer asking-rent achievability than the comps imply.
- What's the recent tenant-quality profile in this submarket — average credit score on applications, eviction rate, late-payment / NSF rate, and stable-employment percentage? A property-management company in the area should have these aggregated.
- How much new for-sale + rental construction is in the pipeline within 1–3 miles? Heavy new supply typically softens prices + rents 12–24 months out; constrained supply supports both.
Investment metrics
- 1% rule
- 0.81% ✗
- Cap rate
- 5.69%
- Cash-on-cash
- -2.17%
- DSCR
- 0.90
- GRM
- 10.3
CMA / ARV
No comps found within radius.
Projected returns pro-forma
3.0% appreciation · 3.0% rent growth · sell at horizon
- IRR
- 5.5%
- Equity multiple
- 1.32×
- Total profit
- $12,717
- Equity at exit
- $64,749
- IRR
- 8.5%
- Equity multiple
- 2.29×
- Total profit
- $51,827
- Equity at exit
- $99,785
Cash invested: $40,320 (down + closing). Projections, not guarantees.
Landlord ↔ Tenant lean methodology
- Overall (STATE)
- 46 Balanced
- State Minnesota
- 46 Balanced · D+2
- County
- — inherits STATE
- City
- — inherits STATE
ZIP-level market 56263
- Active inventory
- 7
- Price-to-rent
- 10.3×
Monthly cashflow live
- Estimated rent
- $1,164 medium interval (Pro) →
- Mortgage (P&I)
- −$755
- Tax from tax record
- −$177 /mo · $2,128/yr
- Insurance
- −$60
- HOA
- −$0
- Vacancy / Maint / Mgmt
- −$244
- Net cashflow
- $-73
Break-even live
Sensitivity live
| Price | -10% $9 | -5% $-32 | +0% $-73 | +5% $-114 | +10% $-154 |
|---|---|---|---|---|---|
| Rent | -10% $-165 | -5% $-119 | +0% $-73 | +5% $-27 | +10% $19 |
| Rate | -1.0pp $0 | -0.5pp $-36 | base $-73 | +0.5pp $-110 | +1.0pp $-148 |
UW: 25.0% down · 7.5% · 30yr · 1.5% tax · 5.0% vac · 8.0% maint · 8.0% mgmt
Financing live
Cash to close
- Down payment
- $36,000
- Closing costs
- $4,320
- Reserves months
- —
- Total cash needed
- —
Loan-product check · same deal, 3 products live
Conventional
25% down · 7.5% · 30yr
- Down + closing
- —
- Monthly P&I
- —
- Monthly cashflow
- —
- DSCR
- —
- Eligible?
- —
Personal DTI + credit; lowest rate.
DSCR
20% down · 8.5% · 30yr
- Down + closing
- —
- Monthly P&I
- —
- Monthly cashflow
- —
- DSCR
- —
- Eligible?
- —
No personal income docs; deal must DSCR.
Hard money
10% down · 12.0% · 12mo
- Down + closing
- —
- Monthly P&I
- —
- Monthly cashflow
- —
- DSCR
- —
- Eligible?
- —
Short-term bridge; refi at stabilization.
Listing history 9 events
-
2026-06-19days on market $144,000 Coming Soon 10 DOM
-
2026-06-18days on market $144,000 Coming Soon 9 DOM
-
2026-06-17days on market $144,000 Coming Soon 8 DOM
-
2026-06-16days on market $144,000 Coming Soon 7 DOM
-
2026-06-15days on market $144,000 Coming Soon 6 DOM
-
2026-06-14days on market $144,000 Coming Soon 4 DOM
-
2026-06-12days on market $144,000 Coming Soon 3 DOM
-
2026-06-09remarks 671-char remark
-
2026-06-09$144,000 Coming Soon 1 DOM
ⓘ Source: listings_history table (triggers on properties + properties_extension) + one-shot
backfill from property_details.listing_events for pre-trigger history.
Tax reassessment forecast MN · Partial reset (capped growth)
- Current annual tax
- $2,128 · $177/mo
- Projected year-2 tax
- $2,128 · $177/mo
- Expected delta
- $0/yr ($0/mo · 0.0%)
ⓘ Screening estimate from a state-policy table — verify with the county assessor before closing.
Climate risk First Street
- Flood 1/10 Low FEMA zone X (unshaded) · 0% chance over 30 yrs
- Wildfire 1/10 Low
- Heat 2/10 Low 7 d/yr ≥98°F today · 15 d/yr by 30 yrs out
- Wind 2/10 Low
- Air quality 1/10 Low 0 unhealthy d/yr today · 0 by 30 yrs out
Nearby sold comps map
Loading sold comps map…
Walkable amenities ~0.75 mi
Loading nearby amenities…
Taxation est. · year 1
- Rental income
- $13,968
- − Mortgage interest
- −$8,066
- − Property taxes
- −$2,128
- − Insurance
- −$720
- − Repairs & maintenance
- −$1,117
- − Management
- −$1,117
- − Depreciation
- −$4,189
- Taxable loss
- −$3,370
- Est. tax savings @ 24.0%
- +$809
- After-tax cash flow
- $-66/yr
For passive investors: Depreciation is non-cash, so a rental often shows a tax loss while cash-flowing — sheltering income. Rental losses are passive: they offset passive income freely, and up to $25,000/yr can offset ordinary (W-2) income if you actively participate and your MAGI is under $100k (phasing out to $0 by $150k); unused losses carry forward. On sale, claimed depreciation is recaptured at up to 25%, and gains may owe capital-gains tax (a 1031 exchange can defer both). Figures are a year-1 estimate at your 24.0% rate — not tax advice; consult a CPA.
Schools (NCES district)
- District
- Milroy Public School District
- NCES district ID
- 2721210
- Math proficiency
- 40% ▲ 19.00%
- Reading proficiency
- 40% ▬ 0.00%
- Median HH income
- $53,824
- Composite
- 37.29/100
- National rank
- #8961
- State rank
- #352 of 467 in MN
Livability — Milroy
- Score
- 67/100
- State rank
- #449
- US rank
- #10645
Category grades
Schools grade is shown separately in the Schools card above.
Census & demographics
- Census place
- Milroy, MN
- Population (ZIP)
- 452
Population outlook (Redwood County) Hauer SSP2
- Today (2025)
- 14,504 people
- By 2030
- 13,983 · -3.6%
- By 2040
- 13,056 · -10.0%
- By 2050
- 12,225 · -15.7%
- By 2075
- 11,051 · -23.8%
- By 2100
- 9,786 · -32.5%
Race, ethnicity, and origin ACS 2023
- Neighborhood character
- Predominantly White (92%)
- Race & ethnicity
- White 92% Two or more races 5% Asian 2%
- Common ancestry
- Portuguese 12% English 9% Romanian 6%
- Languages at home
- 99% English-only · Other Asian/Pacific 1%
Political lean MEDSL · Redwood
- 2024 margin
- Solid R (+43.3) · D 27.7% · R 71.0% · Other 1.2%
- 2008→2024 swing
- -29.8pp toward R · 2008: -13.6pp · 2024: -43.3pp
- All cycles
- 2024: R+43.3 2020: R+41.2 2016: R+43.0 2012: R+20.1 2008: R+13.6
Not yet ingested
- Civics
- —
Market trends
- HPI YoY
- —
- Current HPI
- —
- Rent YoY
- —
- Metro
- —
- State GDP YoY
- ▲ 2.41%
- F500 in state
- 34
Industry mix (Fortune 500 HQ in MN)
| Industry | F500 HQs | Revenue |
|---|---|---|
| Healthcare | 2 | $407B |
|
||
| Retail | 2 | $150B |
|
||
| Consumer Goods | 2 | $32B |
|
||
| Industrial Machinery | 2 | $6B |
|
||
| Agriculture | 1 | $40B |
|
||
| Healthcare / Medical Devices | 1 | $32B |
|
||
Price history
+71.6% since first listed8 events — show timeline
- 2026-06-09 Price Changed $144,000 NORTHSTARMLS as Distributed by MLS Grid
- 2026-06-09 Coming Soon $244,000 NORTHSTARMLS as Distributed by MLS Grid
- 2020-04-23 Sold (Public Records) $82,000 Public Records
- 2020-04-23 Sold (MLS) $82,000 NORTHSTARMLS as Distributed by MLS Grid
- 2020-03-29 Pending — NORTHSTARMLS as Distributed by MLS Grid
- 2020-03-06 Contingent — NORTHSTARMLS as Distributed by MLS Grid
- 2020-03-05 Pending — NORTHSTARMLS as Distributed by MLS Grid
- 2019-10-14 Listed $83,900 NORTHSTARMLS as Distributed by MLS Grid
Property tax history
+3.7%/yrLatest (2025): $2,128 · -5.7% YoY. Source: county tax records.
Cash-flow waterfall
monthlySold comps — $/sqft
last 12 mo · ≤1 miLoading sold comps…