 🌊 Lakefront
8440 Sitting Bull Cv · Hernando, MS
Flood risk 1/10 · Minimal
- FEMA flood zone
- X (unshaded)
- Chance of flooding over 30 yrs
- 0.0%
- Est. flood insurance / yr
- $507 – $1,088
Fire risk 4/10 · Minor
- Est. fire insurance / yr
- $1,241 – $2,305
Heat risk 6/10 · Moderate
- Hot days now (above 109°F)
- 7 days/yr
- Hot days in 30 yrs
- 21 days/yr
Wind risk 4/10 · Minor
- Chance of severe wind over 30 yrs
- 18.0%
Air-quality risk 2/10 · Minimal
- Unhealthy air days now
- 1 days/yr
- Unhealthy air days in 30 yrs
- 1 days/yr
Risk factors via First Street. Map © Google.
Why this score? — see what drove the B- grade
The composite is a weighted blend of 9 inputs, each scored 0–100. Each bar is that input's sub-score; the figure is the points it added to the 100-point composite (weight × sub-score).
- Cash flow +25.8/30.0
- ARV discount +15.0/15.0
- DSCR +8.6/10.0
- 1% rule +6.2/10.0
- Schools +4.0/10.0
- Livability +3.5/5.0
- Condition / age +2.5/5.0
- Rent growth +2.4/5.0
- Appreciation +0.0/10.0
$190,000
🖨 Deal sheet 📄 Offer letter ✓ Due diligence
Listing remarks MLS
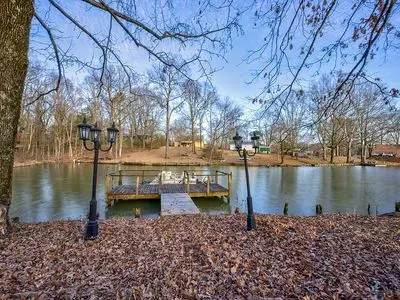
FANNIE MAE - GREAT DEAL ON THIS UNIQUE SHAPED OCTAGON HOME LOCATED ON THE LAKE. HOME FEATURES A WALK AROUND DECK ON THE UPPER AND LOWER LEVEL. BOAT DOCK
Key facts
- Metal roof
- Lake community
- Lake front
Tags
Neighborhood map
What this means for you Summary
Snapshot
- This is a 3-bed/4.0-bath single-family listed at $190k.
Deal economics
- At list price, monthly cash flow is $463 ($6k/yr) — positive.
- The deal already cash-flows at list — no discount required.
- Meets the 1% rule at list price ($2k rent vs $190k).
- Recommended offer: $187k (1.5% below list) — sets the bar for market timing.
- Cap rate 9.2% vs local median 4.2% in Hernando — top-decile yield for the area; either an underpriced asset or a hidden risk that comps aren't pricing in. Stress-test before assuming the spread holds.
Location & tenants
- Location reads 70/100 on livability (#44 in MS) — a middle-class / working-renter tenant base. Strengths: crime A+, cost of living A+, housing A+; Watch: amenities F, commute F, health & safety F.
- Desoto County School District (suburban): math 48% / reading 42% proficiency, ranked #20 of 130 in MS (top 15%) — families likely to look elsewhere, expect single-tenant / working-renter base with shorter leases.
- Market conditions: Rents soft (-0.4%/yr); 403 active listings in the ZIP; solid renter incomes; 1,155 units permitted in DeSoto County in 2024 (0 in 5+ unit buildings).
Forward outlook
- Local home prices are declining (-3.0%/yr); year-one equity from $1k of loan paydown is wiped out by about $6k of value loss. Plan a longer hold.
- DeSoto County population projected at +33% by 2050 — long-run rental-demand tailwind backs the buy-and-hold thesis.
Negotiation context
- It's been on market 23 days — a 2% lower offer ($187k) is reasonable based on typical stale-listing flexibility.
- 2 sale attempts since 21y ago with the ask held roughly flat each time — persistent listings suggest the price (not the market) is what's stuck; bring a comps-based counter.
- Current owner paid $76k; list at $190k implies a 149% gain — meaningful room to come down on a strong offer.
Risks & watch-outs
- Climate carrying-cost: extreme-heat days projected 7→21/yr by 2055 (HVAC capex compounding) — expect insurance premiums to compound above CPI over the hold.
Questions for the listing agent
- Built in 1976 — when were the roof, HVAC, electrical panel, plumbing, and water heater last replaced?
- Is there a deadline driving the sale (1031 exchange, divorce, estate, relocation)? That informs how much negotiation room exists.
- Schools are B-rated — typically a magnet for longer-tenancy family renters. What's the average tenant stay here, and is there a school-zone premium baked into asking?
- This sits on a lake — are riparian / water-frontage rights deeded with the parcel? Any dock permits, shoreline easements, or HOA water-use restrictions?
- What's the documented flood / surge / shoreline-erosion history here (FEMA AND non-FEMA — e.g., storm surge, creek backup, septic-field saturation)?
- Any water-quality or seasonal algae-bloom issues that affect tenant satisfaction or short-term-rental demand?
- What's the average days-on-market for RENTAL listings here right now (not sales)? A rising rental-DOM trend means longer vacancies and softer asking-rent achievability than the comps imply.
- What's the recent tenant-quality profile in this submarket — average credit score on applications, eviction rate, late-payment / NSF rate, and stable-employment percentage? A property-management company in the area should have these aggregated.
- How much new for-sale + rental construction is in the pipeline within 1–3 miles? Heavy new supply typically softens prices + rents 12–24 months out; constrained supply supports both.
Investment metrics
- 1% rule
- 1.12% ✓
- Cap rate
- 9.22%
- Cash-on-cash
- 10.45%
- DSCR
- 1.46
- GRM
- 7.4
CMA / ARV
- ARV (on-the-fly)
- $242,901
- Comps found
- 7
Show comp detail 7 sales within ~0.75 mi
| Address | Dist | Beds/Ba | Sqft | Sold | Price | $/sf | Match |
|---|---|---|---|---|---|---|---|
| 537 Thunderbird Dr | 0.33mi | 2/2.0 (-1) | 1,258 (+2%) | 4mo | $250,000 | $199 | 65 |
| 614 Red Fox Cv | 0.43mi | 3/2.0 | 1,200 (-3%) | 15mo | $249,900 | $208 | 55 |
| 296 Thunderbird Dr N | 0.51mi | 4/2.0 (+1) | 1,261 (+2%) | 21mo | $239,900 | $190 | 42 |
| 8819 Howling Fox Cv | 0.30mi | 2/2.5 (-1) | 1,397 (+13%) | 16mo | $275,000 | $197 | 40 |
| 8647 E Thunderbird Dr | 0.54mi | 3/2.0 | 1,322 (+7%) | 18mo | $239,900 | $181 | 40 |
| 573 S Thunderbird Dr | 0.60mi | 3/2.0 | 1,325 (+8%) | 18mo | $269,900 | $204 | 36 |
| 793 Chickadee Cv | 0.45mi | 3/2.0 | 1,400 (+14%) | 18mo | $205,000 | $146 | 33 |
Match score weights: distance 35% · size 25% · config 20% · recency 20%. Top-matched comps best support the ARV.
Projected returns pro-forma
-3.0% appreciation · 0.0% rent growth · sell at horizon
- IRR
- -3.9%
- Equity multiple
- 0.86×
- Total profit
- $-7,557
- Equity at exit
- $28,330
- IRR
- 2.2%
- Equity multiple
- 1.13×
- Total profit
- $7,161
- Equity at exit
- $16,428
Cash invested: $53,200 (down + closing). Projections, not guarantees.
Landlord ↔ Tenant lean methodology
- Overall (STATE)
- 90 Strongly Landlord-Friendly
- State Mississippi
- 90 Strongly Landlord-Friendly · R+11
- County
- — inherits STATE
- City
- — inherits STATE
ZIP-level market 38632
- Home prices YoY
- -31.8%
- Rents YoY
- -0.4%
- Active inventory
- 403
- Price-to-rent
- 7.4×
Monthly cashflow live
- Estimated rent
- $2,133 medium interval (Pro) →
- Mortgage (P&I)
- −$996
- Tax from tax record
- −$146 /mo · $1,751/yr
- Insurance
- −$79
- HOA
- −$0
- Vacancy / Maint / Mgmt
- −$448
- Net cashflow
- $463
Break-even live
UW: 25.0% down · 7.5% · 30yr · 1.5% tax · 5.0% vac · 8.0% maint · 8.0% mgmt
Financing live
Cash to close
- Down payment
- $47,500
- Closing costs
- $5,700
- Reserves months
- —
- Total cash needed
- —
Loan-product check · same deal, 3 products live
Conventional
25% down · 7.5% · 30yr
- Down + closing
- —
- Monthly P&I
- —
- Monthly cashflow
- —
- DSCR
- —
- Eligible?
- —
Personal DTI + credit; lowest rate.
DSCR
20% down · 8.5% · 30yr
- Down + closing
- —
- Monthly P&I
- —
- Monthly cashflow
- —
- DSCR
- —
- Eligible?
- —
No personal income docs; deal must DSCR.
Hard money
10% down · 12.0% · 12mo
- Down + closing
- —
- Monthly P&I
- —
- Monthly cashflow
- —
- DSCR
- —
- Eligible?
- —
Short-term bridge; refi at stabilization.
Listing history 17 events
-
2026-06-18days on market $190,000 Active 23 DOM
-
2026-06-17days on market $190,000 Active 22 DOM
-
2026-06-16days on market $190,000 Active 21 DOM
-
2026-06-15days on market $190,000 Active 20 DOM
-
2026-06-13days on market $190,000 Active 18 DOM
-
2026-06-10days on market $190,000 Active 15 DOM
-
2026-06-09days on market $190,000 Active 14 DOM
-
2026-06-08days on market $190,000 Active 13 DOM
-
2026-06-07days on market $190,000 Active 12 DOM
-
2026-06-03days on market $190,000 Active 8 DOM
-
2026-06-02days on market $190,000 Active 7 DOM
-
2026-06-01days on market $190,000 Active 6 DOM
-
2026-05-31days on market $190,000 Active 5 DOM
-
2026-05-26$190,000 Active
-
2005-08-04soldstatus 152-char remark
Show marketing remark (152 chars)
FANNIE MAE - GREAT DEAL ON THIS UNIQUE SHAPED OCTAGON HOME LOCATED ON THE LAKE. HOME FEATURES A WALK AROUND DECK ON THE UPPER AND LOWER LEVEL. BOAT DOCK
-
2005-05-31$117,500 152-char remark
Show marketing remark (152 chars)
FANNIE MAE - GREAT DEAL ON THIS UNIQUE SHAPED OCTAGON HOME LOCATED ON THE LAKE. HOME FEATURES A WALK AROUND DECK ON THE UPPER AND LOWER LEVEL. BOAT DOCK
-
2005-03-28soldstatus $76,387
ⓘ Source: listings_history table (triggers on properties + properties_extension) + one-shot
backfill from property_details.listing_events for pre-trigger history.
Tax reassessment forecast MS · Resets to sale price
- Current annual tax
- $1,751 · $146/mo
- Projected year-2 tax
- $1,751 · $146/mo
- Expected delta
- $0/yr ($0/mo · 0.0%)
ⓘ Screening estimate from a state-policy table — verify with the county assessor before closing.
Climate risk First Street
- Flood 1/10 Low FEMA zone X (unshaded) · 0% chance over 30 yrs
- Wildfire 4/10 Moderate
- Heat 6/10 Major 7 d/yr ≥109°F today · 21 d/yr by 30 yrs out
- Wind 4/10 Moderate 18% chance of damaging wind over 30 yrs
- Air quality 2/10 Low 1 unhealthy d/yr today · 1 by 30 yrs out
Nearby sold comps map
Loading sold comps map…
Walkable amenities ~0.75 mi
Loading nearby amenities…
Taxation est. · year 1
- Rental income
- $25,590
- − Mortgage interest
- −$10,643
- − Property taxes
- −$1,751
- − Insurance
- −$950
- − Repairs & maintenance
- −$2,047
- − Management
- −$2,047
- − Depreciation
- −$5,527
- Taxable income
- $2,625
- Est. tax owed @ 24.0%
- −$630
- After-tax cash flow
- $4,929/yr
For passive investors: Depreciation is non-cash, so a rental often shows a tax loss while cash-flowing — sheltering income. Rental losses are passive: they offset passive income freely, and up to $25,000/yr can offset ordinary (W-2) income if you actively participate and your MAGI is under $100k (phasing out to $0 by $150k); unused losses carry forward. On sale, claimed depreciation is recaptured at up to 25%, and gains may owe capital-gains tax (a 1031 exchange can defer both). Figures are a year-1 estimate at your 24.0% rate — not tax advice; consult a CPA.
Schools (NCES district)
- District
- Desoto County School District
- NCES district ID
- 2801320
- Math proficiency
- 48% ▼ -13.00%
- Reading proficiency
- 42% ▼ -6.00%
- Median HH income
- $59,272
- Composite
- 39.56/100
- National rank
- #3933
- State rank
- #20 of 130 in MS
Livability — Hernando
- Score
- 70/100
- State rank
- #44
- US rank
- #8034
Category grades
Schools grade is shown separately in the Schools card above.
Census & demographics
- County
- DeSoto County · 176,513 people
- City population
- 31,374
- Metro
- Memphis, TN-MS-AR
- Population (ZIP)
- 31,374
- Household income
- $93,583
- Rent vs Own
- Severe rent burden
- 24.0
Population outlook (DeSoto County) Hauer SSP2
- Today (2025)
- 203,338 people
- By 2030
- 217,692 · +7.1%
- By 2040
- 245,320 · +20.6%
- By 2050
- 270,133 · +32.8%
- By 2075
- 323,341 · +59.0%
- By 2100
- 348,742 · +71.5%
Race, ethnicity, and origin ACS 2023
- Neighborhood character
- Predominantly White (81%)
- Race & ethnicity
- White 81% Black 13% Two or more races 4% Hispanic / Latino 2%
- Common ancestry
- Italian 2% Serbian 2% Slovak 1%
- Foreign-born
- 2% · Canada
- Languages at home
- 98% English-only · Spanish 1% Arabic 1%
Political lean MEDSL · DeSoto
- 2024 margin
- Strong R (+24.1) · D 36.7% · R 60.8% · Other 2.5%
- 2008→2024 swing
- +14.2pp toward D · 2008: -38.2pp · 2024: -24.1pp
- All cycles
- 2024: R+24.1 2020: R+23.9 2016: R+34.8 2012: R+33.5 2008: R+38.2
Not yet ingested
- Civics
- —
Market trends
- HPI YoY
- ▼ -82.49%
- Current HPI
- 176.8843
- Rent YoY
- ▼ -0.43%
- Metro
- Memphis, TN-MS-AR
- State GDP YoY
- —
- F500 in state
- 0
Price history
+148.7% since first listed4 events — show timeline
- 2026-05-26 Listed $190,000 FSBO.com
- 2005-08-04 Sold (MLS) — MLSU
- 2005-05-31 Listed $117,500 MLSU
- 2005-03-28 Sold (Public Records) $76,387 Public Records
Property tax history
+1.9%/yrLatest (2025): $1,751 · +15.6% YoY. Source: county tax records.
Cash-flow waterfall
monthlySold comps — $/sqft
last 12 mo · ≤1 miLoading sold comps…