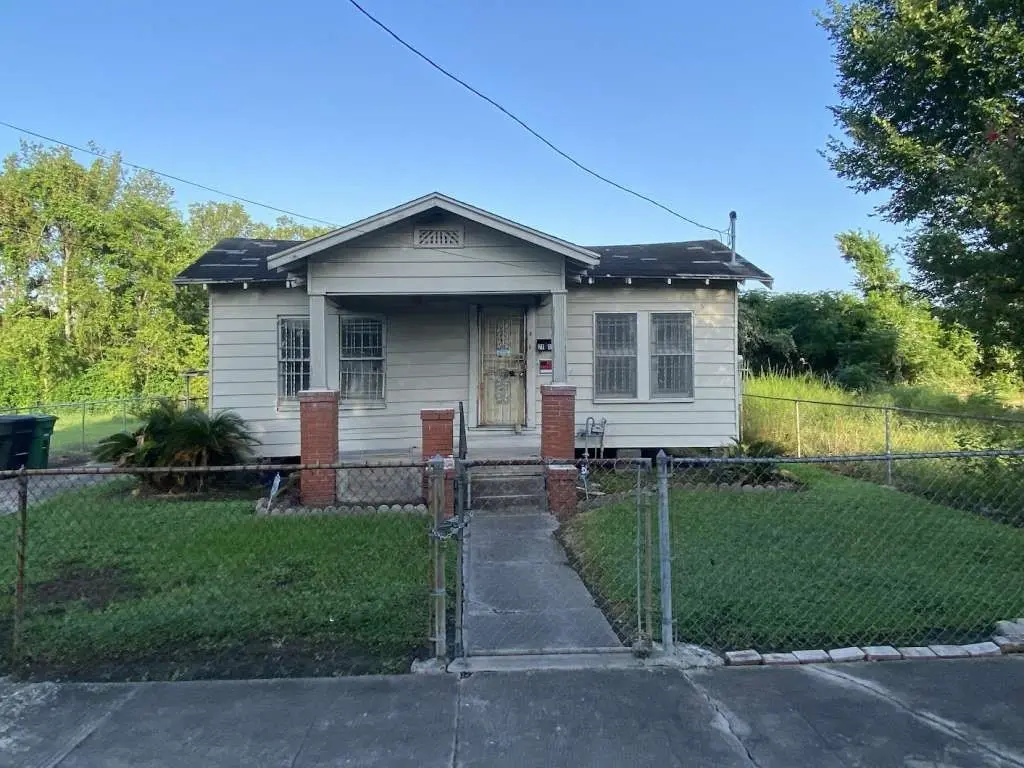
2805 Brackenridge St · Houston, TX
Flood risk 1/10 · Minimal
- FEMA flood zone
- X (unshaded)
- Chance of flooding over 30 yrs
- 0.0%
- Est. flood insurance / yr
- $507 – $1,088
Fire risk 1/10 · Minimal
- Est. fire insurance / yr
- $1,222 – $2,270
Heat risk 9/10 · Severe
- Hot days now (above 109°F)
- 7 days/yr
- Hot days in 30 yrs
- 24 days/yr
Wind risk 9/10 · Severe
- Chance of severe wind over 30 yrs
- 99.0%
Air-quality risk 3/10 · Minor
- Unhealthy air days now
- 2 days/yr
- Unhealthy air days in 30 yrs
- 3 days/yr
Risk factors via First Street. Map © Google.
Why this score? — see what drove the D grade
The composite is a weighted blend of 9 inputs, each scored 0–100. Each bar is that input's sub-score; the figure is the points it added to the 100-point composite (weight × sub-score).
- ARV discount +10.7/15.0
- Cash flow +8.9/30.0
- Appreciation +6.9/10.0
- Livability +3.7/5.0
- 1% rule +3.3/10.0
- Rent growth +3.3/5.0
- Schools +2.7/10.0
- DSCR +2.5/10.0
- Condition / age +2.5/5.0
$152,999
🖨 Deal sheet (PDF) 📄 Offer letter ✓ Due diligence
Listing remarks MLS
FIXER UPPER! We just listed this 2-bedroom 1 bathroom home near the Kashmere Gardens area in North Houston. This home offers plenty potential to become your dream home with a few personalization's and upgrades. Easy access to Eastex Fwy and Highway 69! Coming with foundation repairs. WE MAKE IT EASY TO OWN. This is a great opportunity! Don't wait, call us today to get more information about the seller's easy terms and smooth process that may be able to put the deed in your name.
Key facts
- Foundation repairs
- 4,199 sq ft lot
- Garage
Tags
Neighborhood map
What this means for you Summary
Snapshot
- This is a 2-bed/1.0-bath single-family listed at $153k.
Deal economics
- At list price, monthly cash flow is $-123 ($-1k/yr) — negative.
- To cash-flow at today's rent, offer at most $131k (14.2% below list).
- To meet the 1% rule (rent ≥ 1% of price), the offer needs to be $126k (17.4% below list).
- Recommended offer: $126k (17.4% below list) — sets the bar for 1% rule.
- Cap rate 5.3% vs local median 3.2% in Houston — top-decile yield for the area; either an underpriced asset or a hidden risk that comps aren't pricing in. Stress-test before assuming the spread holds.
Location & tenants
- Location reads 74/100 on livability (#184 in TX, #4,771 nationally) — a middle-class / working-renter tenant base. Strengths: amenities A+, cost of living A+, housing A+; Watch: crime F.
- Houston ISD (urban): math 27% / reading 35% proficiency, ranked #593 of 826 in TX (top 72%) — families likely to look elsewhere, expect single-tenant / working-renter base with shorter leases; 71% free/reduced lunch — lower-income household profile, screen leases tightly.
- Zoned schools: Sherman El (math 22% / reading 22%, grade F, #3,333 of 4,322 statewide, top 80%, 528 students, 99% FRL); Fleming Middle (math 10% / reading 15%, grade F, #1,616 of 1,662 statewide, top 97%, 384 students, 97% FRL); Northside H S (math 15% / reading 26%, grade F, #1,389 of 1,632 statewide, top 86%, 1,168 students, 94% FRL) — zoned schools average 97% FRL vs 71% district-wide (26 pts higher); higher-poverty schools than district average — tighter screening recommended.
- Zoned-school proficiency averages 18% at this address vs 31% district-wide (-13 pts) — the specific schools serving this property underperform the Houston ISD average; the district grade overstates school quality for this exact location.
- Market conditions: Rents rising (+3.1%/yr); 448 active listings in the ZIP; 34 comparable units currently listed for rent nearby; rentals lingering (median 46d on market — plan ~5-8 weeks vacancy on turnover, expect pricing pressure); 62% of comp listings sitting > 30 days — soft ceiling on asking rent; lower-income renter base — watch delinquency; 29,883 units permitted in Harris County in 2024 (8,621 in 5+ unit buildings).
Forward outlook
- In year one you build about $7k of equity ($1k loan paydown + $6k appreciation (3.9% local appreciation)).
- Harris County population projected at +47% by 2050 — long-run rental-demand tailwind backs the buy-and-hold thesis.
- By year 5, paydown + projected appreciation supports a ~$30k cash-out refi (75% LTV) — recoverable capital for the next deal without selling this one.
Negotiation context
- It's been on market 149 days — a 12% lower offer ($135k) is reasonable based on typical stale-listing flexibility.
- 2 sale attempts with the ask held roughly flat each time — persistent listings suggest the price (not the market) is what's stuck; bring a comps-based counter.
Risks & watch-outs
- Watch-outs: built in 1938 — expect roof / HVAC / electrical / plumbing capex.
- Climate carrying-cost: severe wind risk, 99% chance of damaging wind over 30y; extreme-heat days projected 7→24/yr by 2055 (HVAC capex compounding) — expect insurance premiums to compound above CPI over the hold.
Questions for the listing agent
- What do current leases actually rent for vs. the listed asking? Can we see a recent rent roll and the last 12 months of T-12 income?
- It's been on market 149 days. Have you received any prior offers? Is the seller open to a 17% concession, seller financing, or rate buy-down credit?
- Built in 1938 — when were the roof, HVAC, electrical panel, plumbing, and water heater last replaced?
- Why hasn't it sold? Are there any deal-killer items the seller is aware of (foundation, flood, title, zoning, code violations)?
- Is there a deadline driving the sale (1031 exchange, divorce, estate, relocation)? That informs how much negotiation room exists.
- Schools are D-rated, which usually means shorter tenancies and higher turnover. Who's the typical renter profile here, and what's been the actual vacancy rate?
- Crime grade is F in this area — have there been break-ins, vandalism, or insurance claims at this property in the last 3 years? What carrier currently insures it and at what premium?
- The area grade is low — what's the realistic commute time and amenity access for the typical tenant pool here? Any planned neighborhood developments (good or bad) we should know about?
- What's the average days-on-market for RENTAL listings here right now (not sales)? A rising rental-DOM trend means longer vacancies and softer asking-rent achievability than the comps imply.
- What's the recent tenant-quality profile in this submarket — average credit score on applications, eviction rate, late-payment / NSF rate, and stable-employment percentage? A property-management company in the area should have these aggregated.
- How much new for-sale + rental construction is in the pipeline within 1–3 miles? Heavy new supply typically softens prices + rents 12–24 months out; constrained supply supports both.
Investment metrics
- 1% rule
- 0.83% ✗
- Cap rate
- 5.33%
- Cash-on-cash
- -3.44%
- DSCR
- 0.85
- GRM
- 10.1
CMA / ARV
- ARV (median comp)
- $164,617
- List price
- $152,999
- Delta
- -7.06%
- Verdict
- FAIR
- Comps
- 20 within 1.0 mi
Show comp detail 12 sales within ~0.75 mi
| Address | Dist | Beds/Ba | Sqft | Sold | Price | $/sf | Match |
|---|---|---|---|---|---|---|---|
| 3114 Kentucky St St | 0.21mi | 2/1.0 | 900 (-1%) | 17mo | $177,900 | $198 | 74 |
| 2306 Staples St | 0.45mi | 2/1.0 | 912 (0%) | 13mo | $135,000 | $148 | 68 |
| 2112 Des Chaumes St | 0.40mi | 2/2.5 | 955 (+5%) | 2mo | $239,900 | $251 | 66 |
| 2315 Bringhurst St | 0.46mi | 2/1.0 | 930 (+2%) | 12mo | $59,000 | $63 | 65 |
| 2116 Des Chaumes St | 0.40mi | 2/2.5 | 955 (+5%) | 5mo | $240,000 | $251 | 64 |
| 3011 Retta St | 0.15mi | 3/1.0 (+1) | 792 (-13%) | 6mo | $85,000 | $107 | 61 |
| 3208 Sumpter St | 0.53mi | 2/1.0 | 799 (-12%) | 2mo | $147,000 | $184 | 54 |
| 2114 Des Chaumes St | 0.40mi | 2/2.5 | 1,000 (+10%) | 10mo | $235,000 | $235 | 51 |
| 2235 Hutton St | 0.61mi | 2/2.0 | 840 (-8%) | 9mo | $72,000 | $86 | 46 |
| 3107 Elysian St | 0.64mi | 3/1.0 (+1) | 836 (-8%) | 12mo | $187,000 | $224 | 41 |
| 4029 Lucille St | 0.74mi | 2/1.0 | 980 (+8%) | 20mo | $99,000 | $101 | 37 |
| 1505 Ryon St | 0.68mi | 2/1.0 | 780 (-14%) | 16mo | $160,000 | $205 | 31 |
Match score weights: distance 35% · size 25% · config 20% · recency 20%. Top-matched comps best support the ARV.
Projected returns pro-forma
3.89% appreciation · 3.08% rent growth · sell at horizon
- IRR
- 7.0%
- Equity multiple
- 1.42×
- Total profit
- $18,127
- Equity at exit
- $76,616
- IRR
- 9.4%
- Equity multiple
- 2.56×
- Total profit
- $66,983
- Equity at exit
- $124,553
Cash invested: $42,840 (down + closing). Projections, not guarantees.
Landlord ↔ Tenant lean methodology
- Overall (STATE)
- 87 Strongly Landlord-Friendly
- State Texas
- 87 Strongly Landlord-Friendly · R+5
- County
- — inherits STATE
- City
- — inherits STATE
ZIP-level market 77026
- Home prices YoY
- 1.5%
- Rents YoY
- 3.1%
- Active inventory
- 448
- Price-to-rent
- 10.1×
Monthly cashflow live
- Estimated rent
- $1,264 high interval (Pro) →
- Mortgage (P&I)
- −$802
- Tax from tax record
- −$255 /mo · $3,065/yr
- Insurance
- −$64
- HOA
- −$0
- Vacancy / Maint / Mgmt
- −$266
- Net cashflow
- $-123
Break-even live
Sensitivity live
| Price | -10% $-36 | -5% $-79 | +0% $-123 | +5% $-166 | +10% $-209 |
|---|---|---|---|---|---|
| Rent | -10% $-223 | -5% $-173 | +0% $-123 | +5% $-73 | +10% $-23 |
| Rate | -1.0pp $-46 | -0.5pp $-84 | base $-123 | +0.5pp $-162 | +1.0pp $-203 |
UW: 25.0% down · 7.5% · 30yr · 1.5% tax · 5.0% vac · 8.0% maint · 8.0% mgmt
Financing live
Cash to close
- Down payment
- $38,250
- Closing costs
- $4,590
- Reserves months
- —
- Total cash needed
- —
Loan-product check · same deal, 3 products live
Conventional
25% down · 7.5% · 30yr
- Down + closing
- —
- Monthly P&I
- —
- Monthly cashflow
- —
- DSCR
- —
- Eligible?
- —
Personal DTI + credit; lowest rate.
DSCR
20% down · 8.5% · 30yr
- Down + closing
- —
- Monthly P&I
- —
- Monthly cashflow
- —
- DSCR
- —
- Eligible?
- —
No personal income docs; deal must DSCR.
Hard money
10% down · 12.0% · 12mo
- Down + closing
- —
- Monthly P&I
- —
- Monthly cashflow
- —
- DSCR
- —
- Eligible?
- —
Short-term bridge; refi at stabilization.
Rent comps 34 comps
| Address | Beds | Baths | Sqft | Rent | $/sqft | DOM | Units | Dist |
|---|---|---|---|---|---|---|---|---|
| 3019 Florida St Houston, TX | 2.0 | 1.0 | 576 | $950 | $1.65 | 45d | 1 | 0.19mi |
| 3502 Campbell St Houston, TX | 2.0 | 1.0 | 725 | $800 | $1.10 | 45d | 1 | 0.44mi |
| 3031 Sumpter St Unit 50 Houston, TX | 2.0 | 1.0 | 732 | $1,200 | $1.64 | 26d | 1 | 0.44mi |
| 1714 Mary St Houston, TX | 2.0 | 2.0 | 1100 | $2,400 | $2.18 | 45d | 1 | 0.69mi |
| 2209 Gano St Unit 4 Houston, TX | 2.0 | 1.0 | 700 | $1,250 | $1.79 | 45d | 1 | 0.88mi |
| 2209 Gano St Unit 3 Houston, TX | 2.0 | 1.0 | 700 | $1,200 | $1.71 | 45d | 1 | 0.88mi |
| 1710 Shelby St Houston, TX | 2.0 | 1.0 | 688 | $1,250 | $1.82 | 45d | 1 | 0.89mi |
| 3730 Lyons Ave Unit 216 Houston, TX | 3.0 | 2.0 | 1107 | $1,300 | $1.17 | 45d | 1 | 0.89mi |
| 3919 Elysian St Unit 4 Houston, TX | 1.0 | 1.0 | 650 | $1,250 | $1.92 | 45d | 1 | 0.96mi |
| 1519 McKee St Unit 5 Houston, TX | 1.0 | 1.0 | 650 | $1,200 | $1.85 | 16d | 1 | 1.00mi |
| 3816 Gano St Unit B Houston, TX | 1.0 | 1.0 | 700 | $1,150 | $1.64 | 45d | 1 | 1.06mi |
| 1556 Leona St Houston, TX | 1.0 | 1.0 | 905 | $1,505 | $1.66 | 45d | 1 | 1.06mi |
| 1550 Leona St Houston, TX | 1.0–2.0 | 1.0–2.0 | 835 | $1,905 | $2.28 | 3d | 19 | 1.12mi |
| 1205 Morris St Houston, TX | 1.0 | 1.0 | 610 | $1,095 | $1.80 | 45d | 1 | 1.13mi |
| 4203 Hirsch Rd Unit 5 Houston, TX | 2.0 | 1.0 | 758 | $950 | $1.25 | 45d | 1 | 1.14mi |
| 4203 Hirsch Rd Unit 13 Houston, TX | 2.0 | 1.0 | 758 | $975 | $1.29 | 0d | 1 | 1.14mi |
| 1611 Common St Unit 3 Houston, TX | 1.0 | 1.0 | 558 | $1,300 | $2.33 | 45d | 1 | 1.15mi |
| 1550 Burnett St Houston, TX | 1.0–2.0 | 1.0–2.0 | 877 | $2,108 | $2.40 | 0d | 36 | 1.19mi |
| 4111 Cavalcade St Unit 5 Houston, TX | 2.0 | 1.0 | 757 | $825 | $1.09 | 45d | 1 | 1.21mi |
| 1250 Leona St Houston, TX | 2.0 | 1.0–2.0 | 885 | $1,990 | $2.25 | 0d | 15 | 1.24mi |
| 3805 Wipprecht St Houston, TX | 2.0 | 1.0 | 768 | $1,100 | $1.43 | 20d | 1 | 1.25mi |
| 3813 Wipprecht St Houston, TX | 2.0 | 1.0 | 750 | $1,200 | $1.60 | 26d | 1 | 1.26mi |
| 2202 Solo St Houston, TX | 2.0 | 1.0 | 620 | $1,200 | $1.94 | 45d | 1 | 1.26mi |
| 4903 Noble St Houston, TX | 2.0 | 1.0 | 525 | $1,200 | $2.29 | 45d | 1 | 1.27mi |
| 3806 Wipprecht St Houston, TX | 1.0 | 1.0 | 750 | $700 | $0.93 | 15d | 1 | 1.29mi |
| 3814 Wipprecht St Unit 18B Houston, TX | 1.0 | 1.0 | 750 | $700 | $0.93 | 17d | 1 | 1.30mi |
| 1514 Everett St Houston, TX | 2.0 | 1.0 | 970 | $1,840 | $1.90 | 21d | 1 | 1.35mi |
| 913 McKee St Houston, TX | 1.0 | 1.0 | 714 | $1,003 | $1.40 | 45d | 1 | 1.35mi |
| 2316 Freeman St Unit 3 Houston, TX | 1.0 | 1.0 | 750 | $985 | $1.31 | 9d | 1 | 1.37mi |
| 2310 N Main St Houston, TX | 2.0 | 2.0 | 997 | $1,687 | $1.69 | 45d | 1 | 1.41mi |
| 2316 N Main St Houston, TX | 1.0 | 1.0 | 696 | $1,515 | $2.18 | 45d | 1 | 1.41mi |
| 1725 N Main St Houston, TX | 2.0 | 2.0 | 988 | $2,263 | $2.29 | 45d | 1 | 1.43mi |
| 1625 N Main St Houston, TX | 3.0 | 1.0–3.0 | 994 | $2,009 | $2.02 | 0d | 41 | 1.45mi |
| 2627 N Main St Houston, TX | 1.0 | 1.0 | 697 | $1,027 | $1.47 | 45d | 1 | 1.49mi |
Listing history 17 events
-
2026-06-21days on market $152,999 Active 149 DOM
-
2026-06-18days on market $152,999 Active 146 DOM
-
2026-06-17days on market $152,999 Active 145 DOM
-
2026-06-16days on market $152,999 Active 144 DOM
-
2026-06-15days on market $152,999 Active 143 DOM
-
2026-06-13days on market $152,999 Active 141 DOM
-
2026-06-10days on market $152,999 Active 137 DOM
-
2026-06-08days on market $152,999 Active 136 DOM
-
2026-06-07days on market $152,999 Active 135 DOM
-
2026-06-04days on market $152,999 Active 132 DOM
-
2026-06-01days on market $152,999 Active 129 DOM
-
2026-05-31days on market $152,999 Active 128 DOM
-
2026-05-05status Active 483-char remark
Show marketing remark (483 chars)
FIXER UPPER! We just listed this 2-bedroom 1 bathroom home near the Kashmere Gardens area in North Houston. This home offers plenty potential to become your dream home with a few personalization's and upgrades. Easy access to Eastex Fwy and Highway 69! Coming with foundation repairs. WE MAKE IT EASY TO OWN. This is a great opportunity! Don't wait, call us today to get more information about the seller's easy terms and smooth process that may be able to put the deed in your name.
-
2025-10-31status Pending 483-char remark
Show marketing remark (483 chars)
FIXER UPPER! We just listed this 2-bedroom 1 bathroom home near the Kashmere Gardens area in North Houston. This home offers plenty potential to become your dream home with a few personalization's and upgrades. Easy access to Eastex Fwy and Highway 69! Coming with foundation repairs. WE MAKE IT EASY TO OWN. This is a great opportunity! Don't wait, call us today to get more information about the seller's easy terms and smooth process that may be able to put the deed in your name.
-
2025-07-21$152,999 Active 483-char remark
Show marketing remark (483 chars)
FIXER UPPER! We just listed this 2-bedroom 1 bathroom home near the Kashmere Gardens area in North Houston. This home offers plenty potential to become your dream home with a few personalization's and upgrades. Easy access to Eastex Fwy and Highway 69! Coming with foundation repairs. WE MAKE IT EASY TO OWN. This is a great opportunity! Don't wait, call us today to get more information about the seller's easy terms and smooth process that may be able to put the deed in your name.
-
2007-08-10soldstatus
-
2001-05-04soldstatus
ⓘ Source: listings_history table (triggers on properties + properties_extension) + one-shot
backfill from property_details.listing_events for pre-trigger history.
Tax reassessment forecast TX · Resets to sale price
- Current annual tax
- $3,065 · $255/mo
- Projected year-2 tax
- $3,065 · $255/mo
- Expected delta
- $0/yr ($0/mo · 0.0%)
ⓘ Screening estimate from a state-policy table — verify with the county assessor before closing.
Climate risk First Street
- Flood 1/10 Low FEMA zone X (unshaded) · 0% chance over 30 yrs
- Wildfire 1/10 Low
- Heat 9/10 Extreme 7 d/yr ≥109°F today · 24 d/yr by 30 yrs out
- Wind 9/10 Extreme 99% chance of damaging wind over 30 yrs
- Air quality 3/10 Moderate 2 unhealthy d/yr today · 3 by 30 yrs out
Nearby sold comps map
Loading sold comps map…
Walkable amenities ~0.75 mi
Loading nearby amenities…
Taxation est. · year 1
- Rental income
- $15,172
- − Mortgage interest
- −$8,570
- − Property taxes
- −$3,065
- − Insurance
- −$765
- − Repairs & maintenance
- −$1,214
- − Management
- −$1,214
- − Depreciation
- −$4,451
- Taxable loss
- −$4,107
- Est. tax savings @ 24.0%
- +$986
- After-tax cash flow
- $-487/yr
For passive investors: Depreciation is non-cash, so a rental often shows a tax loss while cash-flowing — sheltering income. Rental losses are passive: they offset passive income freely, and up to $25,000/yr can offset ordinary (W-2) income if you actively participate and your MAGI is under $100k (phasing out to $0 by $150k); unused losses carry forward. On sale, claimed depreciation is recaptured at up to 25%, and gains may owe capital-gains tax (a 1031 exchange can defer both). Figures are a year-1 estimate at your 24.0% rate — not tax advice; consult a CPA.
Schools (NCES district)
- District
- Houston ISD
- NCES district ID
- 4823640
- Math proficiency
- 27% ▼ -18.00%
- Reading proficiency
- 35% ▼ -6.00%
- Median HH income
- $46,054
- Composite
- 26.63/100
- National rank
- #7173
- State rank
- #593 of 826 in TX
Livability — Houston
- Score
- 74/100
- State rank
- #184
- US rank
- #4771
Category grades
Schools grade is shown separately in the Schools card above.
Census & demographics
- Census place
- Houston, TX
- County
- Harris County · 4,702,590 people
- City population
- 3,226,434
- Metro
- Houston-The Woodlands-Sugar Land, TX
- Population (ZIP)
- 21,981
- Household income
- $39,211
- Rent vs Own
- Severe rent burden
- 1531.0
Population outlook (Harris County) Hauer SSP2
- Today (2025)
- 5,571,493 people
- By 2030
- 6,089,821 · +9.3%
- By 2040
- 7,142,806 · +28.2%
- By 2050
- 8,185,864 · +46.9%
- By 2075
- 10,574,329 · +89.8%
- By 2100
- 12,109,958 · +117.4%
Race, ethnicity, and origin ACS 2023
- Neighborhood character
- Diverse neighborhood (Simpson 0.56)
- Race & ethnicity
- Black 49% Hispanic / Latino 44% Two or more races 18% White 5% Native American 1%
- Hispanic origin (detail)
- Mexican 34%
- Common ancestry
- Lithuanian 1%
- Foreign-born
- 15% · Canada
- Languages at home
- 61% English-only · Spanish 39%
Political lean MEDSL · Harris
- 2024 margin
- Lean D (+5.5) · D 52.0% · R 46.4% · Other 1.6%
- 2008→2024 swing
- +3.9pp toward D · 2008: 1.6pp · 2024: 5.5pp
- All cycles
- 2024: D+5.5 2020: D+13.3 2016: D+12.4 2012: D+0.1 2008: D+1.6
Not yet ingested
- Civics
- —
Market trends
- HPI YoY
- ▲ 3.89%
- Current HPI
- 267.5995
- Rent YoY
- ▲ 3.08%
- Metro
- Houston-The Woodlands-Sugar Land, TX
- State GDP YoY
- ▲ 3.95%
- F500 in state
- 110
Industry mix (Fortune 500 HQ in TX)
| Industry | F500 HQs | Revenue |
|---|---|---|
| Energy | 16 | $1,198B |
|
||
| Technology | 5 | $198B |
|
||
| Engineering / Construction | 4 | $72B |
|
||
| Energy Services | 3 | $60B |
|
||
| Utilities | 3 | $41B |
|
||
| Healthcare | 2 | $330B |
|
||
Price history
5 events — show timeline
- 2026-05-05 Relisted — HARMLS
- 2025-10-31 Pending — HARMLS
- 2025-07-21 Listed $152,999 HARMLS
- 2007-08-10 Sold (Public Records) — Public Records
- 2001-05-04 Sold (Public Records) — Public Records
Property tax history
+8.7%/yrLatest (2025): $3,065 · +0.3% YoY. Source: county tax records.
Cash-flow waterfall
monthlySold comps — $/sqft
last 12 mo · ≤1 miLoading sold comps…