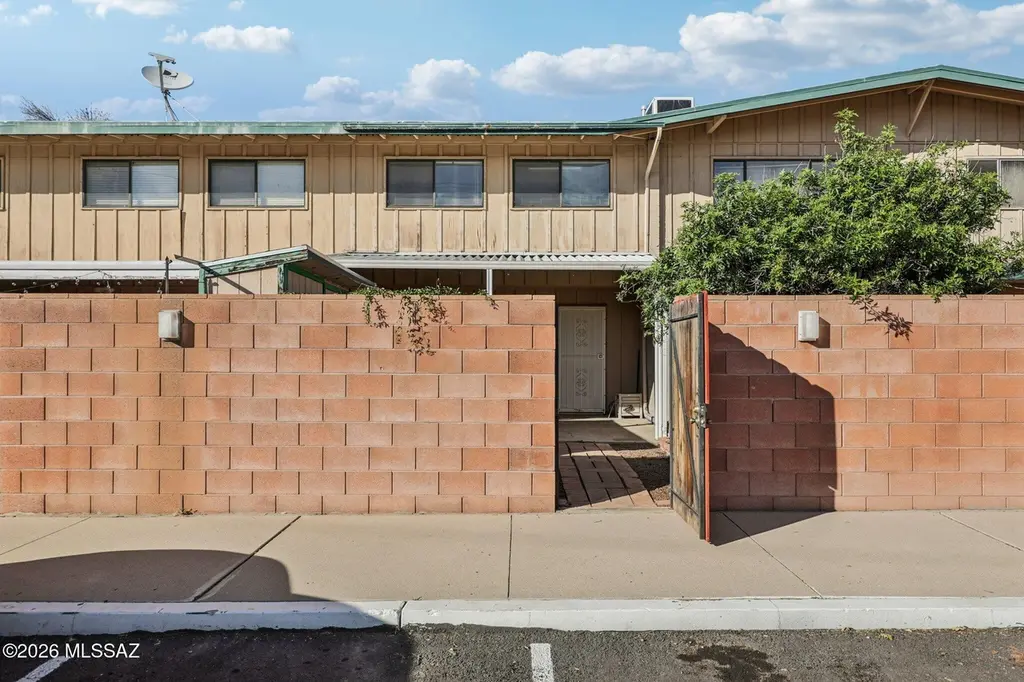
1378 S Avenida Polar Unit L-3 · Tucson, AZ
Flood risk 1/10 · Minimal
- FEMA flood zone
- X (unshaded)
- Chance of flooding over 30 yrs
- 0.0%
- Est. flood insurance / yr
- $507 – $1,088
Fire risk 1/10 · Minimal
- Est. fire insurance / yr
- $610 – $1,132
Heat risk 7/10 · Major
- Hot days now (above 105°F)
- 4 days/yr
- Hot days in 30 yrs
- 11 days/yr
Wind risk 1/10 · Minimal
- Chance of severe wind over 30 yrs
- —
Air-quality risk 1/10 · Minimal
- Unhealthy air days now
- 0 days/yr
- Unhealthy air days in 30 yrs
- 0 days/yr
Risk factors via First Street. Map © Google.
Why this score? — see what drove the C- grade
The composite is a weighted blend of 9 inputs, each scored 0–100. Each bar is that input's sub-score; the figure is the points it added to the 100-point composite (weight × sub-score).
- ARV discount +15.0/15.0
- Cash flow +12.5/30.0
- 1% rule +9.4/10.0
- DSCR +3.7/10.0
- Livability +3.7/5.0
- Rent growth +2.9/5.0
- Condition / age +2.5/5.0
- Schools +1.6/10.0
- Appreciation +0.0/10.0
$105,000
🖨 Deal sheet 📄 Offer letter ✓ Due diligence
Listing remarks MLS
Well-kept unit, updated kitchen, double pane windows, covered patio- convenient to parking! Community Pool, well maintained grounds, Monthly fee covers-heating & cooling, water, gas, exterior roof & common areas.
Key facts
- $485 HOA
- Community pool
- Built 1964
Neighborhood map
What this means for you Summary
Snapshot
- This is a 3-bed/1.5-bath townhouse listed at $105k.
Deal economics
- At list price, monthly cash flow is $-16 ($-191/yr) — negative.
- To cash-flow at today's rent, offer at most $103k (2.2% below list).
- Meets the 1% rule at list price ($2k rent vs $105k).
- Recommended offer: $96k (9.0% below list) — sets the bar for market timing.
- Cap rate 6.1% vs local median 3.7% in Tucson — top-decile yield for the area; either an underpriced asset or a hidden risk that comps aren't pricing in. Stress-test before assuming the spread holds.
Location & tenants
- Location reads 74/100 on livability (#17 in AZ, #4,502 nationally) — a middle-class / working-renter tenant base. Strengths: commute A+, cost of living A+, housing A+; Watch: health & safety C-, schools D+, crime F.
- Tucson Unified District (4403) (urban): math 14% / reading 23% proficiency, ranked #190 of 249 in AZ (top 76%) — low school quality limits family demand, transient renter base, plan for 1-2y turnover.
- Market conditions: Rents rising (+1.6%/yr); 210 active listings in the ZIP; 40 comparable units currently listed for rent nearby; rentals at typical pace (median 24d on market — plan ~3-4 weeks tenant-placement turnaround); 40% of comp listings sitting > 30 days — soft ceiling on asking rent; 5,268 units permitted in Pima County in 2024 (996 in 5+ unit buildings).
- This rent runs 32% of the median local income ($57k/yr) — at the standard rent-burdened threshold; future hikes will face affordability resistance.
Forward outlook
- Local home prices are declining (-3.0%/yr); year-one equity from $726 of loan paydown is wiped out by about $3k of value loss. Plan a longer hold.
- Pima County population projected at +8% by 2050 — modest demand growth; plan on rents tracking national, not racing it.
Negotiation context
- It's been on market 98 days — a 9% lower offer ($96k) is reasonable based on typical stale-listing flexibility.
- 2 sale attempts since 21y ago; this cycle's ask has dropped $15k (12%) from the opening price — seller is motivated, your offer sets the floor, not the list.
- Current owner paid $57k; list at $105k implies a 84% gain — meaningful room to come down on a strong offer.
Risks & watch-outs
- Watch-outs: HOA is 32% of rent.
- Climate carrying-cost: extreme-heat days projected 4→11/yr by 2055 (HVAC capex compounding) — expect insurance premiums to compound above CPI over the hold.
Questions for the listing agent
- What do current leases actually rent for vs. the listed asking? Can we see a recent rent roll and the last 12 months of T-12 income?
- It's been on market 98 days. Have you received any prior offers? Is the seller open to a 9% concession, seller financing, or rate buy-down credit?
- Built in 1964 — when were the roof, HVAC, electrical panel, plumbing, and water heater last replaced?
- What does the HOA fee cover, when was the last increase, and are there any pending special assessments or reserve-fund shortfalls?
- Why hasn't it sold? Are there any deal-killer items the seller is aware of (foundation, flood, title, zoning, code violations)?
- Is there a deadline driving the sale (1031 exchange, divorce, estate, relocation)? That informs how much negotiation room exists.
- Schools are D-rated, which usually means shorter tenancies and higher turnover. Who's the typical renter profile here, and what's been the actual vacancy rate?
- Crime grade is F in this area — have there been break-ins, vandalism, or insurance claims at this property in the last 3 years? What carrier currently insures it and at what premium?
- What's the average days-on-market for RENTAL listings here right now (not sales)? A rising rental-DOM trend means longer vacancies and softer asking-rent achievability than the comps imply.
- What's the recent tenant-quality profile in this submarket — average credit score on applications, eviction rate, late-payment / NSF rate, and stable-employment percentage? A property-management company in the area should have these aggregated.
- How much new for-sale + rental construction is in the pipeline within 1–3 miles? Heavy new supply typically softens prices + rents 12–24 months out; constrained supply supports both.
Investment metrics
- 1% rule
- 1.44% ✓
- Cap rate
- 6.11%
- Cash-on-cash
- -0.65%
- DSCR
- 0.97
- GRM
- 5.8
CMA / ARV
- ARV (median comp)
- $154,338
- List price
- $105,000
- Delta
- -31.97%
- Verdict
- UNDERPRICED
- Comps
- 20 within 1.0 mi
Show comp detail 7 sales within ~0.75 mi
| Address | Dist | Beds/Ba | Sqft | Sold | Price | $/sf | Match |
|---|---|---|---|---|---|---|---|
| 1354 S Avenida Polar Unit H8 | 0.00mi | 3/2.0 | 1,150 (0%) | 7mo | $148,000 | $129 | 92 |
| 1354 S Avenida Polar Unit H5 | 0.05mi | 3/1.5 | 1,150 (0%) | 15mo | $157,230 | $137 | 85 |
| 1330 S Avenida Polar Unit E-4 | 0.00mi | 3/1.5 | 1,050 (-9%) | 13mo | $138,000 | $131 | 74 |
| 1330 S Avenida Polar Unit E12 | 0.00mi | 2/1.5 (-1) | 985 (-14%) | 4mo | $132,000 | $134 | 68 |
| 1306 S Avenida Polar Unit B2 | 0.08mi | 2/2.0 (-1) | 985 (-14%) | 3mo | $155,000 | $157 | 63 |
| 1250 S Sahuara Ave | 0.65mi | 2/2.0 (-1) | 986 (-14%) | 10mo | $220,000 | $223 | 31 |
| 1258 S Sahuara Ave | 0.65mi | 2/1.0 (-1) | 999 (-13%) | 16mo | $165,000 | $165 | 27 |
Match score weights: distance 35% · size 25% · config 20% · recency 20%. Top-matched comps best support the ARV.
Projected returns pro-forma
-3.0% appreciation · 1.61% rent growth · sell at horizon
- IRR
- -19.6%
- Equity multiple
- 0.33×
- Total profit
- $-19,795
- Equity at exit
- $15,656
- IRR
- -17.4%
- Equity multiple
- 0.13×
- Total profit
- $-25,565
- Equity at exit
- $9,078
Cash invested: $29,400 (down + closing). Projections, not guarantees.
Landlord ↔ Tenant lean methodology
- Overall (STATE)
- 87 Strongly Landlord-Friendly
- State Arizona
- 87 Strongly Landlord-Friendly · R+3
- County
- — inherits STATE
- City
- — inherits STATE
ZIP-level market 85710
- Rents YoY
- 1.6%
- Active inventory
- 210
- Price-to-rent
- 5.8×
Monthly cashflow live
- Estimated rent
- $1,512 high interval (Pro) →
- Mortgage (P&I)
- −$551
- Tax est. 1.5%
- −$131 /mo · $1,575/yr
- Insurance
- −$44
- HOA
- −$485
- Vacancy / Maint / Mgmt
- −$318
- Net cashflow
- $-16
Break-even live
UW: 25.0% down · 7.5% · 30yr · 1.5% tax · 5.0% vac · 8.0% maint · 8.0% mgmt
Financing live
Cash to close
- Down payment
- $26,250
- Closing costs
- $3,150
- Reserves months
- —
- Total cash needed
- —
Loan-product check · same deal, 3 products live
Conventional
25% down · 7.5% · 30yr
- Down + closing
- —
- Monthly P&I
- —
- Monthly cashflow
- —
- DSCR
- —
- Eligible?
- —
Personal DTI + credit; lowest rate.
DSCR
20% down · 8.5% · 30yr
- Down + closing
- —
- Monthly P&I
- —
- Monthly cashflow
- —
- DSCR
- —
- Eligible?
- —
No personal income docs; deal must DSCR.
Hard money
10% down · 12.0% · 12mo
- Down + closing
- —
- Monthly P&I
- —
- Monthly cashflow
- —
- DSCR
- —
- Eligible?
- —
Short-term bridge; refi at stabilization.
Rent comps 40 comps
| Address | Beds | Baths | Sqft | Rent | $/sqft | DOM | Units | Dist |
|---|---|---|---|---|---|---|---|---|
| 6402 E Calle Altair Tucson, AZ | 4.0 | 2.0 | 1170 | $1,850 | $1.58 | 44d | 1 | 0.09mi |
| 1051 S Duke Dr Tucson, AZ | 3.0 | 1.0 | 1400 | $1,595 | $1.14 | 20d | 1 | 0.30mi |
| 6508 E Calle Dened Tucson, AZ | 3.0 | 2.0 | 1066 | $1,741 | $1.63 | 12d | 1 | 0.38mi |
| 6122 E Sylvane St Tucson, AZ | 3.0 | 1.0 | 1007 | $1,560 | $1.55 | 3d | 1 | 0.42mi |
| 1733 S Avenida Regulo Tucson, AZ | 3.0 | 2.0 | 1215 | $1,620 | $1.33 | 44d | 1 | 0.48mi |
| 6225 E Calle Aurora Tucson, AZ | 3.0 | 2.0 | 1144 | $1,595 | $1.39 | 44d | 1 | 0.50mi |
| 6158 E 31st St Tucson, AZ | 3.0 | 2.0 | 1414 | $1,800 | $1.27 | 44d | 1 | 0.60mi |
| 1833 S Poetry Ln Tucson, AZ | 3.0 | 2.0 | 1500 | $1,850 | $1.23 | 44d | 1 | 0.63mi |
| 1312 S Sahuara Ave Tucson, AZ | 2.0 | 1.0 | 730 | $1,290 | $1.77 | 3d | 1 | 0.63mi |
| 1266 S Sahuara Ave Tucson, AZ | 2.0 | 1.0 | 986 | $1,195 | $1.21 | 24d | 1 | 0.64mi |
| 5758 E 24th St Tucson, AZ | 2.0 | 1.0 | 860 | $1,175 | $1.37 | 44d | 1 | 0.77mi |
| 822 S Langley Ave #207 Tucson, AZ | 2.0 | 2.0 | 948 | $1,050 | $1.11 | 3d | 1 | 0.79mi |
| 822 S Langley Ave #207 Tucson, AZ | 2.0 | 2.0 | 948 | $1,175 | $1.24 | 24d | 1 | 0.79mi |
| 834 S Langley Ave #201 Tucson, AZ | 2.0 | 2.0 | 970 | $1,200 | $1.24 | 44d | 1 | 0.80mi |
| 5737 E 24th St Tucson, AZ | 2.0 | 1.0 | 873 | $1,200 | $1.37 | 44d | 1 | 0.80mi |
| 820 S Langley Ave Unit 204 Tucson, AZ | 2.0 | 2.0 | 945 | $1,100 | $1.16 | 12d | 1 | 0.83mi |
| 5711 E 26th St Apt B Tucson, AZ | 2.0 | 1.0 | 700 | $800 | $1.14 | 44d | 1 | 0.84mi |
| 2020 S Avenida Ursa Tucson, AZ | 4.0 | 2.0 | 1500 | $1,795 | $1.20 | 44d | 1 | 0.84mi |
| 808 S Langley Ave Unit 201 Tucson, AZ | 2.0 | 2.0 | 945 | $1,050 | $1.11 | 24d | 1 | 0.84mi |
| 808 S Langley Ave Unit 106 Tucson, AZ | 2.0 | 2.0 | 945 | $1,175 | $1.24 | 2d | 1 | 0.84mi |
| 5706 E 24th St Tucson, AZ | 2.0 | 1.0 | 784 | $1,250 | $1.59 | 12d | 1 | 0.84mi |
| 816 S Langley Ave #204 Tucson, AZ | 2.0 | 2.0 | 945 | $1,800 | $1.90 | 44d | 1 | 0.88mi |
| 816 S Langley Ave #203 Tucson, AZ | 2.0 | 1.0 | 945 | $1,050 | $1.11 | 24d | 1 | 0.88mi |
| 1809 S Van Buren Ave Tucson, AZ | 2.0 | 1.0 | 816 | $995 | $1.22 | 16d | 1 | 0.90mi |
| 6625 E Golf Links Rd #2 Tucson, AZ | 2.0 | 2.0 | 849 | $995 | $1.17 | 12d | 1 | 0.91mi |
| 810 S Kolb Rd Unit 4 Tucson, AZ | 2.0 | 1.0 | 850 | $995 | $1.17 | 44d | 1 | 0.92mi |
| 6091 E Golf Links Rd Unit 6121-14 Tucson, AZ | 2.0 | 1.0 | 810 | $1,139 | $1.41 | 24d | 1 | 0.92mi |
| 6091 E Golf Links Rd Unit 6141-06 Tucson, AZ | 2.0 | 1.0 | 900 | $1,270 | $1.41 | 24d | 1 | 0.92mi |
| 6502 E Golf Links Rd Tucson, AZ | 2.0 | 1.0 | 550 | $1,009 | $1.83 | 10d | 12 | 0.97mi |
| 5723 E 19th St Tucson, AZ | 3.0 | 2.0 | 1211 | $2,350 | $1.94 | 44d | 1 | 0.97mi |
| 5674 E Eastland St Tucson, AZ | 3.0 | 2.0 | 1431 | $1,645 | $1.15 | 44d | 1 | 1.02mi |
| 1345 S Kolb Rd Tucson, AZ | 2.0 | 1.5 | 1050 | $1,399 | $1.33 | 44d | 1 | 1.05mi |
| 5828 E 35th St Tucson, AZ | 3.0 | 1.0 | 949 | $1,650 | $1.74 | 15d | 1 | 1.05mi |
| 6940 E Julia St Tucson, AZ | 3.0 | 2.0 | 1457 | $1,950 | $1.34 | 3d | 1 | 1.06mi |
| 7237 E Pierce Pl Tucson, AZ | 3.0 | 2.0 | 1161 | $2,055 | $1.77 | 16d | 1 | 1.07mi |
| 1704 S Jefferson Ave Unit WI1710-6 Tucson, AZ | 2.0 | 1.0 | 750 | $995 | $1.33 | 44d | 1 | 1.07mi |
| 5547 E 29th St Unit 1 Tucson, AZ | 3.0 | 1.5 | 1175 | $995 | $0.85 | 10d | 1 | 1.10mi |
| 5624 E 18th St Tucson, AZ | 3.0 | 2.0 | 1458 | $2,300 | $1.58 | 20d | 1 | 1.12mi |
| 7001 E Golf Links Rd Tucson, AZ | 2.0–3.0 | 1.0–2.0 | 885 | $1,371 | $1.55 | 2d | 9 | 1.16mi |
| 1401 S Woodland Ave Unit 1401 Tucson, AZ | 2.0 | 1.0 | 830 | $700 | $0.84 | 24d | 1 | 1.18mi |
HOA detail
- Monthly dues
- $485 · $5,820/yr
- Likely covers
- watergaslandscapingpool
Listing history 18 events
-
2026-06-18days on market $105,000 Active 98 DOM
-
2026-06-17days on market $105,000 Active 97 DOM
-
2026-06-16days on market $105,000 Active 96 DOM
-
2026-06-15days on market $105,000 Active 95 DOM
-
2026-06-13days on market $105,000 Active 93 DOM
-
2026-06-10days on market $105,000 Active 90 DOM
-
2026-06-09days on market $105,000 Active 89 DOM
-
2026-06-08days on market $105,000 Active 88 DOM
-
2026-06-07days on market $105,000 Active 87 DOM
-
2026-06-05days on market $105,000 Active 84 DOM
-
2026-06-03days on market $105,000 Active 83 DOM
-
2026-06-02days on market $105,000 Active 82 DOM
-
2026-06-01days on market $105,000 Active 81 DOM
-
2026-05-31days on market $105,000 Active 80 DOM
-
2026-04-18price $109,000 220-char remark
Show marketing remark (220 chars)
Well-kept unit, updated kitchen, double pane windows, covered patio- convenient to parking! Community Pool, well maintained grounds, Monthly fee covers-heating & cooling, water, gas, exterior roof & common areas.
-
2026-03-12$120,000 Active 220-char remark
Show marketing remark (220 chars)
Well-kept unit, updated kitchen, double pane windows, covered patio- convenient to parking! Community Pool, well maintained grounds, Monthly fee covers-heating & cooling, water, gas, exterior roof & common areas.
-
2005-10-24soldstatus $57,000 320-char remark
Show marketing remark (320 chars)
Cash only please. No financing,no rentals. Well kept unit, new kitchen, double pane windows, covered patio, Sparkling Comm. pool, well maintained grounds. Monthly fee covers-heating & cooling, water, gas, exterior, roof, common areas, and part of PITI. Where else in Tucson can you get such quality for under $80,000
-
2005-07-02$60,000 320-char remark
Show marketing remark (320 chars)
Cash only please. No financing,no rentals. Well kept unit, new kitchen, double pane windows, covered patio, Sparkling Comm. pool, well maintained grounds. Monthly fee covers-heating & cooling, water, gas, exterior, roof, common areas, and part of PITI. Where else in Tucson can you get such quality for under $80,000
ⓘ Source: listings_history table (triggers on properties + properties_extension) + one-shot
backfill from property_details.listing_events for pre-trigger history.
Climate risk First Street
- Flood 1/10 Low FEMA zone X (unshaded) · 0% chance over 30 yrs
- Wildfire 1/10 Low
- Heat 7/10 Severe 4 d/yr ≥105°F today · 11 d/yr by 30 yrs out
- Wind 1/10 Low
- Air quality 1/10 Low 0 unhealthy d/yr today · 0 by 30 yrs out
Nearby sold comps map
Loading sold comps map…
Walkable amenities ~0.75 mi
Loading nearby amenities…
Taxation est. · year 1
- Rental income
- $18,147
- − Mortgage interest
- −$5,882
- − Property taxes
- −$1,575
- − Insurance
- −$525
- − Repairs & maintenance
- −$1,452
- − Management
- −$1,452
- − HOA
- −$5,820
- − Depreciation
- −$3,055
- Taxable loss
- −$1,612
- Est. tax savings @ 24.0%
- +$387
- After-tax cash flow
- $196/yr
For passive investors: Depreciation is non-cash, so a rental often shows a tax loss while cash-flowing — sheltering income. Rental losses are passive: they offset passive income freely, and up to $25,000/yr can offset ordinary (W-2) income if you actively participate and your MAGI is under $100k (phasing out to $0 by $150k); unused losses carry forward. On sale, claimed depreciation is recaptured at up to 25%, and gains may owe capital-gains tax (a 1031 exchange can defer both). Figures are a year-1 estimate at your 24.0% rate — not tax advice; consult a CPA.
Schools (NCES district)
- District
- Tucson Unified District (4403)
- NCES district ID
- 0408800
- Math proficiency
- 14% ▼ -17.00%
- Reading proficiency
- 23% ▼ -11.00%
- Median HH income
- $40,962
- Composite
- 15.78/100
- National rank
- #9270
- State rank
- #190 of 249 in AZ
Livability — Tucson
- Score
- 74/100
- State rank
- #17
- US rank
- #4502
Category grades
Schools grade is shown separately in the Schools card above.
Census & demographics
- Census place
- Tucson, AZ
- County
- Pima County · 1,012,107 people
- City population
- 839,336
- Metro
- Tucson, AZ
- Population (ZIP)
- 56,125
- Household income
- $57,175
- Rent vs Own
- Severe rent burden
- 3888.0
Population outlook (Pima County) Hauer SSP2
- Today (2025)
- 1,066,056 people
- By 2030
- 1,086,684 · +1.9%
- By 2040
- 1,117,160 · +4.8%
- By 2050
- 1,149,778 · +7.9%
- By 2075
- 1,271,480 · +19.3%
- By 2100
- 1,321,160 · +23.9%
Race, ethnicity, and origin ACS 2023
- Neighborhood character
- Diverse neighborhood (Simpson 0.56)
- Race & ethnicity
- White 62% Hispanic / Latino 25% Two or more races 13% Black 5% Asian 2% Native American 1%
- Hispanic origin (detail)
- Mexican 22%
- Common ancestry
- Lithuanian 3% Romanian 2% Italian 2%
- Foreign-born
- 9% · Canada, South Korea
- Languages at home
- 83% English-only · Spanish 11% Arabic 1% Other Indo-European 1%
Political lean MEDSL · Pima
- 2024 margin
- D (+15.2) · D 57.0% · R 41.8% · Other 1.2%
- 2008→2024 swing
- +9.1pp toward D · 2008: 6.1pp · 2024: 15.2pp
- All cycles
- 2024: D+15.2 2020: D+18.7 2016: D+13.5 2012: D+5.8 2008: D+6.1
Not yet ingested
- Civics
- —
Market trends
- HPI YoY
- ▼ -287.68%
- Current HPI
- 291.8039
- Rent YoY
- ▲ 1.61%
- Metro
- Tucson, AZ
- State GDP YoY
- ▲ 4.54%
- F500 in state
- 20
Industry mix (Fortune 500 HQ in AZ)
| Industry | F500 HQs | Revenue |
|---|---|---|
| Technology | 2 | $13B |
|
||
| Mining / Metals | 1 | $23B |
|
||
| Environmental Services | 1 | $16B |
|
||
| Metals / Steel | 1 | $14B |
|
||
| Technology Distribution | 1 | $9B |
|
||
| Homebuilding | 1 | $8B |
|
||
Price history
+81.7% since first listed4 events — show timeline
- 2026-04-18 Price Changed $109,000 MLSSAZ
- 2026-03-12 Listed $120,000 MLSSAZ
- 2005-10-24 Sold (MLS) $57,000 MLSSAZ
- 2005-07-02 Listed $60,000 MLSSAZ
Cash-flow waterfall
monthlySold comps — $/sqft
last 12 mo · ≤1 miLoading sold comps…