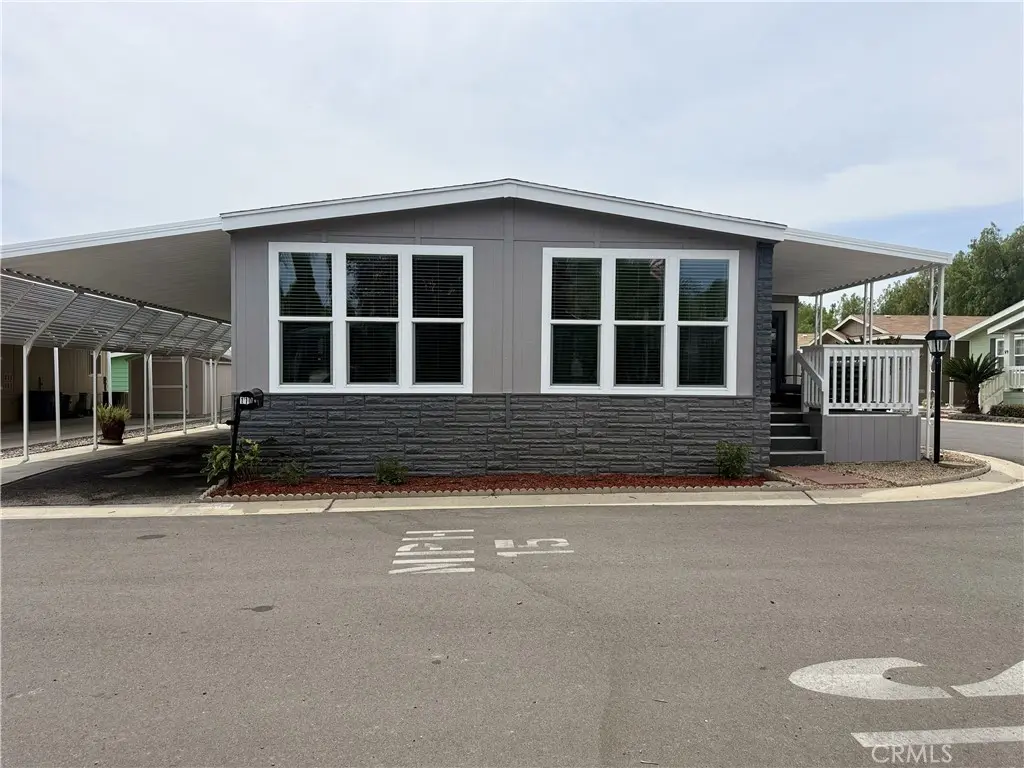
4000 Pierce St #110 · Riverside, CA
Flood risk 6/10 · Moderate
- FEMA flood zone
- X (unshaded)
- Chance of flooding over 30 yrs
- 0.92%
- Est. flood insurance / yr
- $507 – $1,088
Fire risk 7/10 · Major
- Est. fire insurance / yr
- $659 – $1,223
Heat risk 7/10 · Major
- Hot days now (above 102°F)
- 6 days/yr
- Hot days in 30 yrs
- 16 days/yr
Wind risk 1/10 · Minimal
- Chance of severe wind over 30 yrs
- —
Air-quality risk 9/10 · Severe
- Unhealthy air days now
- 19 days/yr
- Unhealthy air days in 30 yrs
- 23 days/yr
Risk factors via First Street. Map © Google.
Why this score? — see what drove the C grade
The composite is a weighted blend of 9 inputs, each scored 0–100. Each bar is that input's sub-score; the figure is the points it added to the 100-point composite (weight × sub-score).
- Cash flow +24.3/30.0
- DSCR +7.8/10.0
- ARV discount +7.5/15.0
- 1% rule +6.3/10.0
- Rent growth +3.9/5.0
- Schools +3.4/10.0
- Livability +3.3/5.0
- Condition / age +2.5/5.0
- Appreciation +0.0/10.0
$249,000
🖨 Deal sheet 📄 Offer letter ✓ Due diligence
Listing remarks
Welcome home to this beautifully remodeled 2-bedroom, 2-bath manufactured home located in the highly desirable 55+ community of The Meadows. Approximately 1680 SQFT of living space and thoughtfully renovated from top to bottom, this turnkey residence offers modern upgrades and exceptional attention to detail throughout. Step inside to discover brand-new flooring, new double-pane windows, and fresh blinds throughout the home. The stunning new kitchen features custom cabinetry, gorgeous granite countertops, and brand-new stainless steel appliances, creating the perfect space for cooking and entertaining. A stylish new wet bar adds additional charm and functionality. The spacious primary suite
Key facts
- Custom cabinetry
- New wet bar
- Granite countertops
Tags
Property features AI
Finance
- Other: Property located in a land-lease mobile home community
- Financial info: Land lease: $1,100 monthly
- HOA & community: Senior community; Community features include street lighting and suburban setting; Park name: The Meadows; Manager approval required for the park; Pets: contact manager
Exterior
- Parking: Attached carport
- Utilities: Private sewer; District / public water
- Home design: Single-story property; Entry at front door
- Construction: Seismic bracing (quake bracing); Mobile dimensions approximately 36 ft wide by 56 ft long; Year built reported by seller
- Exterior features: Front porch; Patio; Deck; Community pool; Corner lot; Two sheds on the property; Mobile home on site remains
Interior
- Kitchen: Kitchen open to family room; Granite counters; 6-burner stove; Gas cooktop; Microwave; Dishwasher
- Bedrooms: All bedrooms on the main floor; Main floor bedroom
- Flooring: Laminated flooring
- Bathrooms: Two full bathrooms; Remodeled bathrooms with walk-in shower and granite counters
- Heating & cooling: Central cooling; Central furnace heating
- Interior features: Wet bar / bar; Ceiling fan; Open floor plan; Granite counters; Double pane windows with blinds; One-level home; entry at front door
- Laundry & utility: Inside laundry in a dedicated room
Neighborhood map
What this means for you Summary
Snapshot
- This is a 2-bed/2.0-bath manufactured listed at $249k.
Deal economics
- At list price, monthly cash flow is $500 ($6k/yr) — positive.
- The deal already cash-flows at list — no discount required.
- Meets the 1% rule at list price ($3k rent vs $249k).
- Cap rate 8.7% vs local median 3.0% in Riverside — top-decile yield for the area; either an underpriced asset or a hidden risk that comps aren't pricing in. Stress-test before assuming the spread holds.
Location & tenants
- Location reads 66/100 on livability (#337 in CA) — a middle-class / working-renter tenant base. Strengths: housing A+, employment A-, commute B+; Watch: schools C-, health & safety D, crime F.
- Alvord Unified (urban): math 28% / reading 42% proficiency, ranked #852 of 1,400 in CA (top 61%) — families likely to look elsewhere, expect single-tenant / working-renter base with shorter leases; 63% free/reduced lunch — lower-income household profile, screen leases tightly.
- Market conditions: Rents rising fast (+5.7%/yr); 90 active listings in the ZIP; 26 comparable units currently listed for rent nearby; rentals at typical pace (median 18d on market — plan ~3-4 weeks tenant-placement turnaround); solid renter incomes; 9,195 units permitted in Riverside County in 2024 (1,512 in 5+ unit buildings).
- This rent runs 36% of the median local income ($92k/yr) — at the standard rent-burdened threshold; future hikes will face affordability resistance.
Forward outlook
- Local home prices are declining (-3.0%/yr); year-one equity from $2k of loan paydown is wiped out by about $7k of value loss. Plan a longer hold.
- Riverside County population projected at +22% by 2050 — long-run rental-demand tailwind backs the buy-and-hold thesis.
- At projected returns (-3.0% appreciation + 5.7% rent growth), your $70k cash investment doubles in ~9 years — after that, you're playing with house money.
Negotiation context
- Only 12 days on market — expect competitive offers; lowballing is unlikely to land.
- 4 sale attempts since 20y ago with the ask held roughly flat each time — persistent listings suggest the price (not the market) is what's stuck; bring a comps-based counter.
Risks & watch-outs
- Climate carrying-cost: major flood risk; major wildfire risk; extreme-heat days projected 6→16/yr by 2055 (HVAC capex compounding) — expect insurance premiums to compound above CPI over the hold.
Questions for the listing agent
- Built in 1977 — when were the roof, HVAC, electrical panel, plumbing, and water heater last replaced?
- Is there a deadline driving the sale (1031 exchange, divorce, estate, relocation)? That informs how much negotiation room exists.
- Crime grade is F in this area — have there been break-ins, vandalism, or insurance claims at this property in the last 3 years? What carrier currently insures it and at what premium?
- What's the average days-on-market for RENTAL listings here right now (not sales)? A rising rental-DOM trend means longer vacancies and softer asking-rent achievability than the comps imply.
- What's the recent tenant-quality profile in this submarket — average credit score on applications, eviction rate, late-payment / NSF rate, and stable-employment percentage? A property-management company in the area should have these aggregated.
- How much new for-sale + rental construction is in the pipeline within 1–3 miles? Heavy new supply typically softens prices + rents 12–24 months out; constrained supply supports both.
Investment metrics
- 1% rule
- 1.13% ✓
- Cap rate
- 8.70%
- Cash-on-cash
- 8.61%
- DSCR
- 1.38
- GRM
- 7.4
CMA / ARV
- ARV (on-the-fly)
- $141,120
- Comps found
- 12
Show comp detail 12 sales within ~0.75 mi
| Address | Dist | Beds/Ba | Sqft | Sold | Price | $/sf | Match |
|---|---|---|---|---|---|---|---|
| 4000 Pierce #135 | 0.00mi | 2/2.0 | 1,344 (0%) | 0mo | $115,000 | $86 | 100 |
| 4000 Pierce #282 | 0.04mi | 2/2.0 | 1,440 (+7%) | 2mo | $139,000 | $97 | 85 |
| 4000 Pierce #138 | 0.00mi | 3/2.0 (+1) | 1,440 (+7%) | 2mo | $191,000 | $133 | 81 |
| 4000 Pierce St #220 | 0.00mi | 3/2.0 (+1) | 1,440 (+7%) | 7mo | $136,000 | $94 | 77 |
| 4000 Pierce St #279 | 0.00mi | 3/2.0 (+1) | 1,440 (+7%) | 8mo | $100,000 | $69 | 76 |
| 3883 Buchanan St #28 | 0.36mi | 3/2.0 (+1) | 1,344 (0%) | 8mo | $192,000 | $143 | 71 |
| 3663 Buchanan #112 | 0.63mi | 3/2.0 (+1) | 1,344 (0%) | 1mo | $169,000 | $126 | 65 |
| 3663 Buchanan St #90 | 0.63mi | 3/2.0 (+1) | 1,344 (0%) | 7mo | $140,000 | $104 | 59 |
| 3883 Buchanan St #88 | 0.42mi | 2/2.0 | 1,464 (+9%) | 8mo | $153,000 | $105 | 59 |
| 3883 Buchanan St #65 | 0.36mi | 2/2.0 | 1,152 (-14%) | 4mo | $22,000 | $19 | 56 |
| 3663 Buchanan St #154 | 0.69mi | 3/2.0 (+1) | 1,365 (+2%) | 8mo | $145,000 | $106 | 53 |
| 3663 Buchanan St #15 | 0.63mi | 3/2.0 (+1) | 1,152 (-14%) | 8mo | $150,000 | $130 | 35 |
Match score weights: distance 35% · size 25% · config 20% · recency 20%. Top-matched comps best support the ARV.
Projected returns pro-forma
-3.0% appreciation · 5.67% rent growth · sell at horizon
- IRR
- -0.3%
- Equity multiple
- 0.99×
- Total profit
- $-688
- Equity at exit
- $37,127
- IRR
- 12.0%
- Equity multiple
- 2.06×
- Total profit
- $74,215
- Equity at exit
- $21,529
Cash invested: $69,720 (down + closing). Projections, not guarantees.
Landlord ↔ Tenant lean methodology
- Overall (STATE)
- 18 Strongly Tenant-Friendly
- State California
- 18 Strongly Tenant-Friendly · D+13
- County
- — inherits STATE
- City
- — inherits STATE
ZIP-level market 92504
- Rents YoY
- 5.7%
- Active inventory
- 90
- Price-to-rent
- 7.4×
Monthly cashflow live
- Estimated rent
- $2,811 high interval (Pro) →
- Mortgage (P&I)
- −$1,306
- Tax est. 1.5%
- −$311 /mo · $3,735/yr
- Insurance
- −$104
- HOA
- −$0
- Vacancy / Maint / Mgmt
- −$590
- Net cashflow
- $500
Break-even live
UW: 25.0% down · 7.5% · 30yr · 1.5% tax · 5.0% vac · 8.0% maint · 8.0% mgmt
Financing live
Cash to close
- Down payment
- $62,250
- Closing costs
- $7,470
- Reserves months
- —
- Total cash needed
- —
Loan-product check · same deal, 3 products live
Conventional
25% down · 7.5% · 30yr
- Down + closing
- —
- Monthly P&I
- —
- Monthly cashflow
- —
- DSCR
- —
- Eligible?
- —
Personal DTI + credit; lowest rate.
DSCR
20% down · 8.5% · 30yr
- Down + closing
- —
- Monthly P&I
- —
- Monthly cashflow
- —
- DSCR
- —
- Eligible?
- —
No personal income docs; deal must DSCR.
Hard money
10% down · 12.0% · 12mo
- Down + closing
- —
- Monthly P&I
- —
- Monthly cashflow
- —
- DSCR
- —
- Eligible?
- —
Short-term bridge; refi at stabilization.
Rent comps 26 comps
| Address | Beds | Baths | Sqft | Rent | $/sqft | DOM | Units | Dist |
|---|---|---|---|---|---|---|---|---|
| 3957 Pierce St Riverside, CA | 1.0–2.0 | 1.0–2.0 | 845 | $2,795 | $3.31 | 1d | 31 | 0.26mi |
| 11711 Collett Ave Riverside, CA | 1.0–3.0 | 1.0–2.0 | 1018 | $3,229 | $3.17 | 1d | 21 | 0.36mi |
| 4408 Ambs Dr Riverside, CA | 3.0 | 2.0 | 1470 | $3,040 | $2.07 | 43d | 1 | 0.47mi |
| 2930 Via Milano Outside Area (Inside Ca), CA | 1.0 | 2.0 | 1007 | $2,500 | $2.48 | 43d | 1 | 0.63mi |
| 11520 Magnolia Ave Riverside, CA | 1.0–2.0 | 1.0–2.0 | 851 | $2,634 | $3.09 | 2d | 7 | 0.71mi |
| 11377 Brookglen Ct Riverside, CA | 3.0 | 2.5 | 1532 | $3,400 | $2.22 | 24d | 1 | 0.89mi |
| 4259 Redstar Ct Riverside, CA | 3.0 | 2.0 | 1178 | $3,000 | $2.55 | 24d | 1 | 0.91mi |
| 4259 Redstar Ct Riverside, CA | 3.0 | 2.0 | 1178 | $3,000 | $2.55 | 5d | 1 | 0.91mi |
| 4259 Redstar Ct Riverside, CA | 3.0 | 2.0 | 1178 | $3,000 | $2.55 | 15d | 1 | 0.91mi |
| 4259 Redstar Ct Riverside, CA | 3.0 | 2.0 | 1178 | $3,000 | $2.55 | 20d | 1 | 0.91mi |
| 11309 Rasmussen Ct Riverside, CA | 3.0 | 2.5 | 1535 | $3,225 | $2.10 | 18d | 1 | 0.93mi |
| 371 Dylan Cir Corona, CA | 3.0 | 2.0 | 1625 | $3,500 | $2.15 | 4d | 1 | 0.98mi |
| 11331 River Trail Ct Riverside, CA | 3.0 | 2.5 | 1532 | $3,200 | $2.09 | 43d | 1 | 0.99mi |
| 4655 Sierra Vista Ave Riverside, CA | 2.0–3.0 | 2.0 | 1043 | $2,536 | $2.43 | 2d | 11 | 0.99mi |
| 11207 Magnolia Ave Riverside, CA | 2.0 | 2.0 | 1200 | $2,250 | $1.88 | 24d | 1 | 1.00mi |
| 545 Hamilton Dr Corona, CA | 1.0 | 1.0 | 900 | $1,900 | $2.11 | 24d | 1 | 1.00mi |
| 4725 Sierra Vista Ave Riverside, CA | 1.0–2.0 | 1.0–2.0 | 785 | $2,882 | $3.67 | 3d | 10 | 1.00mi |
| 3900 Fir Tree Dr Riverside, CA | 1.0–2.0 | 1.0–2.0 | 789 | $2,695 | $3.42 | 2d | 6 | 1.06mi |
| 11282 Price Ct Riverside, CA | 3.0 | 2.5 | 1646 | $3,095 | $1.88 | 43d | 1 | 1.21mi |
| 2365 Promenade Ave Corona, CA | 1.0–2.0 | 1.0–2.0 | 892 | $2,557 | $2.87 | 1d | 18 | 1.25mi |
| 3850 Skofstad St Riverside, CA | 1.0–2.0 | 1.0–2.0 | 880 | $2,135 | $2.43 | 24d | 2 | 1.28mi |
| 2361 Mary Helen St Unit 102 Corona, CA | 2.0 | 1.5 | 1000 | $2,395 | $2.40 | 2d | 1 | 1.37mi |
| 2341 Mary Helen St Unit 104 Corona, CA | 3.0 | 2.5 | 1000 | $2,550 | $2.55 | 43d | 1 | 1.38mi |
| 3713 Calle Curacso Riverside, CA | 3.0 | 2.0 | 1300 | $3,090 | $2.38 | 16d | 1 | 1.39mi |
| 3713 Calle Curacso Riverside, CA | 3.0 | 2.5 | 1300 | $3,090 | $2.38 | 43d | 1 | 1.39mi |
| 2235 Treehouse Ln Corona, CA | 1.0–2.0 | 1.0–2.0 | 886 | $2,770 | $3.12 | 2d | 17 | 1.42mi |
Listing history 10 events
-
2026-06-18days on market $249,000 Active 12 DOM
-
2026-06-17days on market $249,000 Active 11 DOM
-
2026-06-16days on market $249,000 Active 10 DOM
-
2026-06-15days on market $249,000 Active 9 DOM
-
2026-06-13days on market $249,000 Active 7 DOM
-
2026-06-13days on market $249,000 Active 6 DOM
-
2026-06-09days on market $249,000 Active 3 DOM
-
2026-06-08days on market $249,000 Active 2 DOM
-
2026-06-07remarks 699-char remark
-
2026-06-07$249,000 Active 1 DOM
ⓘ Source: listings_history table (triggers on properties + properties_extension) + one-shot
backfill from property_details.listing_events for pre-trigger history.
Climate risk First Street
- Flood 6/10 Major FEMA zone X (unshaded) · 92% chance over 30 yrs
- Wildfire 7/10 Severe
- Heat 7/10 Severe 6 d/yr ≥102°F today · 16 d/yr by 30 yrs out
- Wind 1/10 Low
- Air quality 9/10 Extreme 19 unhealthy d/yr today · 23 by 30 yrs out
Nearby sold comps map
Loading sold comps map…
Walkable amenities ~0.75 mi
Loading nearby amenities…
Taxation est. · year 1
- Rental income
- $33,738
- − Mortgage interest
- −$13,948
- − Property taxes
- −$3,735
- − Insurance
- −$1,245
- − Repairs & maintenance
- −$2,699
- − Management
- −$2,699
- − Depreciation
- −$7,244
- Taxable income
- $2,168
- Est. tax owed @ 24.0%
- −$520
- After-tax cash flow
- $5,483/yr
For passive investors: Depreciation is non-cash, so a rental often shows a tax loss while cash-flowing — sheltering income. Rental losses are passive: they offset passive income freely, and up to $25,000/yr can offset ordinary (W-2) income if you actively participate and your MAGI is under $100k (phasing out to $0 by $150k); unused losses carry forward. On sale, claimed depreciation is recaptured at up to 25%, and gains may owe capital-gains tax (a 1031 exchange can defer both). Figures are a year-1 estimate at your 24.0% rate — not tax advice; consult a CPA.
Schools (NCES district)
- District
- Alvord Unified
- NCES district ID
- 0602430
- Math proficiency
- 28% ▲ 1.00%
- Reading proficiency
- 42% ▲ 2.00%
- Median HH income
- $58,965
- Composite
- 33.81/100
- National rank
- #10383
- State rank
- #852 of 1400 in CA
Livability — Riverside
- Score
- 66/100
- State rank
- #337
- US rank
- #11613
Category grades
Schools grade is shown separately in the Schools card above.
Census & demographics
- Census place
- Riverside, CA
- County
- Riverside County · 2,287,001 people
- City population
- 367,890
- Metro
- Riverside-San Bernardino-Ontario, CA
- Population (ZIP)
- 57,132
- Household income
- $92,477
- Rent vs Own
- Severe rent burden
- 1669.0
Population outlook (Riverside County) Hauer SSP2
- Today (2025)
- 2,664,475 people
- By 2030
- 2,802,692 · +5.2%
- By 2040
- 3,050,904 · +14.5%
- By 2050
- 3,256,783 · +22.2%
- By 2075
- 3,655,058 · +37.2%
- By 2100
- 3,766,594 · +41.4%
Race, ethnicity, and origin ACS 2023
- Neighborhood character
- Diverse neighborhood (Simpson 0.60)
- Race & ethnicity
- Hispanic / Latino 56% White 28% Two or more races 14% Black 8% Asian 4%
- Hispanic origin (detail)
- Mexican 48%
- Common ancestry
- Slovak 1% Italian 1% Lithuanian 1%
- Foreign-born
- 20% · Canada, Vietnam, China
- Languages at home
- 58% English-only · Spanish 37% Chinese 1% Vietnamese 1%
Political lean MEDSL · Riverside
- 2024 margin
- Toss-up / Even · D 48.0% · R 49.3% · Other 2.6%
- 2008→2024 swing
- -3.6pp toward R · 2008: 2.3pp · 2024: -1.3pp
- All cycles
- 2024: R+1.3 2020: D+8.0 2016: D+4.3 2012: R+0.4 2008: D+2.3
Not yet ingested
- Civics
- —
Market trends
- HPI YoY
- ▼ -457.73%
- Current HPI
- 414.1936
- Rent YoY
- ▲ 5.67%
- Metro
- Riverside-San Bernardino-Ontario, CA
- State GDP YoY
- ▲ 3.21%
- F500 in state
- 116
Industry mix (Fortune 500 HQ in CA)
| Industry | F500 HQs | Revenue |
|---|---|---|
| Technology | 27 | $1,492B |
|
||
| Financial Services | 3 | $174B |
|
||
| Retail | 3 | $44B |
|
||
| Insurance | 3 | $26B |
|
||
| Media / Entertainment | 2 | $115B |
|
||
| Pharmaceuticals / Biotech | 2 | $62B |
|
||
Price history
+232.4% since first listed7 events — show timeline
- 2026-06-06 Listed $249,000 CRMLS
- 2007-06-28 Listing Removed — CRMLS
- 2007-04-20 Listed $57,900 CRMLS
- 2007-01-01 Listing Removed — CRMLS
- 2006-10-02 Listed $64,900 CRMLS
- 2006-10-01 Listing Removed — CRMLS
- 2006-08-22 Listed $74,900 CRMLS
Property tax history
-6.3%/yrLatest (2025): $199 · +8.7% YoY. Source: county tax records.
Cash-flow waterfall
monthlySold comps — $/sqft
last 12 mo · ≤1 miLoading sold comps…