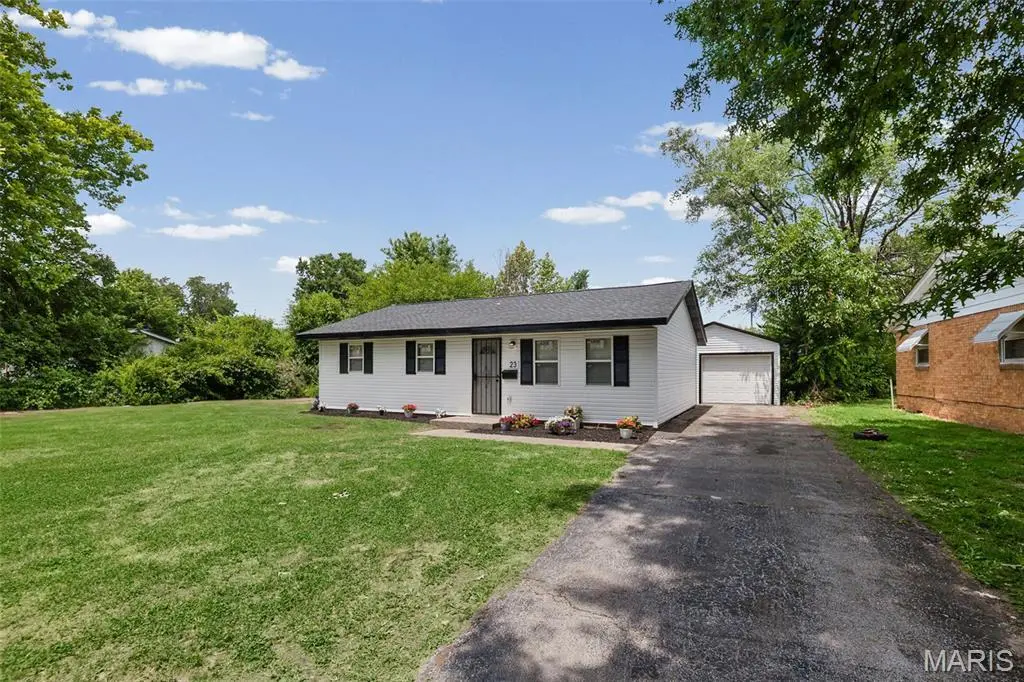
23 Leonard Dr · Cahokia Heights, IL
Flood risk 1/10 · Minimal
- FEMA flood zone
- X (shaded)
- Chance of flooding over 30 yrs
- 0.0%
- Est. flood insurance / yr
- $507 – $1,088
Fire risk 1/10 · Minimal
- Est. fire insurance / yr
- $804 – $1,492
Heat risk 5/10 · Moderate
- Hot days now (above 107°F)
- 7 days/yr
- Hot days in 30 yrs
- 21 days/yr
Wind risk 2/10 · Minimal
- Chance of severe wind over 30 yrs
- 1.0%
Air-quality risk 3/10 · Minor
- Unhealthy air days now
- 3 days/yr
- Unhealthy air days in 30 yrs
- 4 days/yr
Risk factors via First Street. Map © Google.
Why this score? — see what drove the B- grade
The composite is a weighted blend of 9 inputs, each scored 0–100. Each bar is that input's sub-score; the figure is the points it added to the 100-point composite (weight × sub-score).
- Cash flow +30.0/30.0
- DSCR +10.0/10.0
- ARV discount +9.6/15.0
- 1% rule +8.7/10.0
- Rent growth +2.5/5.0
- Livability +2.5/5.0
- Condition / age +2.5/5.0
- Schools +0.6/10.0
- Appreciation +0.0/10.0
$100,000
🖨 Deal sheet (PDF) 📄 Offer letter ✓ Due diligence
Listing remarks
Municipal Occupancy Ready! Charming and move-in ready 3-bedroom home with a detached garage and extensive renovations throughout. From the moment you walk in, you'll appreciate the tasteful updates, including fresh paint, new windows, beautifully finished luxury vinyl flooring, and completely updated kitchen and bathroom spaces. The open concept layout creates a seamless flow between the living area and the renovated kitchen, featuring white shaker cabinets, brand-new countertops, back splash, large laundry room, and new ceiling fans. The bathroom has been updated with a new vanity, light fixture, toilet, and flooring. Additional major improvements provide peace of mind, including a new roo
Key facts
- Updated kitchen
- Updated bathroom
- New roof
Tags
Property features AI
Finance
- Financial info: Lease not considered
Exterior
- Utilities: Public water; Public sewer; Electric service by Ameren; Electricity available
- Home design: Single-family residence; One level
- Construction: Construction materials: Other; Above-grade finished area approximately 936 (estimated)
- Exterior features: Lot features: Other; Approximately 0.14-acre lot
Interior
- Kitchen: Appliances included (details not specified)
- Bedrooms: Three bedrooms on the main level
- Bathrooms: One full bathroom on the main level
- Heating & cooling: Forced air heating; Central air conditioning; Ceiling fan(s)
- Interior features: Ceiling fans; Central air; Forced air heating; Appliances included (unspecified)
- Laundry & utility: No specific laundry/utility details provided
Neighborhood map
What this means for you Summary
Snapshot
- This is a 3-bed/2.0-bath single-family listed at $100k.
Deal economics
- At list price, monthly cash flow is $389 ($5k/yr) — positive.
- The deal already cash-flows at list — no discount required.
- Meets the 1% rule at list price ($1k rent vs $100k).
Location & tenants
- Location reads: area grade B — affects rentability + tenant quality, not the cash-flow math above.
- Cahokia CUSD 187 (suburban): math 3% / reading 5% proficiency, ranked #864 of 919 in IL (top 94%) — low school quality limits family demand, transient renter base, plan for 1-2y turnover; 85% free/reduced lunch — lower-income household profile, screen leases tightly.
- Zoned schools: Cahokia High School (math 8% / reading 2%, grade F, #614 of 693 statewide, top 95%, 845 students, 0% FRL) — zoned schools average 0% FRL vs 85% district-wide (85 pts lower); this property's tenant base skews higher-income than the district average.
- Market conditions: 153 active listings in the ZIP; 27 comparable units currently listed for rent nearby; rentals at typical pace (median 22d on market — plan ~3-4 weeks tenant-placement turnaround); lower-income renter base — watch delinquency; 783 units permitted in St. Clair County in 2024 (378 in 5+ unit buildings).
- At $1,367/mo this rent would consume 48% of the median local household income ($34k/yr) (locally 729% of renters already pay >50% of income on rent) — very limited rent-growth headroom before tenants either downsize or default.
Forward outlook
- Local home prices are declining (-3.0%/yr); year-one equity from $691 of loan paydown is wiped out by about $3k of value loss. Plan a longer hold.
- St. Clair County population projected at -23% by 2050 — secular population decline; favor cash flow + early exit over multi-decade hold.
- At projected returns (-3.0% appreciation + 3.0% rent growth), your $28k cash investment doubles in ~8 years — after that, you're playing with house money.
Negotiation context
- Only 7 days on market — expect competitive offers; lowballing is unlikely to land.
Risks & watch-outs
- Watch-outs: built in 1957 — expect roof / HVAC / electrical / plumbing capex.
- Climate carrying-cost: extreme-heat days projected 7→21/yr by 2055 (HVAC capex compounding) — expect insurance premiums to compound above CPI over the hold.
Questions for the listing agent
- Built in 1957 — when were the roof, HVAC, electrical panel, plumbing, and water heater last replaced?
- Is there a deadline driving the sale (1031 exchange, divorce, estate, relocation)? That informs how much negotiation room exists.
- What's the average days-on-market for RENTAL listings here right now (not sales)? A rising rental-DOM trend means longer vacancies and softer asking-rent achievability than the comps imply.
- What's the recent tenant-quality profile in this submarket — average credit score on applications, eviction rate, late-payment / NSF rate, and stable-employment percentage? A property-management company in the area should have these aggregated.
- How much new for-sale + rental construction is in the pipeline within 1–3 miles? Heavy new supply typically softens prices + rents 12–24 months out; constrained supply supports both.
Investment metrics
- 1% rule
- 1.37% ✓
- Cap rate
- 10.96%
- Cash-on-cash
- 16.68%
- DSCR
- 1.74
- GRM
- 6.1
CMA / ARV
- ARV (on-the-fly)
- $104,832
- Comps found
- 12
Show comp detail 12 sales within ~0.75 mi
| Address | Dist | Beds/Ba | Sqft | Sold | Price | $/sf | Match |
|---|---|---|---|---|---|---|---|
| 19 Leonard Dr | 0.02mi | 3/1.0 | 936 (0%) | 1mo | $59,000 | $63 | 94 |
| 20 Leonard Dr | 0.03mi | 4/2.0 (+1) | 975 (+4%) | 0mo | $110,000 | $113 | 86 |
| 1708 Parklane Dr | 0.17mi | 3/1.0 | 925 (-1%) | 2mo | $105,000 | $114 | 84 |
| 103 Kenneth Ave | 0.24mi | 3/1.0 | 864 (-8%) | 1mo | $105,000 | $122 | 71 |
| 306 Marion St | 0.29mi | 3/1.0 | 1,000 (+7%) | 1mo | $49,000 | $49 | 70 |
| 235 St Christopher Dr | 0.50mi | 3/1.0 | 925 (-1%) | 2mo | $22,950 | $25 | 69 |
| 1426 Richard Dr | 0.51mi | 3/1.5 | 912 (-3%) | 2mo | $80,000 | $88 | 68 |
| 1417 Richard Dr | 0.56mi | 3/1.0 | 936 (0%) | 2mo | $105,000 | $112 | 68 |
| 1408 Williams St | 0.62mi | 3/1.0 | 936 (0%) | 1mo | $80,000 | $85 | 66 |
| 1936 Doris | 0.59mi | 2/1.0 (-1) | 887 (-5%) | 1mo | $32,500 | $37 | 54 |
| 1313 Saint Raphael St | 0.62mi | 3/1.0 | 864 (-8%) | 1mo | $105,000 | $122 | 53 |
| 2116 Doris Ave | 0.74mi | 3/1.0 | 880 (-6%) | 2mo | $105,000 | $119 | 50 |
Match score weights: distance 35% · size 25% · config 20% · recency 20%. Top-matched comps best support the ARV.
Projected returns pro-forma
-3.0% appreciation · 3.0% rent growth · sell at horizon
- IRR
- 7.8%
- Equity multiple
- 1.31×
- Total profit
- $8,598
- Equity at exit
- $14,910
- IRR
- 17.1%
- Equity multiple
- 2.41×
- Total profit
- $39,481
- Equity at exit
- $8,646
Cash invested: $28,000 (down + closing). Projections, not guarantees.
Landlord ↔ Tenant lean methodology
- Overall (STATE)
- 43 Moderately Tenant-Leaning
- State Illinois
- 43 Moderately Tenant-Leaning · D+7
- County
- — inherits STATE
- City
- — inherits STATE
ZIP-level market 62206
- Home prices YoY
- -20.2%
- Active inventory
- 153
- Price-to-rent
- 6.1×
Monthly cashflow live
- Estimated rent
- $1,367 high interval (Pro) →
- Mortgage (P&I)
- −$524
- Tax est. 1.5%
- −$125 /mo · $1,500/yr
- Insurance
- −$42
- HOA
- −$0
- Vacancy / Maint / Mgmt
- −$287
- Net cashflow
- $389
Break-even live
Sensitivity live
| Price | -10% $458 | -5% $424 | +0% $389 | +5% $355 | +10% $320 |
|---|---|---|---|---|---|
| Rent | -10% $281 | -5% $335 | +0% $389 | +5% $443 | +10% $497 |
| Rate | -1.0pp $439 | -0.5pp $415 | base $389 | +0.5pp $363 | +1.0pp $337 |
UW: 25.0% down · 7.5% · 30yr · 1.5% tax · 5.0% vac · 8.0% maint · 8.0% mgmt
Financing live
Cash to close
- Down payment
- $25,000
- Closing costs
- $3,000
- Reserves months
- —
- Total cash needed
- —
Loan-product check · same deal, 3 products live
Conventional
25% down · 7.5% · 30yr
- Down + closing
- —
- Monthly P&I
- —
- Monthly cashflow
- —
- DSCR
- —
- Eligible?
- —
Personal DTI + credit; lowest rate.
DSCR
20% down · 8.5% · 30yr
- Down + closing
- —
- Monthly P&I
- —
- Monthly cashflow
- —
- DSCR
- —
- Eligible?
- —
No personal income docs; deal must DSCR.
Hard money
10% down · 12.0% · 12mo
- Down + closing
- —
- Monthly P&I
- —
- Monthly cashflow
- —
- DSCR
- —
- Eligible?
- —
Short-term bridge; refi at stabilization.
Rent comps 27 comps
| Address | Beds | Baths | Sqft | Rent | $/sqft | DOM | Units | Dist |
|---|---|---|---|---|---|---|---|---|
| 1706 Andrews Dr East Saint Louis, IL | 4.0 | 1.0 | 925 | $1,320 | $1.43 | 24d | 1 | 0.21mi |
| 2008 Delores St East Saint Louis, IL | 3.0 | 1.0 | 925 | $1,250 | $1.35 | 5d | 1 | 0.43mi |
| 1421 Richard Dr East Saint Louis, IL | 3.0 | 1.0 | 936 | $1,100 | $1.18 | 2d | 1 | 0.55mi |
| 1417 Richard Dr East Saint Louis, IL | 3.0 | 1.0 | 936 | $1,400 | $1.50 | 22d | 1 | 0.56mi |
| 1405 Williams St Cahokia Heights, IL | 3.0 | 1.0 | 900 | $1,500 | $1.67 | 44d | 1 | 0.65mi |
| 1308 Saint Stephens Dr Cahokia Heights, IL | 2.0 | 1.0 | 864 | $875 | $1.01 | 16d | 1 | 0.66mi |
| 1308 Saint Stephens Dr Cahokia Heights, IL | 2.0 | 1.0 | 864 | $875 | $1.01 | 15d | 1 | 0.66mi |
| 1808 Mullens Ave Cahokia Heights, IL | 3.0 | 1.0 | 992 | $1,500 | $1.51 | 3d | 1 | 0.67mi |
| 2116 Doris Ave Cahokia Heights, IL | 3.0 | 1.0 | 880 | $1,400 | $1.59 | 22d | 1 | 0.75mi |
| 1716 # E Unit Loretta Ave unit East St Louis, IL | 2.0 | 1.0 | 720 | $1,000 | $1.39 | 44d | 1 | 0.79mi |
| 1220 Williams St East Saint Louis, IL | 3.0 | 1.0 | 876 | $1,500 | $1.71 | 15d | 1 | 0.81mi |
| 1713 Loretta Ave East Saint Louis, IL | 3.0 | 1.0 | 944 | $1,095 | $1.16 | 44d | 1 | 0.82mi |
| 1162 Smith St East Saint Louis, IL | 3.0 | 1.0 | 988 | $1,295 | $1.31 | 22d | 1 | 0.89mi |
| 1150 Price St Cahokia, IL | 3.0 | 1.0 | 864 | $1,400 | $1.62 | 3d | 1 | 0.98mi |
| 1109 Saint Helena Dr Cahokia Heights, IL | 3.0 | 1.0 | 825 | $1,400 | $1.70 | 3d | 1 | 1.00mi |
| 818 La Salle Dr East Saint Louis, IL | 3.0 | 1.0 | 1106 | $1,300 | $1.18 | 24d | 1 | 1.09mi |
| 2 E Adams Dr East Saint Louis, IL | 3.0 | 1.0 | 925 | $885 | $0.96 | 44d | 1 | 1.15mi |
| 819 Mildred Ave East Saint Louis, IL | 3.0 | 1.0 | 936 | $1,250 | $1.34 | 22d | 1 | 1.18mi |
| 142 Saint Barbara Ln East Saint Louis, IL | 3.0 | 2.0 | 990 | $1,300 | $1.31 | 44d | 1 | 1.19mi |
| 13 Drexel Dr East Saint Louis, IL | 3.0 | 1.0 | 925 | $995 | $1.08 | 13d | 1 | 1.21mi |
| 701 Saint Paul Dr East Saint Louis, IL | 3.0 | 1.0 | 864 | $1,500 | $1.74 | 44d | 1 | 1.26mi |
| 70 W Adams Dr East Saint Louis, IL | 3.0 | 1.0 | 925 | $1,200 | $1.30 | 44d | 1 | 1.26mi |
| 850 Saint Bartholomew Dr Cahokia, IL | 3.0 | 1.0 | 1050 | $1,285 | $1.22 | 16d | 1 | 1.29mi |
| 811 Saint Thomas Ln East Saint Louis, IL | 3.0 | 1.0 | 1040 | $1,295 | $1.25 | 24d | 1 | 1.32mi |
| 121 Saint Dorothy Dr Cahokia, IL | 3.0 | 1.0 | 988 | $1,500 | $1.52 | 44d | 1 | 1.35mi |
| 2231 Loren St Cahokia Heights, IL | 2.0 | 1.0 | 1000 | $1,195 | $1.20 | 44d | 1 | 1.42mi |
| 705 Saint Martin Dr East Saint Louis, IL | 4.0 | 1.0 | 1033 | $1,600 | $1.55 | 22d | 1 | 1.48mi |
Listing history 9 events
-
2026-06-18days on market $100,000 Active 7 DOM
-
2026-06-17price $100,000 Active 6 DOM
-
2026-06-17days on market $105,000 Active 6 DOM
-
2026-06-16days on market $105,000 Active 5 DOM
-
2026-06-15days on market $105,000 Active 4 DOM
-
2026-06-13days on market $105,000 Active 2 DOM
-
2026-06-13status $105,000 Active 1 DOM
-
2026-06-10remarks 699-char remark
-
2026-06-10$105,000 Coming Soon 1 DOM
ⓘ Source: listings_history table (triggers on properties + properties_extension) + one-shot
backfill from property_details.listing_events for pre-trigger history.
Climate risk First Street
- Flood 1/10 Low FEMA zone X (shaded) · 0% chance over 30 yrs
- Wildfire 1/10 Low
- Heat 5/10 Major 7 d/yr ≥107°F today · 21 d/yr by 30 yrs out
- Wind 2/10 Low 100% chance of damaging wind over 30 yrs
- Air quality 3/10 Moderate 3 unhealthy d/yr today · 4 by 30 yrs out
Nearby sold comps map
Loading sold comps map…
Walkable amenities ~0.75 mi
Loading nearby amenities…
Taxation est. · year 1
- Rental income
- $16,408
- − Mortgage interest
- −$5,602
- − Property taxes
- −$1,500
- − Insurance
- −$500
- − Repairs & maintenance
- −$1,313
- − Management
- −$1,313
- − Depreciation
- −$2,909
- Taxable income
- $3,272
- Est. tax owed @ 24.0%
- −$785
- After-tax cash flow
- $3,884/yr
For passive investors: Depreciation is non-cash, so a rental often shows a tax loss while cash-flowing — sheltering income. Rental losses are passive: they offset passive income freely, and up to $25,000/yr can offset ordinary (W-2) income if you actively participate and your MAGI is under $100k (phasing out to $0 by $150k); unused losses carry forward. On sale, claimed depreciation is recaptured at up to 25%, and gains may owe capital-gains tax (a 1031 exchange can defer both). Figures are a year-1 estimate at your 24.0% rate — not tax advice; consult a CPA.
Schools (NCES district)
- District
- Cahokia CUSD 187
- NCES district ID
- 1708040
- Math proficiency
- 3% ▼ -2.00%
- Reading proficiency
- 5% ▬ 0.00%
- Median HH income
- $28,028
- Composite
- 6.44/100
- National rank
- #14827
- State rank
- #864 of 919 in IL
Livability — Cahokia Heights
No livability data for this city. (Only ~50 U.S. cities are tracked.)
Census & demographics
- Census place
- Cahokia Heights, IL
- County
- Saint Clair County · 169,691 people
- City population
- 19,956
- Metro
- St. Louis, MO-IL
- Population (ZIP)
- 12,959
- Household income
- $33,838
- Rent vs Own
- Severe rent burden
- 729.0
Population outlook (St. Clair County) Hauer SSP2
- Today (2025)
- 250,366 people
- By 2030
- 240,511 · -3.9%
- By 2040
- 217,391 · -13.2%
- By 2050
- 192,699 · -23.0%
- By 2075
- 140,637 · -43.8%
- By 2100
- 100,499 · -59.9%
Race, ethnicity, and origin ACS 2023
- Neighborhood character
- Diverse neighborhood (Simpson 0.56)
- Race & ethnicity
- Black 59% White 29% Two or more races 6% Hispanic / Latino 3% Asian 2%
- Common ancestry
- Romanian 2% Lithuanian 1% Iranian 1%
- Foreign-born
- 2% · China
- Languages at home
- 95% English-only · Spanish 3% Other Indo-European 1% Chinese 1%
Political lean MEDSL · St. Clair
- 2024 margin
- Lean D (+7.9) · D 53.0% · R 45.1% · Other 1.8%
- 2008→2024 swing
- -14.6pp toward R · 2008: 22.4pp · 2024: 7.9pp
- All cycles
- 2024: D+7.9 2020: D+8.7 2016: D+5.6 2012: D+14.5 2008: D+22.4
Not yet ingested
- Civics
- —
Market trends
- HPI YoY
- ▼ -33.26%
- Current HPI
- 131.5144
- Rent YoY
- —
- Metro
- St. Louis, MO-IL
- State GDP YoY
- ▲ 1.59%
- F500 in state
- 60
Industry mix (Fortune 500 HQ in IL)
| Industry | F500 HQs | Revenue |
|---|---|---|
| Insurance | 4 | $201B |
|
||
| Consumer Goods | 4 | $87B |
|
||
| Industrial Machinery | 3 | $64B |
|
||
| Healthcare | 2 | $55B |
|
||
| Retail / Pharmacy | 1 | $148B |
|
||
| Agriculture / Food | 1 | $86B |
|
||
Price history
1 event — show timeline
- 2026-06-10 Coming Soon $105,000 MARIS as Distributed by MLS Grid
Property tax history
-31.5%/yrLatest (2024): $17 · -99.1% YoY. Source: county tax records.
Cash-flow waterfall
monthlySold comps — $/sqft
last 12 mo · ≤1 miLoading sold comps…