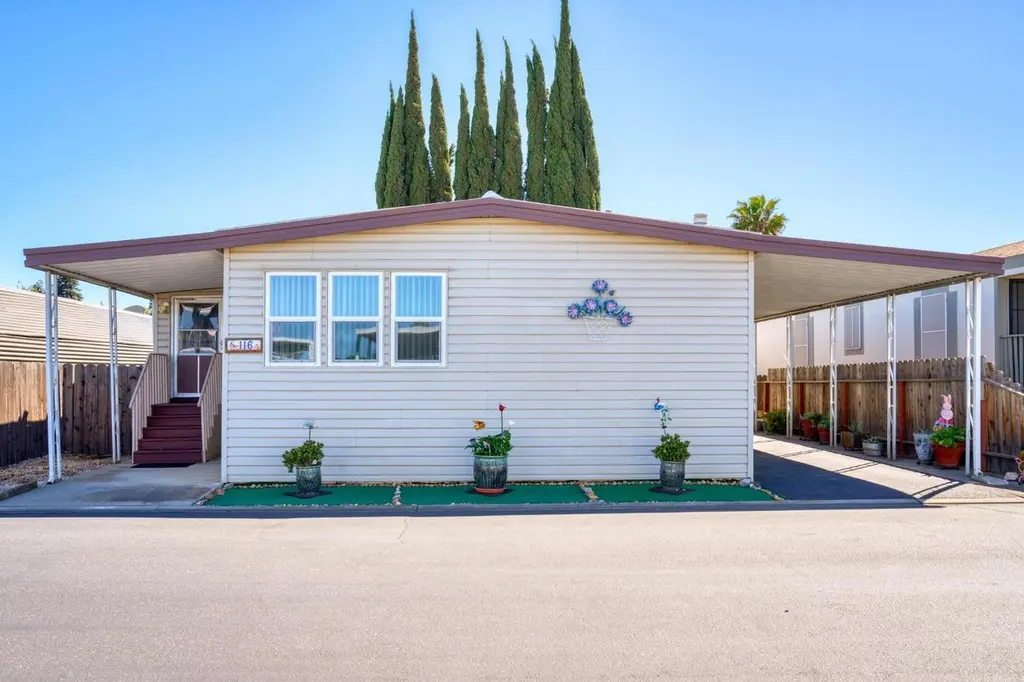
1830 E Yosemite Ave #116 · Manteca, CA
Flood risk 4/10 · Minor
- FEMA flood zone
- X (unshaded)
- Chance of flooding over 30 yrs
- 0.22%
- Est. flood insurance / yr
- $507 – $1,088
Fire risk 6/10 · Moderate
- Est. fire insurance / yr
- $659 – $1,223
Heat risk 7/10 · Major
- Hot days now (above 102°F)
- 7 days/yr
- Hot days in 30 yrs
- 15 days/yr
Wind risk 1/10 · Minimal
- Chance of severe wind over 30 yrs
- —
Air-quality risk 10/10 · Severe
- Unhealthy air days now
- 30 days/yr
- Unhealthy air days in 30 yrs
- 31 days/yr
Risk factors via First Street. Map © Google.
Why this score? — see what drove the C+ grade
The composite is a weighted blend of 9 inputs, each scored 0–100. Each bar is that input's sub-score; the figure is the points it added to the 100-point composite (weight × sub-score).
- Cash flow +30.0/30.0
- 1% rule +10.0/10.0
- DSCR +10.0/10.0
- Condition / age +3.8/5.0
- Livability +3.1/5.0
- Schools +2.9/10.0
- Rent growth +2.3/5.0
- ARV discount +1.4/15.0
- Appreciation +0.0/10.0
$149,950
🖨 Deal sheet (PDF) 📄 Offer letter ✓ Due diligence
Listing remarks
A Must See with updates throughout! Welcome to El Rancho Mobile Home Park, one of the best Senior Parks in the area with gated security. Nice open floor plan with great room concept and space for dining adjacent to your updated/remodeled kitchen. Kitchen consists of shaker style cabinets, pull outs, pantry, island, updated countertops and stainless-steel B/I appliances. There is also a space for formal dining! Both bedrooms have their own full bath and are on the opposite side of home for privacy. Large Master Suite with walk-in closet, full bath with dual sinks and slider to access backyard. Other bedroom is of good size as well. This home offers new windows throughout, updated kitchen, e
Key facts
- Open floor plan
- Gated security
- Formal dining space
Tags
Neighborhood map
What this means for you Summary
Snapshot
- This is a 2-bed/2.0-bath manufactured listed at $150k. Condition is rated good.
Deal economics
- At list price, monthly cash flow is $796 ($10k/yr) — positive.
- The deal already cash-flows at list — no discount required.
- Meets the 1% rule at list price ($2k rent vs $150k).
- Recommended offer: $145k (3.0% below list) — sets the bar for market timing.
- Cap rate 12.7% vs local median 2.7% in Manteca — top-decile yield for the area; either an underpriced asset or a hidden risk that comps aren't pricing in. Stress-test before assuming the spread holds.
Location & tenants
- Location reads 61/100 on livability (#535 in CA) — a middle-class / working-renter tenant base. Strengths: housing A+, employment A; Watch: schools D+, amenities D, commute F.
- Manteca Unified (suburban): math 15% / reading 48% proficiency, ranked #297 of 517 in CA (top 57%) — families likely to look elsewhere, expect single-tenant / working-renter base with shorter leases.
- Market conditions: Rents soft (-0.7%/yr); 270 active listings in the ZIP; 11 comparable units currently listed for rent nearby; rentals at typical pace (median 20d on market — plan ~3-4 weeks tenant-placement turnaround); solid renter incomes; 3,779 units permitted in San Joaquin County in 2024 (0 in 5+ unit buildings).
- This rent runs 31% of the median local income ($89k/yr) — at the standard rent-burdened threshold; future hikes will face affordability resistance.
Forward outlook
- Local home prices are declining (-3.0%/yr); year-one equity from $1k of loan paydown is wiped out by about $4k of value loss. Plan a longer hold.
- San Joaquin County population projected at +17% by 2050 — long-run rental-demand tailwind backs the buy-and-hold thesis.
- At projected returns (-3.0% appreciation + 0.0% rent growth), your $42k cash investment doubles in ~7 years — after that, you're playing with house money.
Negotiation context
- It's been on market 52 days — a 3% lower offer ($145k) is reasonable based on typical stale-listing flexibility.
Risks & watch-outs
- Climate carrying-cost: major wildfire risk; extreme-heat days projected 7→15/yr by 2055 (HVAC capex compounding) — expect insurance premiums to compound above CPI over the hold.
Questions for the listing agent
- It's been on market 52 days. Have you received any prior offers? Is the seller open to a 3% concession, seller financing, or rate buy-down credit?
- Built in 1974 — when were the roof, HVAC, electrical panel, plumbing, and water heater last replaced?
- Is there a deadline driving the sale (1031 exchange, divorce, estate, relocation)? That informs how much negotiation room exists.
- Schools are D-rated, which usually means shorter tenancies and higher turnover. Who's the typical renter profile here, and what's been the actual vacancy rate?
- What's the average days-on-market for RENTAL listings here right now (not sales)? A rising rental-DOM trend means longer vacancies and softer asking-rent achievability than the comps imply.
- What's the recent tenant-quality profile in this submarket — average credit score on applications, eviction rate, late-payment / NSF rate, and stable-employment percentage? A property-management company in the area should have these aggregated.
- How much new for-sale + rental construction is in the pipeline within 1–3 miles? Heavy new supply typically softens prices + rents 12–24 months out; constrained supply supports both.
Investment metrics
- 1% rule
- 1.55% ✓
- Cap rate
- 12.67%
- Cash-on-cash
- 22.76%
- DSCR
- 2.01
- GRM
- 5.4
CMA / ARV
- ARV (median comp)
- $132,002
- List price
- $149,950
- Delta
- 13.60%
- Verdict
- OVERPRICED
- Comps
- 12 within 1.0 mi
Show comp detail 12 sales within ~0.75 mi
| Address | Dist | Beds/Ba | Sqft | Sold | Price | $/sf | Match |
|---|---|---|---|---|---|---|---|
| 1830 E Yosemite #128 | 0.02mi | 2/2.0 | 1,440 (0%) | 2mo | $100,000 | $69 | 97 |
| 1830 Yosemite Ave #4 | 0.00mi | 2/2.0 | 1,344 (-7%) | 2mo | $131,000 | $97 | 88 |
| 1830 E Yosemite Ave #275 | 0.00mi | 2/2.0 | 1,500 (+4%) | 8mo | $114,000 | $76 | 87 |
| 1830 E Yosemite Ave #1 | 0.06mi | 2/2.0 | 1,444 (+0%) | 14mo | $232,000 | $161 | 85 |
| 1830 E Yosemite Ave #257 | 0.00mi | 2/2.0 | 1,488 (+3%) | 11mo | $143,500 | $96 | 85 |
| 1830 E Yosemite #207 | 0.00mi | 2/2.0 | 1,536 (+7%) | 7mo | $148,000 | $96 | 83 |
| 1830 E Yosemite Ave #137 | 0.00mi | 3/2.0 (+1) | 1,440 (0%) | 17mo | $125,000 | $87 | 81 |
| 1830 E Yosemite Ave #68 | 0.02mi | 2/2.0 | 1,300 (-10%) | 6mo | $135,000 | $104 | 78 |
| 1830 Yosemite Ave #118 | 0.04mi | 2/2.0 | 1,624 (+13%) | 10mo | $207,000 | $127 | 68 |
| 150 Pestana Ave #25 | 0.29mi | 3/2.0 (+1) | 1,440 (0%) | 16mo | $125,000 | $87 | 68 |
| 150 Pestana #34 | 0.34mi | 3/2.0 (+1) | 1,440 (0%) | 19mo | $149,888 | $104 | 64 |
| 150 Pestana #21 | 0.30mi | 2/1.5 | 1,248 (-13%) | 6mo | $87,000 | $70 | 57 |
Match score weights: distance 35% · size 25% · config 20% · recency 20%. Top-matched comps best support the ARV.
Projected returns pro-forma
-3.0% appreciation · 0.0% rent growth · sell at horizon
- IRR
- 12.2%
- Equity multiple
- 1.47×
- Total profit
- $19,664
- Equity at exit
- $22,358
- IRR
- 18.7%
- Equity multiple
- 2.34×
- Total profit
- $56,309
- Equity at exit
- $12,965
Cash invested: $41,986 (down + closing). Projections, not guarantees.
Landlord ↔ Tenant lean methodology
- Overall (STATE)
- 18 Strongly Tenant-Friendly
- State California
- 18 Strongly Tenant-Friendly · D+13
- County
- — inherits STATE
- City
- — inherits STATE
ZIP-level market 95336
- Rents YoY
- -0.7%
- Active inventory
- 270
- Price-to-rent
- 5.4×
Monthly cashflow live
- Estimated rent
- $2,320 high interval (Pro) →
- Mortgage (P&I)
- −$786
- Tax est. 1.5%
- −$187 /mo · $2,249/yr
- Insurance
- −$62
- HOA
- −$0
- Vacancy / Maint / Mgmt
- −$487
- Net cashflow
- $796
Break-even live
Sensitivity live
| Price | -10% $900 | -5% $848 | +0% $796 | +5% $745 | +10% $693 |
|---|---|---|---|---|---|
| Rent | -10% $613 | -5% $705 | +0% $796 | +5% $888 | +10% $980 |
| Rate | -1.0pp $872 | -0.5pp $835 | base $796 | +0.5pp $758 | +1.0pp $718 |
UW: 25.0% down · 7.5% · 30yr · 1.5% tax · 5.0% vac · 8.0% maint · 8.0% mgmt
Financing live
Cash to close
- Down payment
- $37,488
- Closing costs
- $4,498
- Reserves months
- —
- Total cash needed
- —
Loan-product check · same deal, 3 products live
Conventional
25% down · 7.5% · 30yr
- Down + closing
- —
- Monthly P&I
- —
- Monthly cashflow
- —
- DSCR
- —
- Eligible?
- —
Personal DTI + credit; lowest rate.
DSCR
20% down · 8.5% · 30yr
- Down + closing
- —
- Monthly P&I
- —
- Monthly cashflow
- —
- DSCR
- —
- Eligible?
- —
No personal income docs; deal must DSCR.
Hard money
10% down · 12.0% · 12mo
- Down + closing
- —
- Monthly P&I
- —
- Monthly cashflow
- —
- DSCR
- —
- Eligible?
- —
Short-term bridge; refi at stabilization.
Rent comps 11 comps
| Address | Beds | Baths | Sqft | Rent | $/sqft | DOM | Units | Dist |
|---|---|---|---|---|---|---|---|---|
| 1815 Azure Ct Unit C Manteca, CA | 2.0 | 2.0 | 1400 | $1,800 | $1.29 | 19d | 1 | 0.30mi |
| 2054 Hyannis Cir Manteca, CA | 3.0 | 2.0 | 1664 | $2,495 | $1.50 | 19d | 1 | 0.31mi |
| 200 Northwoods Ave Manteca, CA | 2.0 | 1.0 | 900 | $1,675 | $1.86 | 4d | 1 | 0.40mi |
| 1634 Sierra Creek Dr Manteca, CA | 3.0 | 2.0 | 1411 | $3,100 | $2.20 | 19d | 1 | 0.79mi |
| 311 Charles Ave Manteca, CA | 3.0 | 2.0 | 1092 | $2,750 | $2.52 | 24d | 1 | 0.83mi |
| 794 Button Ave Manteca, CA | 2.0 | 2.0 | 1075 | $2,300 | $2.14 | 15d | 1 | 1.05mi |
| 1005 E Atherton Dr Manteca, CA | 1.0–3.0 | 1.0–2.0 | 1008 | $2,495 | $2.47 | 0d | 6 | 1.15mi |
| 801 Atherton Dr Manteca, CA | 1.0–2.0 | 1.0–2.0 | 977 | $2,695 | $2.76 | 3d | 8 | 1.26mi |
| 522 Dawn Dr Manteca, CA | 3.0 | 2.5 | 1687 | $2,500 | $1.48 | 44d | 1 | 1.30mi |
| 225 N Fremont St Manteca, CA | 2.0 | 2.0 | 926 | $1,875 | $2.02 | 44d | 1 | 1.31mi |
| 708 Meadow Way Manteca, CA | 3.0 | 2.0 | 1843 | $2,750 | $1.49 | 15d | 1 | 1.45mi |
Climate risk First Street
- Flood 4/10 Moderate FEMA zone X (unshaded) · 22% chance over 30 yrs
- Wildfire 6/10 Major
- Heat 7/10 Severe 7 d/yr ≥102°F today · 15 d/yr by 30 yrs out
- Wind 1/10 Low
- Air quality 10/10 Extreme 30 unhealthy d/yr today · 31 by 30 yrs out
Nearby sold comps map
Loading sold comps map…
Walkable amenities ~0.75 mi
Loading nearby amenities…
Taxation est. · year 1
- Rental income
- $27,839
- − Mortgage interest
- −$8,400
- − Property taxes
- −$2,249
- − Insurance
- −$750
- − Repairs & maintenance
- −$2,227
- − Management
- −$2,227
- − Depreciation
- −$4,362
- Taxable income
- $7,624
- Est. tax owed @ 24.0%
- −$1,830
- After-tax cash flow
- $7,728/yr
For passive investors: Depreciation is non-cash, so a rental often shows a tax loss while cash-flowing — sheltering income. Rental losses are passive: they offset passive income freely, and up to $25,000/yr can offset ordinary (W-2) income if you actively participate and your MAGI is under $100k (phasing out to $0 by $150k); unused losses carry forward. On sale, claimed depreciation is recaptured at up to 25%, and gains may owe capital-gains tax (a 1031 exchange can defer both). Figures are a year-1 estimate at your 24.0% rate — not tax advice; consult a CPA.
Condition & rehab AI · 12 photos
This manufactured home is in good condition with recent updates, making it a solid investment with potential for both resale and rental value.
Value-add opportunities
- Resale Paint exterior siding — Enhances curb appeal and value
- Rental Replace carpet — Fresh carpet improves tenant satisfaction and retention
Renovation cost estimate screening
Value-add ROI direction
- Resale Paint exterior siding — Enhances curb appeal and value ↑
- Rental Replace carpet — Fresh carpet improves tenant satisfaction and retention ↑
ⓘ Cost ranges are severity-bucket heuristics (US national rule-of-thumb). Get contractor quotes + a written scope before underwriting a rehab budget.
Schools (NCES district)
- District
- Manteca Unified
- NCES district ID
- 0623610
- Math proficiency
- 15% ▼ -14.00%
- Reading proficiency
- 48% ▬ 0.00%
- Median HH income
- $62,426
- Composite
- 28.5/100
- National rank
- #6737
- State rank
- #297 of 517 in CA
Livability — Manteca
- Score
- 61/100
- State rank
- #535
- US rank
- #17877
Category grades
Schools grade is shown separately in the Schools card above.
Census & demographics
- Census place
- Manteca, CA
- County
- San Joaquin County · 729,570 people
- City population
- 98,916
- Metro
- Stockton, CA
- Population (ZIP)
- 50,185
- Household income
- $89,172
- Rent vs Own
- Severe rent burden
- 876.0
Population outlook (San Joaquin County) Hauer SSP2
- Today (2025)
- 796,965 people
- By 2030
- 828,849 · +4.0%
- By 2040
- 885,611 · +11.1%
- By 2050
- 929,798 · +16.7%
- By 2075
- 994,578 · +24.8%
- By 2100
- 971,291 · +21.9%
Race, ethnicity, and origin ACS 2023
- Neighborhood character
- Diverse neighborhood (Simpson 0.63)
- Race & ethnicity
- Hispanic / Latino 43% White 42% Two or more races 18% Asian 7% Black 2%
- Hispanic origin (detail)
- Mexican 37%
- Common ancestry
- Russian 3% Lithuanian 2% Slovak 1%
- Foreign-born
- 17% · Canada
- Languages at home
- 69% English-only · Spanish 23% Other Asian/Pacific 3% Other Indo-European 2%
Political lean MEDSL · San Joaquin
- 2024 margin
- Toss-up / Even · D 48.0% · R 48.9% · Other 3.0%
- 2008→2024 swing
- -11.6pp toward R · 2008: 10.7pp · 2024: -0.9pp
- All cycles
- 2024: R+0.9 2020: D+13.9 2016: D+12.9 2012: D+8.9 2008: D+10.7
Not yet ingested
- Civics
- —
Market trends
- HPI YoY
- ▼ -407.05%
- Current HPI
- 268.5708
- Rent YoY
- ▼ -0.68%
- Metro
- Stockton, CA
- State GDP YoY
- ▲ 3.21%
- F500 in state
- 116
Industry mix (Fortune 500 HQ in CA)
| Industry | F500 HQs | Revenue |
|---|---|---|
| Technology | 27 | $1,492B |
|
||
| Financial Services | 3 | $174B |
|
||
| Retail | 3 | $44B |
|
||
| Insurance | 3 | $26B |
|
||
| Media / Entertainment | 2 | $115B |
|
||
| Pharmaceuticals / Biotech | 2 | $62B |
|
||
Cash-flow waterfall
monthlySold comps — $/sqft
last 12 mo · ≤1 miLoading sold comps…