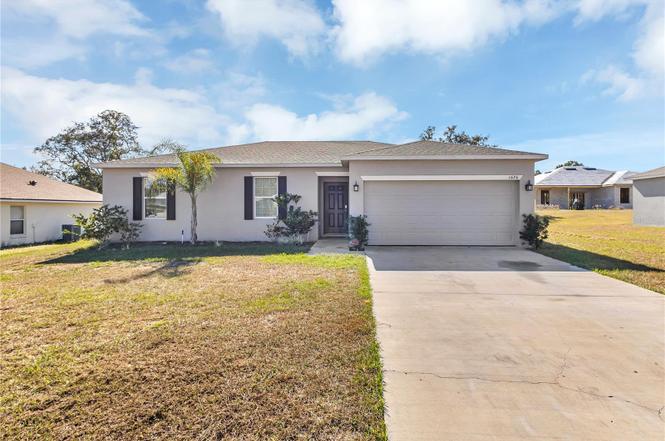
1626 Redfin Dr · Poinciana, FL
Flood risk 1/10 · Minimal
- FEMA flood zone
- X (unshaded)
- Chance of flooding over 30 yrs
- 0.0%
- Est. flood insurance / yr
- $507 – $1,088
Fire risk 5/10 · Moderate
- Est. fire insurance / yr
- $947 – $1,759
Heat risk 9/10 · Severe
- Hot days now (above 108°F)
- 7 days/yr
- Hot days in 30 yrs
- 24 days/yr
Wind risk 9/10 · Severe
- Chance of severe wind over 30 yrs
- 99.0%
Air-quality risk 1/10 · Minimal
- Unhealthy air days now
- 0 days/yr
- Unhealthy air days in 30 yrs
- 0 days/yr
Risk factors via First Street. Map © Google.
Why this score? — see what drove the D- grade
The composite is a weighted blend of 9 inputs, each scored 0–100. Each bar is that input's sub-score; the figure is the points it added to the 100-point composite (weight × sub-score).
- Cash flow +9.1/30.0
- ARV discount +7.5/15.0
- Appreciation +4.3/10.0
- Schools +3.5/10.0
- 1% rule +3.3/10.0
- Livability +2.9/5.0
- Rent growth +2.8/5.0
- DSCR +2.5/10.0
- Condition / age +2.5/5.0
$235,000
🖨 Deal sheet (PDF) 📄 Offer letter ✓ Due diligence
Listing remarks
Under contract-accepting backup offers. BEAUTIFUL HOME ON SHORT SALE — GREAT OPPORTUNITY! ? Experience modern comfort in this beautiful 3-bedroom, 2-bathroom single-family home built in 2021. This move-in-ready residence offers 1,286 sq. ft. of bright, open living space designed for effortless entertaining and everyday convenience. Enjoy a spacious kitchen, a private primary suite, a flexible floor plan, and a built-in Smart Home system for enhanced comfort and security. The large backyard provides plenty of space for outdoor activities, gardening, or future upgrades, while the attached 2-car garage offers added storage and convenience. Located in the desirable Association of Poincia
Key facts
- Community amenities
- Spacious kitchen
- Large backyard
Tags
Property features AI
Finance
- Other: Owner-occupied (homestead indicated)
- HOA & community: Monthly HOA fee of $140 (The Poinciana Community); Association fees are required; Pets allowed
Exterior
- Parking: Attached garage with 2 spaces
- Utilities: Public water; Public sewer; Electricity connected; Water connected
- Home design: Single Family Residence; One-story; South-facing
- Construction: Block and stucco construction; Shingle roof; Slab foundation; Built by Moranda Homes
- Exterior features: Irrigation equipment; Paved road access; Lot approximately 0.18 acres
Interior
- Kitchen: Dishwasher; Disposal; Microwave; Range hood; Refrigerator
- Bedrooms: 3 bedrooms
- Flooring: Carpet; Ceramic tile
- Bathrooms: 2 full bathrooms
- Heating & cooling: Central heating; Central air conditioning
- Interior features: Central heating; Central air conditioning; Dishwasher; Disposal; Electric water heater; Microwave; Range hood; Refrigerator
- Laundry & utility: Washer hookup; Electric dryer hookup; Dedicated laundry room
Neighborhood map
What this means for you Summary
Snapshot
- This is a 3-bed/2.0-bath single-family listed at $235k.
Deal economics
- At list price, monthly cash flow is $-179 ($-2k/yr) — negative.
- To cash-flow at today's rent, offer at most $203k (13.4% below list).
- To meet the 1% rule (rent ≥ 1% of price), the offer needs to be $194k (17.5% below list).
- Recommended offer: $194k (17.5% below list) — sets the bar for 1% rule.
- Cap rate 5.4% vs local median 4.3% in Poinciana — meaningfully above typical; check what's discounted (condition, days-on-market, listing class) to confirm the premium yield is real.
Location & tenants
- Location reads 57/100 on livability (#859 in FL) — a working-class tenant base; expect higher turnover. Strengths: cost of living A+, housing A+; Watch: employment D+, schools F, amenities F.
- Polk (suburban): math 39% / reading 43% proficiency, ranked #62 of 73 in FL (top 85%) — families likely to look elsewhere, expect single-tenant / working-renter base with shorter leases.
- Market conditions: Rents rising (+1.1%/yr); 1151 active listings in the ZIP; 40 comparable units currently listed for rent nearby; rentals at typical pace (median 22d on market — plan ~3-4 weeks tenant-placement turnaround); 10,384 units permitted in Polk County in 2024 (1,716 in 5+ unit buildings).
- This rent runs 34% of the median local income ($69k/yr) — at the standard rent-burdened threshold; future hikes will face affordability resistance.
Forward outlook
- Local home prices are declining (-1.5%/yr); year-one equity from $2k of loan paydown is wiped out by about $3k of value loss. Plan a longer hold.
- Polk County population projected at +33% by 2050 — long-run rental-demand tailwind backs the buy-and-hold thesis.
Negotiation context
- It's been on market 122 days — a 12% lower offer ($207k) is reasonable based on typical stale-listing flexibility.
- 4 sale attempts since 4y ago; this cycle's ask has dropped $40k (15%) from the opening price — seller is motivated, your offer sets the floor, not the list.
Risks & watch-outs
- Climate carrying-cost: severe wind risk, 99% chance of damaging wind over 30y; moderate wildfire risk; extreme-heat days projected 7→24/yr by 2055 (HVAC capex compounding) — expect insurance premiums to compound above CPI over the hold.
Questions for the listing agent
- What do current leases actually rent for vs. the listed asking? Can we see a recent rent roll and the last 12 months of T-12 income?
- It's been on market 122 days. Have you received any prior offers? Is the seller open to a 17% concession, seller financing, or rate buy-down credit?
- What does the HOA fee cover, when was the last increase, and are there any pending special assessments or reserve-fund shortfalls?
- Why hasn't it sold? Are there any deal-killer items the seller is aware of (foundation, flood, title, zoning, code violations)?
- Is there a deadline driving the sale (1031 exchange, divorce, estate, relocation)? That informs how much negotiation room exists.
- Schools are F-rated, which usually means shorter tenancies and higher turnover. Who's the typical renter profile here, and what's been the actual vacancy rate?
- The area grade is low — what's the realistic commute time and amenity access for the typical tenant pool here? Any planned neighborhood developments (good or bad) we should know about?
- What's the average days-on-market for RENTAL listings here right now (not sales)? A rising rental-DOM trend means longer vacancies and softer asking-rent achievability than the comps imply.
- What's the recent tenant-quality profile in this submarket — average credit score on applications, eviction rate, late-payment / NSF rate, and stable-employment percentage? A property-management company in the area should have these aggregated.
- How much new for-sale + rental construction is in the pipeline within 1–3 miles? Heavy new supply typically softens prices + rents 12–24 months out; constrained supply supports both.
Investment metrics
- 1% rule
- 0.83% ✗
- Cap rate
- 5.38%
- Cash-on-cash
- -3.26%
- DSCR
- 0.85
- GRM
- 10.1
CMA / ARV
No comps found within radius.
Projected returns pro-forma
-1.48% appreciation · 1.14% rent growth · sell at horizon
- IRR
- -14.1%
- Equity multiple
- 0.43×
- Total profit
- $-37,590
- Equity at exit
- $51,376
- IRR
- -9.2%
- Equity multiple
- 0.28×
- Total profit
- $-47,074
- Equity at exit
- $49,512
Cash invested: $65,800 (down + closing). Projections, not guarantees.
Landlord ↔ Tenant lean methodology
- Overall (STATE)
- 87 Strongly Landlord-Friendly
- State Florida
- 87 Strongly Landlord-Friendly · R+3
- County
- — inherits STATE
- City
- — inherits STATE
ZIP-level market 34759
- Home prices YoY
- -0.5%
- Rents YoY
- 1.1%
- Active inventory
- 1151
- Price-to-rent
- 10.1×
Monthly cashflow live
- Estimated rent
- $1,939 high interval (Pro) →
- Mortgage (P&I)
- −$1,232
- Tax from tax record
- −$241 /mo · $2,887/yr
- Insurance
- −$98
- HOA
- −$140
- Vacancy / Maint / Mgmt
- −$407
- Net cashflow
- $-179
Break-even live
Sensitivity live
| Price | -10% $-46 | -5% $-112 | +0% $-179 | +5% $-245 | +10% $-312 |
|---|---|---|---|---|---|
| Rent | -10% $-332 | -5% $-255 | +0% $-179 | +5% $-102 | +10% $-26 |
| Rate | -1.0pp $-60 | -0.5pp $-119 | base $-179 | +0.5pp $-240 | +1.0pp $-302 |
UW: 25.0% down · 7.5% · 30yr · 1.5% tax · 5.0% vac · 8.0% maint · 8.0% mgmt
Financing live
Cash to close
- Down payment
- $58,750
- Closing costs
- $7,050
- Reserves months
- —
- Total cash needed
- —
Loan-product check · same deal, 3 products live
Conventional
25% down · 7.5% · 30yr
- Down + closing
- —
- Monthly P&I
- —
- Monthly cashflow
- —
- DSCR
- —
- Eligible?
- —
Personal DTI + credit; lowest rate.
DSCR
20% down · 8.5% · 30yr
- Down + closing
- —
- Monthly P&I
- —
- Monthly cashflow
- —
- DSCR
- —
- Eligible?
- —
No personal income docs; deal must DSCR.
Hard money
10% down · 12.0% · 12mo
- Down + closing
- —
- Monthly P&I
- —
- Monthly cashflow
- —
- DSCR
- —
- Eligible?
- —
Short-term bridge; refi at stabilization.
Rent comps 40 comps
| Address | Beds | Baths | Sqft | Rent | $/sqft | DOM | Units | Dist |
|---|---|---|---|---|---|---|---|---|
| 1658 Redfin Dr Kissimmee, FL | 4.0 | 2.0 | 1661 | $1,810 | $1.09 | 3d | 1 | 0.05mi |
| 1660 Redfin Dr Kissimmee, FL | 4.0 | 2.0 | 1661 | $1,975 | $1.19 | 3d | 1 | 0.06mi |
| 1662 Redfin Dr Kissimmee, FL | 4.0 | 2.5 | 1852 | $1,940 | $1.05 | 24d | 1 | 0.08mi |
| 1701 Pilchard Dr Kissimmee, FL | 4.0 | 2.0 | 1720 | $2,050 | $1.19 | 24d | 1 | 0.20mi |
| 1613 Sail Dr Kissimmee, FL | 3.0 | 2.0 | 1711 | $1,625 | $0.95 | 24d | 1 | 0.23mi |
| 1731 Minnow Ct Kissimmee, FL | 3.0 | 2.0 | 1209 | $1,750 | $1.45 | 24d | 1 | 0.28mi |
| 1637 Sail Dr Kissimmee, FL | 3.0 | 2.0 | 1250 | $1,720 | $1.38 | 3d | 1 | 0.31mi |
| 116 Sail Way Kissimmee, FL | 4.0 | 2.0 | 1661 | $1,805 | $1.09 | 12d | 1 | 0.32mi |
| 1707 Sail Ct Kissimmee, FL | 4.0 | 2.5 | 1823 | $2,015 | $1.11 | 3d | 1 | 0.33mi |
| 223 Grouper Ct Kissimmee, FL | 3.0 | 2.0 | 1475 | $1,595 | $1.08 | 24d | 1 | 0.38mi |
| 241 Grouper Ct Kissimmee, FL | 4.0 | 2.0 | 1762 | $2,000 | $1.14 | 24d | 1 | 0.42mi |
| 202 Snapper Way Kissimmee, FL | 4.0 | 2.0 | 1670 | $2,050 | $1.23 | 3d | 1 | 0.44mi |
| 260 Grouper Ct Kissimmee, FL | 2.0 | 2.0 | 1130 | $1,400 | $1.24 | 3d | 1 | 0.45mi |
| 1884 Snapper Dr Kissimmee, FL | 4.0 | 2.0 | 1682 | $1,985 | $1.18 | 15d | 1 | 0.50mi |
| 205 Dogfish Ln Kissimmee, FL | 4.0 | 2.0 | 1578 | $1,680 | $1.06 | 14d | 1 | 0.52mi |
| 10 Trout Way Unit B Poinciana, FL | 3.0 | 2.0 | 1162 | $1,749 | $1.51 | 21d | 1 | 0.53mi |
| 10 Trout Way Unit A Kissimmee, FL | 3.0 | 2.0 | 1162 | $1,750 | $1.51 | 24d | 1 | 0.53mi |
| 12 Trout Way Unit A Kissimmee, FL | 3.0 | 2.0 | 1162 | $1,750 | $1.51 | 21d | 1 | 0.54mi |
| 12 Trout Way Unit B Kissimmee, FL | 3.0 | 2.0 | 1162 | $1,750 | $1.51 | 24d | 1 | 0.54mi |
| 16 Trout Way Kissimmee, FL | 3.0 | 2.0 | 1304 | $1,775 | $1.36 | 3d | 1 | 0.57mi |
| 12 Herring Ct Kissimmee, FL | 3.0 | 2.0 | 1055 | $1,613 | $1.53 | 24d | 1 | 0.58mi |
| 106 Herring Ln Kissimmee, FL | 3.0 | 2.0 | 1062 | $1,575 | $1.48 | 3d | 1 | 0.58mi |
| 104 Herring Ln Kissimmee, FL | 4.0 | 2.0 | 1699 | $1,925 | $1.13 | 3d | 1 | 0.58mi |
| 21 Trout Way Unit A Poinciana, FL | 3.0 | 2.0 | 1162 | $1,750 | $1.51 | 24d | 1 | 0.60mi |
| 352 Kingfish Dr Kissimmee, FL | 4.0 | 2.0 | 1670 | $1,950 | $1.17 | 24d | 1 | 0.73mi |
| 320 Kingfish Dr Kissimmee, FL | 3.0 | 3.0 | 1606 | $1,795 | $1.12 | 24d | 1 | 0.73mi |
| 308 Bass Ct Kissimmee, FL | 3.0 | 2.0 | 1613 | $1,850 | $1.15 | 24d | 1 | 0.74mi |
| 308 Bass Ct Kissimmee, FL | 4.0 | 2.0 | 1614 | $2,100 | $1.30 | 3d | 1 | 0.74mi |
| 310 Dogfish Way Kissimmee, FL | 4.0 | 2.0 | 1700 | $1,950 | $1.15 | 24d | 1 | 0.75mi |
| 5 Flatfish Dr Kissimmee, FL | 4.0 | 2.0 | 1650 | $2,150 | $1.30 | 24d | 1 | 0.76mi |
| 321 Drum Ln Poinciana, FL | 3.0 | 2.0 | 1785 | $1,715 | $0.96 | 19d | 1 | 0.77mi |
| 1406 Orlando Pl Poinciana, FL | 3.0 | 2.0 | 1257 | $1,450 | $1.15 | 3d | 1 | 0.77mi |
| 8 Flatfish Dr Kissimmee, FL | 3.0 | 2.0 | 1392 | $1,650 | $1.19 | 3d | 1 | 0.80mi |
| 313 Amberjack Ct Kissimmee, FL | 3.0 | 2.0 | 1243 | $1,750 | $1.41 | 24d | 1 | 0.86mi |
| 149 Conch Dr Kissimmee, FL | 3.0 | 2.0 | 1578 | $1,700 | $1.08 | 19d | 1 | 0.98mi |
| 1364 Congo Dr Kissimmee, FL | 4.0 | 2.0 | 1667 | $1,750 | $1.05 | 3d | 1 | 1.02mi |
| 557 Peace Dr Kissimmee, FL | 3.0 | 2.0 | 1547 | $1,699 | $1.10 | 3d | 1 | 1.04mi |
| 1907 Manatee Dr Kissimmee, FL | 4.0 | 2.0 | 1803 | $1,795 | $1.00 | 24d | 1 | 1.06mi |
| 1805 Hudson Ct Kissimmee, FL | 3.0 | 2.0 | 1531 | $1,835 | $1.20 | 24d | 1 | 1.08mi |
| 1417 Kissimmee Ct Kissimmee, FL | 3.0 | 2.0 | 1535 | $1,629 | $1.06 | 24d | 1 | 1.08mi |
HOA detail
- Monthly dues
- $140 · $1,680/yr
- Likely covers
- security
Listing history 11 events
-
2026-05-12status Active
-
2026-04-11status Pending
-
2026-03-18price $235,000
-
2026-03-18status Active
-
2026-02-18historical
-
2026-02-04price $260,000
-
2026-01-06price $270,000
-
2025-11-28$275,000 Active
-
2022-08-21soldstatus $220,240
-
2022-08-21$220,240
-
2021-01-27soldstatus $30,000
ⓘ Source: listings_history table (triggers on properties + properties_extension) + one-shot
backfill from property_details.listing_events for pre-trigger history.
Tax reassessment forecast FL · Resets to sale price
- Current annual tax
- $2,887 · $241/mo
- Projected year-2 tax
- $2,887 · $241/mo
- Expected delta
- $0/yr ($0/mo · 0.0%)
ⓘ Screening estimate from a state-policy table — verify with the county assessor before closing.
Climate risk First Street
- Flood 1/10 Low FEMA zone X (unshaded) · 0% chance over 30 yrs
- Wildfire 5/10 Major
- Heat 9/10 Extreme 7 d/yr ≥108°F today · 24 d/yr by 30 yrs out
- Wind 9/10 Extreme 99% chance of damaging wind over 30 yrs
- Air quality 1/10 Low 0 unhealthy d/yr today · 0 by 30 yrs out
Nearby sold comps map
Loading sold comps map…
Walkable amenities ~0.75 mi
Loading nearby amenities…
Taxation est. · year 1
- Rental income
- $23,272
- − Mortgage interest
- −$13,164
- − Property taxes
- −$2,887
- − Insurance
- −$1,175
- − Repairs & maintenance
- −$1,862
- − Management
- −$1,862
- − HOA
- −$1,680
- − Depreciation
- −$6,836
- Taxable loss
- −$6,193
- Est. tax savings @ 24.0%
- +$1,486
- After-tax cash flow
- $-659/yr
For passive investors: Depreciation is non-cash, so a rental often shows a tax loss while cash-flowing — sheltering income. Rental losses are passive: they offset passive income freely, and up to $25,000/yr can offset ordinary (W-2) income if you actively participate and your MAGI is under $100k (phasing out to $0 by $150k); unused losses carry forward. On sale, claimed depreciation is recaptured at up to 25%, and gains may owe capital-gains tax (a 1031 exchange can defer both). Figures are a year-1 estimate at your 24.0% rate — not tax advice; consult a CPA.
Schools (NCES district)
- District
- Polk
- NCES district ID
- 1201590
- Math proficiency
- 39% ▼ -11.00%
- Reading proficiency
- 43% ▼ -4.00%
- Median HH income
- $43,979
- Composite
- 34.74/100
- National rank
- #5132
- State rank
- #62 of 73 in FL
Livability — Poinciana
- Score
- 57/100
- State rank
- #859
- US rank
- #21760
Category grades
Schools grade is shown separately in the Schools card above.
Census & demographics
- Census place
- Poinciana, FL
- County
- Polk County · 740,051 people
- City population
- 91,336
- Metro
- Lakeland-Winter Haven, FL
- Population (ZIP)
- 44,568
- Household income
- $69,373
- Rent vs Own
- Severe rent burden
- 1186.0
Population outlook (Polk County) Hauer SSP2
- Today (2025)
- 752,975 people
- By 2030
- 804,621 · +6.9%
- By 2040
- 906,117 · +20.3%
- By 2050
- 1,000,476 · +32.9%
- By 2075
- 1,197,520 · +59.0%
- By 2100
- 1,271,518 · +68.9%
Race, ethnicity, and origin ACS 2023
- Neighborhood character
- Diverse neighborhood (Simpson 0.62)
- Race & ethnicity
- Hispanic / Latino 55% White 21% Two or more races 20% Black 19%
- Hispanic origin (detail)
- Mexican 2% Puerto Rican 38% Cuban 6% Dominican 3%
- Common ancestry
- Hispanic 3% Romanian 2% Scotch-Irish 1%
- Foreign-born
- 17% · Canada, Jamaica
- Languages at home
- 49% English-only · Spanish 48% French/Haitian/Cajun 2%
Political lean MEDSL · Polk
- 2024 margin
- Strong R (+20.7) · D 39.2% · R 59.9%
- 2008→2024 swing
- -14.6pp toward R · 2008: -6.1pp · 2024: -20.7pp
- All cycles
- 2024: R+20.7 2020: R+14.4 2016: R+14.1 2012: R+6.8 2008: R+6.1
Not yet ingested
- Civics
- —
Market trends
- HPI YoY
- ▼ -1.48%
- Current HPI
- 276.6861
- Rent YoY
- ▲ 1.14%
- Metro
- Lakeland-Winter Haven, FL
- State GDP YoY
- ▲ 3.28%
- F500 in state
- 36
Industry mix (Fortune 500 HQ in FL)
| Industry | F500 HQs | Revenue |
|---|---|---|
| Industrial Technology | 2 | $29B |
|
||
| Insurance | 2 | $17B |
|
||
| Retail | 1 | $60B |
|
||
| Technology Distribution | 1 | $58B |
|
||
| Homebuilding | 1 | $35B |
|
||
| Technology Manufacturing | 1 | $35B |
|
||
Price history
+683.3% since first listed11 events — show timeline
- 2026-05-12 Relisted — Stellar MLS as Distributed by MLS Grid
- 2026-04-11 Pending — Stellar MLS as Distributed by MLS Grid
- 2026-03-18 Price Changed $235,000 Stellar MLS as Distributed by MLS Grid
- 2026-03-18 Relisted — Stellar MLS as Distributed by MLS Grid
- 2026-02-18 Listing Removed — Stellar MLS as Distributed by MLS Grid
- 2026-02-04 Price Changed $260,000 Stellar MLS as Distributed by MLS Grid
- 2026-01-06 Price Changed $270,000 Stellar MLS as Distributed by MLS Grid
- 2025-11-28 Listed $275,000 Stellar MLS as Distributed by MLS Grid
- 2022-08-21 Listed $220,240 Stellar MLS as Distributed by MLS Grid
- 2022-08-21 Sold (MLS) $220,240 Stellar MLS as Distributed by MLS Grid
- 2021-01-27 Sold (Public Records) $30,000 Public Records
Property tax history
+32.3%/yrLatest (2025): $2,887 · +1.4% YoY. Source: county tax records.
Cash-flow waterfall
monthlySold comps — $/sqft
last 12 mo · ≤1 miLoading sold comps…