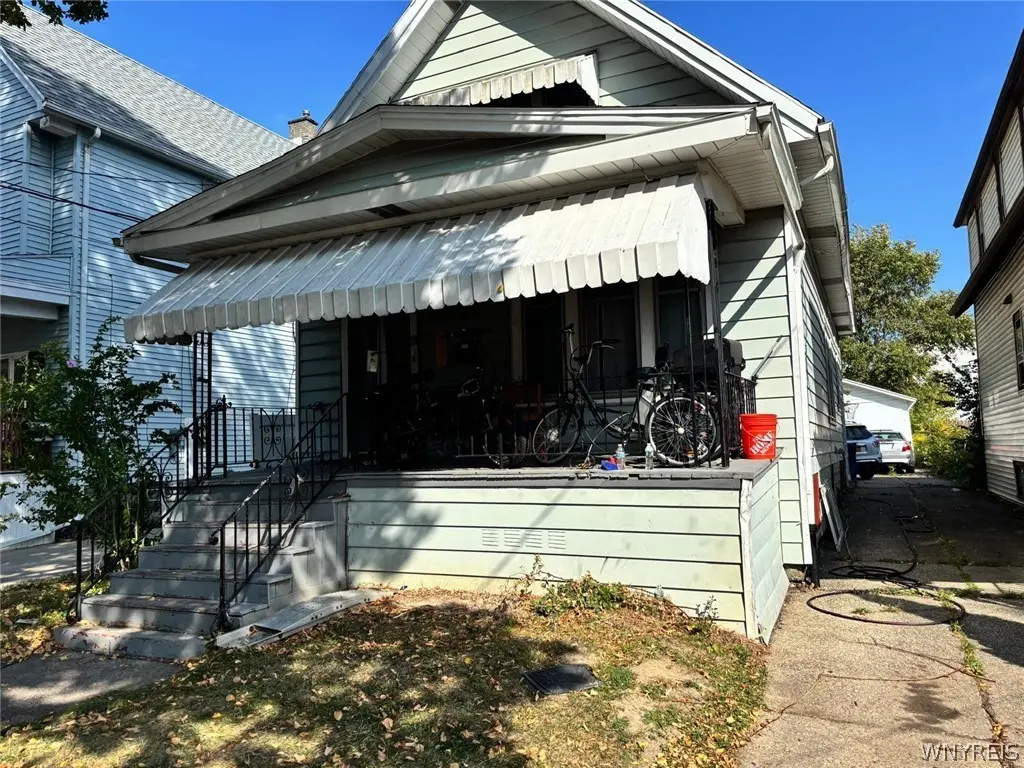
315 Cornwall Ave · Buffalo, NY
Flood risk 6/10 · Moderate
- FEMA flood zone
- X (unshaded)
- Chance of flooding over 30 yrs
- 0.69%
- Est. flood insurance / yr
- $507 – $1,088
Fire risk 1/10 · Minimal
- Est. fire insurance / yr
- $691 – $1,283
Heat risk 3/10 · Minor
- Hot days now (above 93°F)
- 7 days/yr
- Hot days in 30 yrs
- 15 days/yr
Wind risk 1/10 · Minimal
- Chance of severe wind over 30 yrs
- —
Air-quality risk 3/10 · Minor
- Unhealthy air days now
- 2 days/yr
- Unhealthy air days in 30 yrs
- 3 days/yr
Risk factors via First Street. Map © Google.
Why this score? — see what drove the B- grade
The composite is a weighted blend of 9 inputs, each scored 0–100. Each bar is that input's sub-score; the figure is the points it added to the 100-point composite (weight × sub-score).
- Cash flow +26.0/30.0
- ARV discount +15.0/15.0
- DSCR +8.7/10.0
- 1% rule +6.9/10.0
- Livability +3.9/5.0
- Schools +3.3/10.0
- Rent growth +2.7/5.0
- Condition / age +2.5/5.0
- Appreciation +0.0/10.0
$130,000
🖨 Deal sheet 📄 Offer letter ✓ Due diligence
Listing remarks MLS
Welcome to this well-sized single-family home offering nearly 1,300 sq. ft. of living space, featuring 3 bedrooms and 1 full bath. The home boasts a functional layout with generous room sizes, making it ideal for comfortable living. Located on Cornwall Avenue in a convenient Buffalo neighborhood, you’ll be close to schools, shopping, parks, and public transportation. With its great location and solid potential, this property is perfect for a firsttime homebuyer or investor looking to add to their portfolio. Appointments require 24 hours advance notice and can be made Monday, Wednesday, Friday or Saturday from 12-6pm. Offers will be reviewed as they are received. This property could be sold in conjunction with 121 Hagen Street (B1668047), 210 Timon Street (B1668109), and 129 Roma Avenue (B1668155).
Key facts
- Close to parks
- Close to schools
- Generous room sizes
Tags
Neighborhood map
What this means for you Summary
Snapshot
- This is a 4-bed/1.0-bath single-family listed at $130k.
Deal economics
- At list price, monthly cash flow is $322 ($4k/yr) — positive.
- The deal already cash-flows at list — no discount required.
- Meets the 1% rule at list price ($2k rent vs $130k).
- Recommended offer: $122k (6.0% below list) — sets the bar for market timing.
Location & tenants
- Location reads 77/100 on livability (#195 in NY, #3,011 nationally) — a middle-class / working-renter tenant base. Strengths: commute A+, housing A+, health & safety A+; Watch: crime F, employment D-.
- Buffalo City School District (urban): math 41% / reading 40% proficiency, ranked #535 of 590 in NY (top 91%) — families likely to look elsewhere, expect single-tenant / working-renter base with shorter leases; 75% free/reduced lunch — lower-income household profile, screen leases tightly.
- Market conditions: Rents flat; 237 active listings in the ZIP; 13 comparable units currently listed for rent nearby; rentals at typical pace (median 15d on market — plan ~3-4 weeks tenant-placement turnaround); lower-income renter base — watch delinquency; 1,244 units permitted in Erie County in 2024 (563 in 5+ unit buildings).
- This rent runs 41% of the median local income ($45k/yr) — at the standard rent-burdened threshold; future hikes will face affordability resistance.
Forward outlook
- Local home prices are declining (-3.0%/yr); year-one equity from $899 of loan paydown is wiped out by about $4k of value loss. Plan a longer hold.
Negotiation context
- It's been on market 90 days — a 6% lower offer ($122k) is reasonable based on typical stale-listing flexibility.
- 4 sale attempts since 10y ago with the ask held roughly flat each time — persistent listings suggest the price (not the market) is what's stuck; bring a comps-based counter.
- Current owner paid $50k; list at $130k implies a 159% gain — meaningful room to come down on a strong offer.
Risks & watch-outs
- Watch-outs: built in 1937 — expect roof / HVAC / electrical / plumbing capex.
- Climate carrying-cost: major flood risk — expect insurance premiums to compound above CPI over the hold.
Questions for the listing agent
- It's been on market 90 days. Have you received any prior offers? Is the seller open to a 6% concession, seller financing, or rate buy-down credit?
- Built in 1937 — when were the roof, HVAC, electrical panel, plumbing, and water heater last replaced?
- Why hasn't it sold? Are there any deal-killer items the seller is aware of (foundation, flood, title, zoning, code violations)?
- Is there a deadline driving the sale (1031 exchange, divorce, estate, relocation)? That informs how much negotiation room exists.
- Crime grade is F in this area — have there been break-ins, vandalism, or insurance claims at this property in the last 3 years? What carrier currently insures it and at what premium?
- What's the average days-on-market for RENTAL listings here right now (not sales)? A rising rental-DOM trend means longer vacancies and softer asking-rent achievability than the comps imply.
- What's the recent tenant-quality profile in this submarket — average credit score on applications, eviction rate, late-payment / NSF rate, and stable-employment percentage? A property-management company in the area should have these aggregated.
- How much new for-sale + rental construction is in the pipeline within 1–3 miles? Heavy new supply typically softens prices + rents 12–24 months out; constrained supply supports both.
Investment metrics
- 1% rule
- 1.19% ✓
- Cap rate
- 9.27%
- Cash-on-cash
- 10.62%
- DSCR
- 1.47
- GRM
- 7.0
CMA / ARV
- ARV (median comp)
- $166,878
- List price
- $130,000
- Delta
- -22.10%
- Verdict
- UNDERPRICED
- Comps
- 20 within 1.0 mi
Show comp detail 12 sales within ~0.75 mi
| Address | Dist | Beds/Ba | Sqft | Sold | Price | $/sf | Match |
|---|---|---|---|---|---|---|---|
| 231 Stevens Ave | 0.26mi | 4/2.0 | 1,268 (-1%) | 1mo | $200,000 | $158 | 81 |
| 158 Wende St | 0.57mi | 4/1.0 | 1,340 (+4%) | 0mo | $70,000 | $52 | 66 |
| 105 Dorris Ave | 0.42mi | 4/1.0 | 1,206 (-6%) | 7mo | $115,000 | $95 | 65 |
| 28 Alma Ave | 0.35mi | 3/1.0 (-1) | 1,210 (-6%) | 6mo | $77,000 | $64 | 64 |
| 48 Dorris Ave | 0.33mi | 4/1.0 | 1,160 (-10%) | 6mo | $35,000 | $30 | 64 |
| 323 Grider St | 0.37mi | 4/2.0 | 1,418 (+10%) | 1mo | $128,000 | $90 | 61 |
| 226 Olympic Ave | 0.39mi | 3/2.0 (-1) | 1,223 (-5%) | 6mo | $195,000 | $159 | 60 |
| 42 Schauf Ave | 0.70mi | 5/1.0 (+1) | 1,281 (-0%) | 5mo | $170,000 | $133 | 58 |
| 68 Wecker St | 0.38mi | 4/2.0 | 1,148 (-10%) | 6mo | $180,000 | $157 | 56 |
| 635 Norfolk Ave | 0.63mi | 3/1.0 (-1) | 1,340 (+4%) | 5mo | $172,500 | $129 | 54 |
| 145 Kilhoffer St | 0.60mi | 5/2.0 (+1) | 1,221 (-5%) | 2mo | $135,000 | $111 | 53 |
| 102 Carl St | 0.53mi | 3/1.0 (-1) | 1,158 (-10%) | 2mo | $124,900 | $108 | 52 |
Match score weights: distance 35% · size 25% · config 20% · recency 20%. Top-matched comps best support the ARV.
Projected returns pro-forma
-3.0% appreciation · 0.67% rent growth · sell at horizon
- IRR
- -3.1%
- Equity multiple
- 0.89×
- Total profit
- $-4,071
- Equity at exit
- $19,383
- IRR
- 3.8%
- Equity multiple
- 1.25×
- Total profit
- $9,100
- Equity at exit
- $11,240
Cash invested: $36,400 (down + closing). Projections, not guarantees.
Landlord ↔ Tenant lean methodology
- Overall (STATE)
- 15 Strongly Tenant-Friendly
- State New York
- 15 Strongly Tenant-Friendly · D+10
- County
- — inherits STATE
- City
- — inherits STATE
ZIP-level market 14215
- Home prices YoY
- -30.0%
- Rents YoY
- 0.7%
- Active inventory
- 237
- Price-to-rent
- 7.0×
Monthly cashflow live
- Estimated rent
- $1,545 high interval (Pro) →
- Mortgage (P&I)
- −$682
- Tax est. 1.5%
- −$162 /mo · $1,950/yr
- Insurance
- −$54
- HOA
- −$0
- Vacancy / Maint / Mgmt
- −$324
- Net cashflow
- $322
Break-even live
UW: 25.0% down · 7.5% · 30yr · 1.5% tax · 5.0% vac · 8.0% maint · 8.0% mgmt
Financing live
Cash to close
- Down payment
- $32,500
- Closing costs
- $3,900
- Reserves months
- —
- Total cash needed
- —
Loan-product check · same deal, 3 products live
Conventional
25% down · 7.5% · 30yr
- Down + closing
- —
- Monthly P&I
- —
- Monthly cashflow
- —
- DSCR
- —
- Eligible?
- —
Personal DTI + credit; lowest rate.
DSCR
20% down · 8.5% · 30yr
- Down + closing
- —
- Monthly P&I
- —
- Monthly cashflow
- —
- DSCR
- —
- Eligible?
- —
No personal income docs; deal must DSCR.
Hard money
10% down · 12.0% · 12mo
- Down + closing
- —
- Monthly P&I
- —
- Monthly cashflow
- —
- DSCR
- —
- Eligible?
- —
Short-term bridge; refi at stabilization.
Rent comps 13 comps
| Address | Beds | Baths | Sqft | Rent | $/sqft | DOM | Units | Dist |
|---|---|---|---|---|---|---|---|---|
| 74 Dorris Ave Buffalo, NY | 3.0 | 1.0 | 1200 | $1,450 | $1.21 | 43d | 1 | 0.40mi |
| 85 Blake St Unit 1 Buffalo, NY | 4.0 | 2.0 | 1022 | $1,000 | $0.98 | 43d | 1 | 0.74mi |
| 517 Goodyear Ave Buffalo, NY | 3.0 | 1.0 | 1559 | $1,800 | $1.15 | 19d | 1 | 0.88mi |
| 67 Moeller St Unit LOWER Buffalo, NY | 3.0 | 1.0 | 960 | $1,200 | $1.25 | 23d | 1 | 1.03mi |
| 67 Moeller St Unit UPPER Buffalo, NY | 3.0 | 1.0 | 960 | $1,000 | $1.04 | 3d | 1 | 1.03mi |
| 408 Winslow Ave Unit 2 Buffalo, NY | 3.0 | 1.0 | 1000 | $1,050 | $1.05 | 14d | 1 | 1.04mi |
| 140 Parkridge Ave Buffalo, NY | 3.0 | 1.0 | 990 | $1,500 | $1.52 | 43d | 1 | 1.08mi |
| 97 Davidson Ave Buffalo, NY | 3.0 | 1.0 | 925 | $1,495 | $1.62 | 1d | 1 | 1.15mi |
| 65 Domedion Ave Buffalo, NY | 3.0 | 1.0 | 1632 | $1,500 | $0.92 | 1d | 1 | 1.17mi |
| 179 Donaldson Rd Buffalo, NY | 3.0 | 1.0 | 1152 | $1,350 | $1.17 | 3d | 1 | 1.24mi |
| 184 Butler Ave Unit 1545840P Buffalo, NY | 4.0 | 1.0 | 1496 | $3,226 | $2.16 | 14d | 1 | 1.27mi |
| 104 Butler Ave Buffalo, NY | 3.0 | 1.0 | 1000 | $1,400 | $1.40 | 43d | 1 | 1.40mi |
| 189 Westminster Ave Buffalo, NY | 4.0 | 1.5 | 1065 | $1,595 | $1.50 | 10d | 1 | 1.47mi |
Listing history 26 events
-
2026-06-18days on market $130,000 Active 90 DOM
-
2026-06-17days on market $130,000 Active 89 DOM
-
2026-06-16days on market $130,000 Active 88 DOM
-
2026-06-15days on market $130,000 Active 87 DOM
-
2026-06-13days on market $130,000 Active 85 DOM
-
2026-06-13days on market $130,000 Active 84 DOM
-
2026-06-10days on market $130,000 Active 82 DOM
-
2026-06-09days on market $130,000 Active 81 DOM
-
2026-06-08days on market $130,000 Active 80 DOM
-
2026-06-07days on market $130,000 Active 79 DOM
-
2026-06-03days on market $130,000 Active 75 DOM
-
2026-06-02days on market $130,000 Active 74 DOM
-
2026-06-01days on market $130,000 Active 73 DOM
-
2026-05-31days on market $130,000 Active 72 DOM
-
2026-03-20$130,000 Active 814-char remark
Show marketing remark (814 chars)
Welcome to this well-sized single-family home offering nearly 1,300 sq. ft. of living space, featuring 3 bedrooms and 1 full bath. The home boasts a functional layout with generous room sizes, making it ideal for comfortable living. Located on Cornwall Avenue in a convenient Buffalo neighborhood, you’ll be close to schools, shopping, parks, and public transportation. With its great location and solid potential, this property is perfect for a firsttime homebuyer or investor looking to add to their portfolio. Appointments require 24 hours advance notice and can be made Monday, Wednesday, Friday or Saturday from 12-6pm. Offers will be reviewed as they are received. This property could be sold in conjunction with 121 Hagen Street (B1668047), 210 Timon Street (B1668109), and 129 Roma Avenue (B1668155).
-
2026-03-20historical
Show marketing remark (814 chars)
Welcome to this well-sized single-family home offering nearly 1,300 sq. ft. of living space, featuring 3 bedrooms and 1 full bath. The home boasts a functional layout with generous room sizes, making it ideal for comfortable living. Located on Cornwall Avenue in a convenient Buffalo neighborhood, you’ll be close to schools, shopping, parks, and public transportation. With its great location and solid potential, this property is perfect for a firsttime homebuyer or investor looking to add to their portfolio. Appointments require 24 hours advance notice and can be made Monday, Wednesday, Friday or Saturday from 12-6pm. Offers will be reviewed as they are received. This property could be sold in conjunction with 121 Hagen Street (B1668047), 210 Timon Street (B1668109), and 129 Roma Avenue (B1668155).
-
2025-09-17$134,900 Active
-
2016-12-29soldstatus $50,100
-
2016-12-28soldstatus $24,000 Closed Sale or Rented
-
2016-09-12status Pending Sale
-
2016-09-04price $29,900
-
2016-08-18price $34,000
-
2016-08-18status Active
-
2016-08-18price $39,999
-
2016-08-18historical
-
2016-06-22$39,900 Active
ⓘ Source: listings_history table (triggers on properties + properties_extension) + one-shot
backfill from property_details.listing_events for pre-trigger history.
Climate risk First Street
- Flood 6/10 Major FEMA zone X (unshaded) · 69% chance over 30 yrs
- Wildfire 1/10 Low
- Heat 3/10 Moderate 7 d/yr ≥93°F today · 15 d/yr by 30 yrs out
- Wind 1/10 Low
- Air quality 3/10 Moderate 2 unhealthy d/yr today · 3 by 30 yrs out
Nearby sold comps map
Loading sold comps map…
Walkable amenities ~0.75 mi
Loading nearby amenities…
Taxation est. · year 1
- Rental income
- $18,538
- − Mortgage interest
- −$7,282
- − Property taxes
- −$1,950
- − Insurance
- −$650
- − Repairs & maintenance
- −$1,483
- − Management
- −$1,483
- − Depreciation
- −$3,782
- Taxable income
- $1,908
- Est. tax owed @ 24.0%
- −$458
- After-tax cash flow
- $3,407/yr
For passive investors: Depreciation is non-cash, so a rental often shows a tax loss while cash-flowing — sheltering income. Rental losses are passive: they offset passive income freely, and up to $25,000/yr can offset ordinary (W-2) income if you actively participate and your MAGI is under $100k (phasing out to $0 by $150k); unused losses carry forward. On sale, claimed depreciation is recaptured at up to 25%, and gains may owe capital-gains tax (a 1031 exchange can defer both). Figures are a year-1 estimate at your 24.0% rate — not tax advice; consult a CPA.
Schools (NCES district)
- District
- Buffalo City School District
- NCES district ID
- 3605850
- Math proficiency
- 41% ▲ 11.00%
- Reading proficiency
- 40% ▲ 7.00%
- Median HH income
- $31,665
- Composite
- 33.17/100
- National rank
- #5544
- State rank
- #535 of 590 in NY
Livability — Buffalo
- Score
- 77/100
- State rank
- #195
- US rank
- #3011
Category grades
Schools grade is shown separately in the Schools card above.
Census & demographics
- Census place
- Buffalo, NY
- County
- Erie County · 714,559 people
- City population
- 440,021
- Metro
- Buffalo-Cheektowaga, NY
- Population (ZIP)
- 42,524
- Household income
- $44,955
- Rent vs Own
- Severe rent burden
- 2873.0
Population outlook (Erie County) Hauer SSP2
- Today (2025)
- 933,037 people
- By 2030
- 935,181 · +0.2%
- By 2040
- 928,531 · -0.5%
- By 2050
- 905,725 · -2.9%
- By 2075
- 834,037 · -10.6%
- By 2100
- 708,033 · -24.1%
Race, ethnicity, and origin ACS 2023
- Neighborhood character
- Predominantly Black (67%)
- Race & ethnicity
- Black 67% White 15% Asian 7% Hispanic / Latino 6% Two or more races 6%
- Hispanic origin (detail)
- Puerto Rican 4%
- Common ancestry
- Romanian 4% Lithuanian 1% Italian 1%
- Foreign-born
- 9% · Canada, China
- Languages at home
- 88% English-only · Other Indo-European 4% Spanish 4% Chinese 1%
Political lean MEDSL · Erie
- 2024 margin
- Lean D (+9.7) · D 54.8% · R 45.2%
- 2008→2024 swing
- -7.9pp toward R · 2008: 17.5pp · 2024: 9.7pp
- All cycles
- 2024: D+9.7 2020: D+14.7 2016: D+4.8 2012: D+15.6 2008: D+17.5
Not yet ingested
- Civics
- —
Market trends
- HPI YoY
- ▼ -126.29%
- Current HPI
- 295.2966
- Rent YoY
- ▲ 0.67%
- Metro
- Buffalo-Cheektowaga, NY
- State GDP YoY
- ▲ 2.60%
- F500 in state
- 92
Industry mix (Fortune 500 HQ in NY)
| Industry | F500 HQs | Revenue |
|---|---|---|
| Financial Services | 10 | $950B |
|
||
| Consumer Goods | 9 | $162B |
|
||
| Insurance | 4 | $225B |
|
||
| Telecommunications | 2 | $144B |
|
||
| Pharmaceuticals | 2 | $112B |
|
||
| Media / Entertainment | 2 | $69B |
|
||
Price history
+225.8% since first listed12 events — show timeline
- 2026-03-20 Listing Removed — WNYREIS
- 2026-03-20 Listed $130,000 WNYREIS
- 2025-09-17 Listed $134,900 WNYREIS
- 2016-12-29 Sold (Public Records) $50,100 Public Records
- 2016-12-28 Sold (MLS) $24,000 WNYREIS
- 2016-09-12 Pending — WNYREIS
- 2016-09-04 Price Changed $29,900 WNYREIS
- 2016-08-18 Price Changed $34,000 WNYREIS
- 2016-08-18 Relisted — WNYREIS
- 2016-08-18 Price Changed $39,999 WNYREIS
- 2016-08-18 Listing Removed — WNYREIS
- 2016-06-22 Listed $39,900 WNYREIS
Property tax history
+0.7%/yrLatest (2025): $196 · +0.0% YoY. Source: county tax records.
Cash-flow waterfall
monthlySold comps — $/sqft
last 12 mo · ≤1 miLoading sold comps…