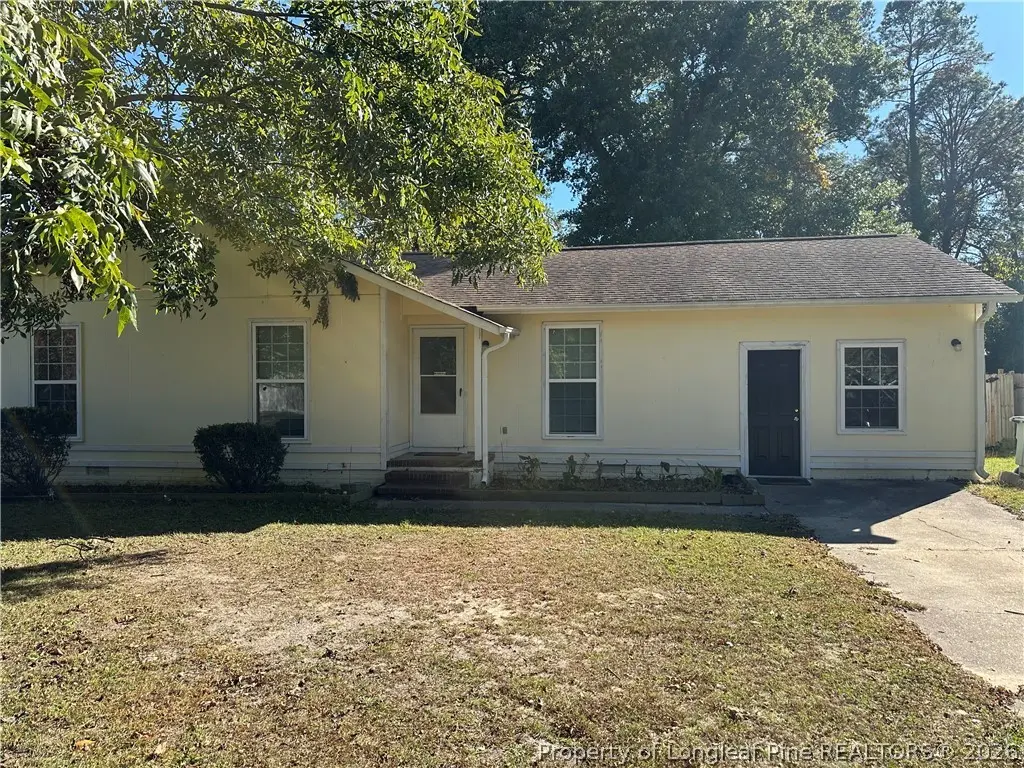
6413 Winter Park Dr · Fayetteville, NC
Flood risk 1/10 · Minimal
- FEMA flood zone
- X (unshaded)
- Chance of flooding over 30 yrs
- 0.0%
- Est. flood insurance / yr
- $507 – $1,088
Fire risk 4/10 · Minor
- Est. fire insurance / yr
- $906 – $1,684
Heat risk 7/10 · Major
- Hot days now (above 107°F)
- 7 days/yr
- Hot days in 30 yrs
- 16 days/yr
Wind risk 8/10 · Major
- Chance of severe wind over 30 yrs
- 80.0%
Air-quality risk 1/10 · Minimal
- Unhealthy air days now
- 0 days/yr
- Unhealthy air days in 30 yrs
- 0 days/yr
Risk factors via First Street. Map © Google.
Why this score? — see what drove the F grade
The composite is a weighted blend of 9 inputs, each scored 0–100. Each bar is that input's sub-score; the figure is the points it added to the 100-point composite (weight × sub-score).
- Cash flow +9.8/30.0
- ARV discount +4.6/15.0
- Livability +3.8/5.0
- Rent growth +3.3/5.0
- Schools +3.1/10.0
- DSCR +2.8/10.0
- 1% rule +2.7/10.0
- Condition / age +2.5/5.0
- Appreciation +0.0/10.0
$189,000
🖨 Deal sheet 📄 Offer letter ✓ Due diligence
Listing remarks
This is a one-story 3 bedroom, 2 bathroom home with a bonus room that has its own entrance. The backyard has detached carport with a roof.
Key facts
- Detached carport
- Bonus room
- Built 1980
Tags
Property features AI
Finance
- Other: Listing broker: BEST INVESTMENT REALTY; Listing agent: ROD AL HADDAD
Exterior
- Parking: Detached carport
- Utilities: Public water; Public sewer
- Home design: Single family residence; One story
- Construction: Vinyl siding
- Exterior features: Subdivision: WINTER PARK; Zoned SF10 (Single Family Res 10)
Interior
- Kitchen: Refrigerator
- Bedrooms: 5 total rooms (includes bedrooms and other rooms)
- Flooring: Carpet; Vinyl
- Bathrooms: 2 full bathrooms
- Heating & cooling: Heat pump
- Interior features: Refrigerator included; No basement
- Laundry & utility: Heat pump provides heating (no separate utility appliances listed)
Neighborhood map
What this means for you Summary
Snapshot
- This is a 3-bed/2.0-bath single-family listed at $189k.
Deal economics
- At list price, monthly cash flow is $-120 ($-1k/yr) — negative.
- To cash-flow at today's rent, offer at most $168k (11.2% below list).
- To meet the 1% rule (rent ≥ 1% of price), the offer needs to be $146k (23.0% below list).
- Recommended offer: $146k (23.0% below list) — sets the bar for 1% rule.
Location & tenants
- Location reads 75/100 on livability (#45 in NC, #4,031 nationally) — a middle-class / working-renter tenant base. Strengths: commute A+, cost of living A+, housing A+; Watch: schools C-, crime F, employment D-.
- Cumberland County Schools (urban): math 32% / reading 41% proficiency, ranked #126 of 178 in NC (top 71%) — families likely to look elsewhere, expect single-tenant / working-renter base with shorter leases.
- Market conditions: Rents rising (+3.2%/yr); 302 active listings in the ZIP; 40 comparable units currently listed for rent nearby; rentals at typical pace (median 24d on market — plan ~3-4 weeks tenant-placement turnaround); 1,125 units permitted in Cumberland County in 2024 (104 in 5+ unit buildings).
Forward outlook
- Local home prices are declining (-3.0%/yr); year-one equity from $1k of loan paydown is wiped out by about $6k of value loss. Plan a longer hold.
Negotiation context
- It's been on market 17 days — a 2% lower offer ($186k) is reasonable based on typical stale-listing flexibility.
- Current owner paid $155k; 22% above their basis — modest negotiation headroom, anchor on the comps not their cost.
Risks & watch-outs
- Climate carrying-cost: severe wind risk, 80% chance of damaging wind over 30y; extreme-heat days projected 7→16/yr by 2055 (HVAC capex compounding) — expect insurance premiums to compound above CPI over the hold.
Questions for the listing agent
- What do current leases actually rent for vs. the listed asking? Can we see a recent rent roll and the last 12 months of T-12 income?
- Is there a deadline driving the sale (1031 exchange, divorce, estate, relocation)? That informs how much negotiation room exists.
- Crime grade is F in this area — have there been break-ins, vandalism, or insurance claims at this property in the last 3 years? What carrier currently insures it and at what premium?
- The area grade is low — what's the realistic commute time and amenity access for the typical tenant pool here? Any planned neighborhood developments (good or bad) we should know about?
- What's the average days-on-market for RENTAL listings here right now (not sales)? A rising rental-DOM trend means longer vacancies and softer asking-rent achievability than the comps imply.
- What's the recent tenant-quality profile in this submarket — average credit score on applications, eviction rate, late-payment / NSF rate, and stable-employment percentage? A property-management company in the area should have these aggregated.
- How much new for-sale + rental construction is in the pipeline within 1–3 miles? Heavy new supply typically softens prices + rents 12–24 months out; constrained supply supports both.
Investment metrics
- 1% rule
- 0.77% ✗
- Cap rate
- 5.53%
- Cash-on-cash
- -2.73%
- DSCR
- 0.88
- GRM
- 10.8
CMA / ARV
- ARV (on-the-fly)
- $177,408
- Comps found
- 12
Show comp detail 12 sales within ~0.75 mi
| Address | Dist | Beds/Ba | Sqft | Sold | Price | $/sf | Match |
|---|---|---|---|---|---|---|---|
| 6415 Rutherglen Dr | 0.37mi | 3/2.0 | 1,004 (-0%) | 5mo | $222,000 | $221 | 78 |
| 1423 Furnish Dr | 0.28mi | 3/2.0 | 1,104 (+10%) | 4mo | $205,000 | $186 | 68 |
| 6381 Rhemish Dr | 0.23mi | 3/2.0 | 1,123 (+11%) | 3mo | $198,000 | $176 | 67 |
| 1719 Merry Oaks Dr | 0.44mi | 3/1.5 | 1,073 (+6%) | 6mo | $140,000 | $130 | 62 |
| 6357 Rockford Dr | 0.25mi | 3/2.0 | 1,104 (+10%) | 13mo | $205,000 | $186 | 62 |
| 6459 Rannock Dr | 0.54mi | 3/2.0 | 975 (-3%) | 10mo | $170,000 | $174 | 61 |
| 2104 Decor St | 0.40mi | 3/1.0 | 1,041 (+3%) | 13mo | $155,000 | $149 | 61 |
| 1610 Berriedale Dr | 0.37mi | 3/2.0 | 1,083 (+7%) | 13mo | $171,000 | $158 | 59 |
| 2113 Coinjock Cir | 0.34mi | 3/2.0 | 1,114 (+10%) | 10mo | $198,500 | $178 | 58 |
| 6547 Amanda Cir | 0.70mi | 3/1.5 | 1,002 (-1%) | 10mo | $135,000 | $135 | 56 |
| 1408 Matilda Ct | 0.43mi | 3/2.0 | 1,146 (+14%) | 13mo | $206,000 | $180 | 46 |
| 1591 Hazelcrest Dr | 0.55mi | 3/2.0 | 1,149 (+14%) | 10mo | $194,000 | $169 | 42 |
Match score weights: distance 35% · size 25% · config 20% · recency 20%. Top-matched comps best support the ARV.
Projected returns pro-forma
-3.0% appreciation · 3.17% rent growth · sell at horizon
- IRR
- -20.7%
- Equity multiple
- 0.28×
- Total profit
- $-38,034
- Equity at exit
- $28,181
- IRR
- -13.5%
- Equity multiple
- 0.21×
- Total profit
- $-41,954
- Equity at exit
- $16,341
Cash invested: $52,920 (down + closing). Projections, not guarantees.
Landlord ↔ Tenant lean methodology
- Overall (STATE)
- 85 Strongly Landlord-Friendly
- State North Carolina
- 85 Strongly Landlord-Friendly · R+3
- County
- — inherits STATE
- City
- — inherits STATE
ZIP-level market 28304
- Home prices YoY
- -21.7%
- Rents YoY
- 3.2%
- Active inventory
- 302
- Price-to-rent
- 10.8×
Monthly cashflow live
- Estimated rent
- $1,455 high interval (Pro) →
- Mortgage (P&I)
- −$991
- Tax from tax record
- −$200 /mo · $2,399/yr
- Insurance
- −$79
- HOA
- −$0
- Vacancy / Maint / Mgmt
- −$306
- Net cashflow
- $-120
Break-even live
UW: 25.0% down · 7.5% · 30yr · 1.5% tax · 5.0% vac · 8.0% maint · 8.0% mgmt
Financing live
Cash to close
- Down payment
- $47,250
- Closing costs
- $5,670
- Reserves months
- —
- Total cash needed
- —
Loan-product check · same deal, 3 products live
Conventional
25% down · 7.5% · 30yr
- Down + closing
- —
- Monthly P&I
- —
- Monthly cashflow
- —
- DSCR
- —
- Eligible?
- —
Personal DTI + credit; lowest rate.
DSCR
20% down · 8.5% · 30yr
- Down + closing
- —
- Monthly P&I
- —
- Monthly cashflow
- —
- DSCR
- —
- Eligible?
- —
No personal income docs; deal must DSCR.
Hard money
10% down · 12.0% · 12mo
- Down + closing
- —
- Monthly P&I
- —
- Monthly cashflow
- —
- DSCR
- —
- Eligible?
- —
Short-term bridge; refi at stabilization.
Rent comps 40 comps
| Address | Beds | Baths | Sqft | Rent | $/sqft | DOM | Units | Dist |
|---|---|---|---|---|---|---|---|---|
| 6338 Rhemish Dr Fayetteville, NC | 3.0 | 2.0 | 1201 | $1,500 | $1.25 | 23d | 1 | 0.29mi |
| 1411 Furnish Dr Fayetteville, NC | 3.0 | 2.0 | 1100 | $1,350 | $1.23 | 23d | 1 | 0.32mi |
| 1879 Frankie Ave Fayetteville, NC | 3.0 | 2.0 | 1100 | $1,375 | $1.25 | 23d | 1 | 0.49mi |
| 6408 Dunham Dr Fayetteville, NC | 3.0 | 2.0 | 1400 | $1,500 | $1.07 | 13d | 1 | 0.55mi |
| 1508 Darvel Ave Fayetteville, NC | 3.0 | 2.0 | 1269 | $1,700 | $1.34 | 23d | 1 | 0.58mi |
| 3001 Stone Carriage Cir Fayetteville, NC | 1.0–3.0 | 1.0–2.0 | 1098 | $1,700 | $1.55 | 13d | 12 | 0.59mi |
| 1701 Carter Baron Pl Unit 211 Fayetteville, NC | 3.0 | 2.0 | 1295 | $1,700 | $1.31 | 23d | 1 | 0.61mi |
| 1715 Arrow Ridge Way Fayetteville, NC | 3.0 | 2.0 | 1220 | $1,550 | $1.27 | 13d | 1 | 0.65mi |
| 1800 Balmoral Dr Fayetteville, NC | 2.0 | 2.0 | 1328 | $1,250 | $0.94 | 23d | 1 | 0.74mi |
| 1811 Balmoral Dr #202 Fayetteville, NC | 2.0 | 2.0 | 1250 | $1,275 | $1.02 | 13d | 1 | 0.74mi |
| 1437 Artesian Ct Fayetteville, NC | 2.0 | 1.5 | 850 | $1,000 | $1.18 | 13d | 1 | 0.76mi |
| 1761 Renwick Dr #204 Fayetteville, NC | 2.0 | 2.0 | 1331 | $1,300 | $0.98 | 13d | 1 | 0.77mi |
| 1443 Larkhall Dr Fayetteville, NC | 4.0 | 2.0 | 1382 | $1,600 | $1.16 | 23d | 1 | 0.81mi |
| 6333 Marykirk Dr Unit A Fayetteville, NC | 2.0 | 1.5 | 1080 | $1,075 | $1.00 | 23d | 1 | 0.81mi |
| 1644 Sweetgum Cir Fayetteville, NC | 3.0 | 2.0 | 1446 | $1,750 | $1.21 | 23d | 1 | 0.83mi |
| 2514 Gardner Park Dr Fayetteville, NC | 3.0 | 2.5 | 1480 | $1,595 | $1.08 | 23d | 1 | 0.84mi |
| 1948 Nordic Dr Fayetteville, NC | 3.0 | 2.0 | 1131 | $1,400 | $1.24 | 23d | 1 | 0.85mi |
| 6324 Marykirk Dr Unit A Fayetteville, NC | 2.0 | 1.5 | 792 | $900 | $1.14 | 23d | 1 | 0.86mi |
| 6332 Marykirk Dr Unit A Fayetteville, NC | 2.0 | 1.5 | 925 | $1,150 | $1.24 | 23d | 1 | 0.86mi |
| 1066 Strickland Bridge Rd Fayetteville, NC | 3.0 | 2.0 | 1427 | $2,050 | $1.44 | 13d | 1 | 0.97mi |
| 1222 Southwood Dr Fayetteville, NC | 2.0 | 1.5 | 801 | $875 | $1.09 | 23d | 1 | 0.98mi |
| 5744 Randleman St Fayetteville, NC | 3.0 | 2.0 | 1171 | $1,395 | $1.19 | 23d | 1 | 1.01mi |
| 2012 Lakemeadow Dr Fayetteville, NC | 3.0 | 2.0 | 1332 | $1,800 | $1.35 | 13d | 1 | 1.02mi |
| 6400 Starbrook Dr #1 Fayetteville, NC | 2.0 | 2.0 | 860 | $1,000 | $1.16 | 23d | 1 | 1.03mi |
| 6408 Starbrook Dr #5 Fayetteville, NC | 2.0 | 2.0 | 860 | $995 | $1.16 | 23d | 1 | 1.03mi |
| 2640 Latrobe Ave Fayetteville, NC | 1.0–3.0 | 1.0–2.0 | 1079 | $1,815 | $1.68 | 13d | 30 | 1.04mi |
| 5721 Randleman St Fayetteville, NC | 3.0 | 2.0 | 1050 | $1,575 | $1.50 | 23d | 1 | 1.07mi |
| 5744 Aftonshire Dr Fayetteville, NC | 2.0 | 1.5 | 945 | $999 | $1.06 | 23d | 1 | 1.24mi |
| 1401 Carnsmore Dr Fayetteville, NC | 3.0 | 2.5 | 1450 | $1,575 | $1.09 | 23d | 1 | 1.29mi |
| 5713 Aftonshire Dr Fayetteville, NC | 2.0 | 2.5 | 1025 | $995 | $0.97 | 13d | 1 | 1.29mi |
| 3325 Oak Forest Dr Fayetteville, NC | 1.0–3.0 | 1.0–2.0 | 1112 | $1,745 | $1.57 | 13d | 66 | 1.31mi |
| 1406 Tangora Ln Fayetteville, NC | 2.0 | 2.5 | 1192 | $1,015 | $0.85 | 23d | 1 | 1.31mi |
| 1413 Tangora Ln Fayetteville, NC | 2.0 | 1.5 | 945 | $979 | $1.04 | 13d | 1 | 1.34mi |
| 6716 Sandfield Ct Fayetteville, NC | 3.0 | 2.0 | 1296 | $1,575 | $1.22 | 23d | 1 | 1.34mi |
| 2920 Cosmo Dr Fayetteville, NC | 1.0–3.0 | 1.0–2.0 | 918 | $1,505 | $1.64 | 13d | 9 | 1.36mi |
| 5595 Quietwood Pl Fayetteville, NC | 3.0 | 2.0 | 1288 | $1,395 | $1.08 | 23d | 1 | 1.37mi |
| 5876 Aftonshire Dr Fayetteville, NC | 2.0 | 1.5 | 1024 | $1,015 | $0.99 | 23d | 1 | 1.38mi |
| 1216 Weeping Willow Way Unit 229 Fayetteville, NC | 3.0 | 2.0 | 960 | $969 | $1.01 | 13d | 1 | 1.38mi |
| 5842 Aftonshire Dr Fayetteville, NC | 2.0 | 1.5 | 1010 | $1,000 | $0.99 | 23d | 1 | 1.38mi |
| 5864 Aftonshire Dr Fayetteville, NC | 2.0 | 2.0 | 1100 | $1,100 | $1.00 | 23d | 1 | 1.39mi |
Listing history 19 events
-
2026-06-18days on market $189,000 Active 17 DOM
-
2026-06-17days on market $189,000 Active 16 DOM
-
2026-06-16days on market $189,000 Active 15 DOM
-
2026-06-15days on market $189,000 Active 14 DOM
-
2026-06-14days on market $189,000 Active 12 DOM
-
2026-06-13days on market $189,000 Active 11 DOM
-
2026-06-10days on market $189,000 Active 9 DOM
-
2026-06-09days on market $189,000 Active 8 DOM
-
2026-06-08days on market $189,000 Active 7 DOM
-
2026-06-07days on market $189,000 Active 6 DOM
-
2026-06-03days on market $189,000 Active 2 DOM
-
2026-06-02days on market $189,000 Active 1 DOM
-
2026-05-30days on market $189,000 Active 211 DOM
-
2026-04-26price $189,000
-
2025-10-29$199,000 Active
-
2023-06-02soldstatus $155,000
-
2018-12-12soldstatus $67,000
-
1988-12-30soldstatus $51,000
-
1987-08-24soldstatus $46,500
ⓘ Source: listings_history table (triggers on properties + properties_extension) + one-shot
backfill from property_details.listing_events for pre-trigger history.
Tax reassessment forecast NC · Resets to sale price
- Current annual tax
- $2,399 · $200/mo
- Projected year-2 tax
- $2,399 · $200/mo
- Expected delta
- $0/yr ($0/mo · 0.0%)
ⓘ Screening estimate from a state-policy table — verify with the county assessor before closing.
Climate risk First Street
- Flood 1/10 Low FEMA zone X (unshaded) · 0% chance over 30 yrs
- Wildfire 4/10 Moderate
- Heat 7/10 Severe 7 d/yr ≥107°F today · 16 d/yr by 30 yrs out
- Wind 8/10 Severe 80% chance of damaging wind over 30 yrs
- Air quality 1/10 Low 0 unhealthy d/yr today · 0 by 30 yrs out
Nearby sold comps map
Loading sold comps map…
Walkable amenities ~0.75 mi
Loading nearby amenities…
Taxation est. · year 1
- Rental income
- $17,462
- − Mortgage interest
- −$10,587
- − Property taxes
- −$2,399
- − Insurance
- −$945
- − Repairs & maintenance
- −$1,397
- − Management
- −$1,397
- − Depreciation
- −$5,498
- Taxable loss
- −$4,761
- Est. tax savings @ 24.0%
- +$1,143
- After-tax cash flow
- $-300/yr
For passive investors: Depreciation is non-cash, so a rental often shows a tax loss while cash-flowing — sheltering income. Rental losses are passive: they offset passive income freely, and up to $25,000/yr can offset ordinary (W-2) income if you actively participate and your MAGI is under $100k (phasing out to $0 by $150k); unused losses carry forward. On sale, claimed depreciation is recaptured at up to 25%, and gains may owe capital-gains tax (a 1031 exchange can defer both). Figures are a year-1 estimate at your 24.0% rate — not tax advice; consult a CPA.
Schools (NCES district)
- District
- Cumberland County Schools
- NCES district ID
- 3700011
- Math proficiency
- 32% ▼ -2.00%
- Reading proficiency
- 41% ▼ -1.00%
- Median HH income
- $44,168
- Composite
- 31.0/100
- National rank
- #6096
- State rank
- #126 of 178 in NC
Livability — Fayetteville
- Score
- 75/100
- State rank
- #45
- US rank
- #4031
Category grades
Schools grade is shown separately in the Schools card above.
Census & demographics
- Census place
- Fayetteville, NC
- County
- Cumberland County · 265,314 people
- City population
- 226,118
- Metro
- Fayetteville, NC
- Population (ZIP)
- 37,140
- Household income
- $58,563
- Rent vs Own
- Severe rent burden
- 1667.0
Population outlook (Cumberland County) Hauer SSP2
- Today (2025)
- 330,855 people
- By 2030
- 333,523 · +0.8%
- By 2040
- 335,583 · +1.4%
- By 2050
- 335,325 · +1.4%
- By 2075
- 342,853 · +3.6%
- By 2100
- 340,698 · +3.0%
Race, ethnicity, and origin ACS 2023
- Neighborhood character
- Highly diverse neighborhood (Simpson 0.70)
- Race & ethnicity
- Black 39% White 36% Hispanic / Latino 14% Two or more races 12% Asian 3% Native American 1%
- Hispanic origin (detail)
- Mexican 5% Puerto Rican 5%
- Common ancestry
- Slovak 2% Italian 1% Serbian 1%
- Foreign-born
- 8% · Canada, South Korea, Vietnam
- Languages at home
- 87% English-only · Spanish 9% Tagalog/Filipino 1% French/Haitian/Cajun 1%
Political lean MEDSL · Cumberland
- 2024 margin
- D (+13.4) · D 56.1% · R 42.7% · Other 1.2%
- 2008→2024 swing
- -4.3pp toward R · 2008: 17.7pp · 2024: 13.4pp
- All cycles
- 2024: D+13.4 2020: D+16.6 2016: D+16.0 2012: D+19.7 2008: D+17.7
Not yet ingested
- Civics
- —
Market trends
- HPI YoY
- ▼ -59.90%
- Current HPI
- 215.927
- Rent YoY
- ▲ 3.17%
- Metro
- Fayetteville, NC
- State GDP YoY
- ▲ 3.28%
- F500 in state
- 26
Industry mix (Fortune 500 HQ in NC)
| Industry | F500 HQs | Revenue |
|---|---|---|
| Financial Services | 2 | $213B |
|
||
| Retail | 2 | $95B |
|
||
| Industrial Conglomerate | 1 | $38B |
|
||
| Metals / Steel | 1 | $35B |
|
||
| Utilities | 1 | $30B |
|
||
| Industrial Machinery | 1 | $19B |
|
||
Price history
+306.5% since first listed6 events — show timeline
- 2026-04-26 Price Changed $189,000 LPRMLS
- 2025-10-29 Listed $199,000 LPRMLS
- 2023-06-02 Sold (Public Records) $155,000 Public Records
- 2018-12-12 Sold (Public Records) $67,000 Public Records
- 1988-12-30 Sold (Public Records) $51,000 Public Records
- 1987-08-24 Sold (Public Records) $46,500 Public Records
Property tax history
+6.2%/yrLatest (2025): $2,399 · +39.8% YoY. Source: county tax records.
Cash-flow waterfall
monthlySold comps — $/sqft
last 12 mo · ≤1 miLoading sold comps…