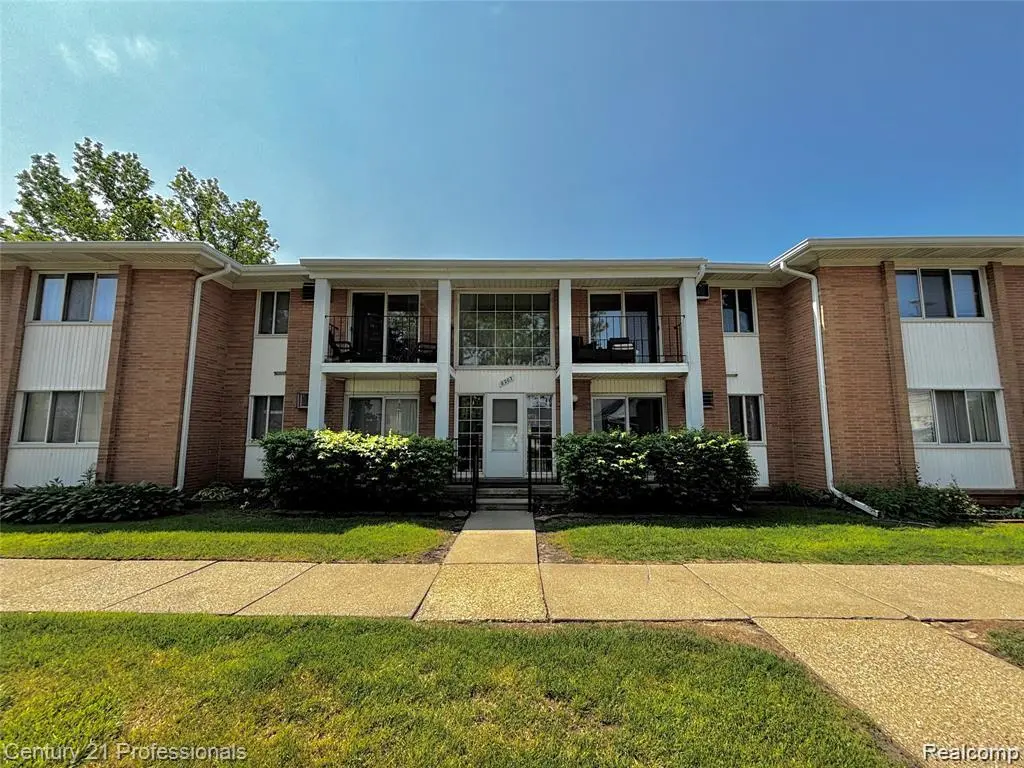
8203 Huntington St #16 · Westland, MI
Flood risk 1/10 · Minimal
- FEMA flood zone
- X (unshaded)
- Chance of flooding over 30 yrs
- 0.0%
- Est. flood insurance / yr
- $473 – $860
Fire risk 1/10 · Minimal
- Est. fire insurance / yr
- $784 – $1,456
Heat risk 3/10 · Minor
- Hot days now (above 98°F)
- 7 days/yr
- Hot days in 30 yrs
- 15 days/yr
Wind risk 2/10 · Minimal
- Chance of severe wind over 30 yrs
- —
Air-quality risk 2/10 · Minimal
- Unhealthy air days now
- 1 days/yr
- Unhealthy air days in 30 yrs
- 2 days/yr
Risk factors via First Street. Map © Google.
Why this score? — see what drove the D+ grade
The composite is a weighted blend of 9 inputs, each scored 0–100. Each bar is that input's sub-score; the figure is the points it added to the 100-point composite (weight × sub-score).
- Cash flow +14.4/30.0
- 1% rule +10.0/10.0
- ARV discount +7.5/15.0
- Schools +4.6/10.0
- DSCR +4.4/10.0
- Livability +3.9/5.0
- Rent growth +2.5/5.0
- Condition / age +2.5/5.0
- Appreciation +0.0/10.0
$74,900
🖨 Deal sheet (PDF) 📄 Offer letter ✓ Due diligence
Listing remarks MLS
2-bedroom upper unit ready to sell! Great condo with Livonia schools, shared basement with storage and laundry. As is sale. BATVAI
Key facts
- Storage
- Livonia schools
- Upper unit
Tags
Property features AI
Finance
- Other: Property type: Residential condominium; Subdivision: HUNTINGTON CLUB; Directions reference: east of Merriman; Cross streets: E Merriman & N Ann Arbor
- HOA & community: Homeowners association with monthly fee; Association fee: $323 per month; Association maintains grounds
Exterior
- Parking: No garage; Assigned parking
- Utilities: Public water; Public sewer
- Home design: Condominium; Two levels; Upper-level entry with steps; Brick construction; Pets allowed
- Construction: Brick exterior; Block foundation
- Exterior features: Balcony; Paved road access
Interior
- Kitchen: Electric cooktop; Free‑standing freezer
- Bedrooms: Total of 4 rooms (includes bedrooms and living spaces)
- Bathrooms: 1 full bathroom
- Heating & cooling: Baseboard heating (natural gas); No cooling
- Interior features: Electric cooktop; Free‑standing freezer; Unfinished basement
Neighborhood map
What this means for you Summary
Snapshot
- This is a 2-bed/1.0-bath condo listed at $75k.
Deal economics
- At list price, monthly cash flow is $15 ($186/yr) — positive.
- The deal already cash-flows at list — no discount required.
- Meets the 1% rule at list price ($1k rent vs $75k).
- Cap rate 6.5% vs local median 4.4% in Westland — top-decile yield for the area; either an underpriced asset or a hidden risk that comps aren't pricing in. Stress-test before assuming the spread holds.
Location & tenants
- Location reads 77/100 on livability (#124 in MI, #3,067 nationally) — a middle-class / working-renter tenant base. Strengths: commute A+, cost of living A+, housing A+; Watch: amenities C-, employment C-, crime D+.
- Livonia Public Schools School District (urban): math 46% / reading 59% proficiency, ranked #77 of 540 in MI (top 14%) — acceptable for families but not a draw, mixed tenant base, ~2y average lease.
- Market conditions: Rents flat; 166 active listings in the ZIP; 3 comparable units currently listed for rent nearby; rentals at typical pace (median 26d on market — plan ~3-4 weeks tenant-placement turnaround); 2,639 units permitted in Wayne County in 2024 (1,216 in 5+ unit buildings).
Forward outlook
- Local home prices are declining (-3.0%/yr); year-one equity from $518 of loan paydown is wiped out by about $2k of value loss. Plan a longer hold.
- Wayne County population projected at -17% by 2050 — secular population decline; favor cash flow + early exit over multi-decade hold.
Negotiation context
- Only 12 days on market — expect competitive offers; lowballing is unlikely to land.
- 6 sale attempts since 14y ago with the ask held roughly flat each time — persistent listings suggest the price (not the market) is what's stuck; bring a comps-based counter.
Risks & watch-outs
- Watch-outs: property tax is 3.1% of price; HOA is 27% of rent.
Questions for the listing agent
- Built in 1967 — when were the roof, HVAC, electrical panel, plumbing, and water heater last replaced?
- Property tax is high relative to price — has the assessment been appealed recently, and will the sale trigger a re-assessment?
- What does the HOA fee cover, when was the last increase, and are there any pending special assessments or reserve-fund shortfalls?
- Any open or pending special assessments — roof, HVAC, plumbing, elevator, façade? What's the per-unit balance and payoff schedule, and is the seller paying it off at close or rolling it to the buyer?
- Is there a deadline driving the sale (1031 exchange, divorce, estate, relocation)? That informs how much negotiation room exists.
- Schools are D-rated, which usually means shorter tenancies and higher turnover. Who's the typical renter profile here, and what's been the actual vacancy rate?
- Crime grade is D in this area — have there been break-ins, vandalism, or insurance claims at this property in the last 3 years? What carrier currently insures it and at what premium?
- The area grade is low — what's the realistic commute time and amenity access for the typical tenant pool here? Any planned neighborhood developments (good or bad) we should know about?
- What's the average days-on-market for RENTAL listings here right now (not sales)? A rising rental-DOM trend means longer vacancies and softer asking-rent achievability than the comps imply.
- What's the recent tenant-quality profile in this submarket — average credit score on applications, eviction rate, late-payment / NSF rate, and stable-employment percentage? A property-management company in the area should have these aggregated.
- How much new apartment / multifamily construction is in the pipeline within 1–3 miles? Heavy new supply (>2% of stock underway) typically softens rents 12–24 months out; light construction supports rent growth.
Investment metrics
- 1% rule
- 1.62% ✓
- Cap rate
- 6.54%
- Cash-on-cash
- 0.88%
- DSCR
- 1.04
- GRM
- 5.2
CMA / ARV
No comps found within radius.
Projected returns pro-forma
-3.0% appreciation · 0.17% rent growth · sell at horizon
- IRR
- -20.4%
- Equity multiple
- 0.32×
- Total profit
- $-14,224
- Equity at exit
- $11,168
- IRR
- -33.6%
- Equity multiple
- -0.10×
- Total profit
- $-22,977
- Equity at exit
- $6,476
Cash invested: $20,972 (down + closing). Projections, not guarantees.
Landlord ↔ Tenant lean methodology
- Overall (STATE)
- 62 Landlord-Friendly
- State Michigan
- 62 Landlord-Friendly · EVEN
- County
- — inherits STATE
- City
- — inherits STATE
ZIP-level market 48185
- Rents YoY
- 0.2%
- Active inventory
- 166
- Price-to-rent
- 5.2×
Monthly cashflow live
- Estimated rent
- $1,210 medium interval (Pro) →
- Mortgage (P&I)
- −$393
- Tax from tax record
- −$193 /mo · $2,318/yr
- Insurance
- −$31
- HOA
- −$323
- Vacancy / Maint / Mgmt
- −$254
- Net cashflow
- $15
Break-even live
Sensitivity live
| Price | -10% $58 | -5% $37 | +0% $15 | +5% $-6 | +10% $-27 |
|---|---|---|---|---|---|
| Rent | -10% $-80 | -5% $-32 | +0% $15 | +5% $63 | +10% $111 |
| Rate | -1.0pp $53 | -0.5pp $35 | base $15 | +0.5pp $-4 | +1.0pp $-24 |
UW: 25.0% down · 7.5% · 30yr · 1.5% tax · 5.0% vac · 8.0% maint · 8.0% mgmt
Financing live
Cash to close
- Down payment
- $18,725
- Closing costs
- $2,247
- Reserves months
- —
- Total cash needed
- —
Loan-product check · same deal, 3 products live
Conventional
25% down · 7.5% · 30yr
- Down + closing
- —
- Monthly P&I
- —
- Monthly cashflow
- —
- DSCR
- —
- Eligible?
- —
Personal DTI + credit; lowest rate.
DSCR
20% down · 8.5% · 30yr
- Down + closing
- —
- Monthly P&I
- —
- Monthly cashflow
- —
- DSCR
- —
- Eligible?
- —
No personal income docs; deal must DSCR.
Hard money
10% down · 12.0% · 12mo
- Down + closing
- —
- Monthly P&I
- —
- Monthly cashflow
- —
- DSCR
- —
- Eligible?
- —
Short-term bridge; refi at stabilization.
Rent comps 3 comps
| Address | Beds | Baths | Sqft | Rent | $/sqft | DOM | Units | Dist |
|---|---|---|---|---|---|---|---|---|
| 7560 N Merriman Rd Westland, MI | 1.0–2.0 | 1.0 | 805 | $1,135 | $1.41 | 25d | 2 | 0.26mi |
| 31680 Cowan Rd Westland, MI | 1.0–2.0 | 1.0 | 700 | $1,300 | $1.86 | 45d | 1 | 0.56mi |
| 7127 Bonnie Dr Westland, MI | 1.0 | 1.0 | 750 | $1,079 | $1.44 | 6d | 6 | 1.19mi |
HOA detail condo
- Monthly dues
- $323 · $3,876/yr
- Assessments
- None detected in remarks — confirm with the listing agent.
Listing history 9 events
-
2026-06-21days on market $74,900 Active 12 DOM
-
2026-06-18days on market $74,900 Active 9 DOM
-
2026-06-17days on market $74,900 Active 8 DOM
-
2026-06-16days on market $74,900 Active 7 DOM
-
2026-06-15days on market $74,900 Active 6 DOM
-
2026-06-13remarks 212-char remark
-
2026-06-13days on market $74,900 Active 4 DOM
-
2026-06-10remarks 130-char remark
-
2026-06-10$74,900 Active 1 DOM
ⓘ Source: listings_history table (triggers on properties + properties_extension) + one-shot
backfill from property_details.listing_events for pre-trigger history.
Tax reassessment forecast MI · Partial reset (capped growth)
- Current annual tax
- $2,318 · $193/mo
- Projected year-2 tax
- $2,318 · $193/mo
- Expected delta
- $0/yr ($0/mo · 0.0%)
ⓘ Screening estimate from a state-policy table — verify with the county assessor before closing.
Climate risk First Street
- Flood 1/10 Low FEMA zone X (unshaded) · 0% chance over 30 yrs
- Wildfire 1/10 Low
- Heat 3/10 Moderate 7 d/yr ≥98°F today · 15 d/yr by 30 yrs out
- Wind 2/10 Low
- Air quality 2/10 Low 1 unhealthy d/yr today · 2 by 30 yrs out
Nearby sold comps map
Loading sold comps map…
Walkable amenities ~0.75 mi
Loading nearby amenities…
Taxation est. · year 1
- Rental income
- $14,516
- − Mortgage interest
- −$4,196
- − Property taxes
- −$2,318
- − Insurance
- −$374
- − Repairs & maintenance
- −$1,161
- − Management
- −$1,161
- − HOA
- −$3,876
- − Depreciation
- −$2,179
- Taxable loss
- −$750
- Est. tax savings @ 24.0%
- +$180
- After-tax cash flow
- $366/yr
For passive investors: Depreciation is non-cash, so a rental often shows a tax loss while cash-flowing — sheltering income. Rental losses are passive: they offset passive income freely, and up to $25,000/yr can offset ordinary (W-2) income if you actively participate and your MAGI is under $100k (phasing out to $0 by $150k); unused losses carry forward. On sale, claimed depreciation is recaptured at up to 25%, and gains may owe capital-gains tax (a 1031 exchange can defer both). Figures are a year-1 estimate at your 24.0% rate — not tax advice; consult a CPA.
Schools (NCES district)
- District
- Livonia Public Schools School District
- NCES district ID
- 2621840
- Math proficiency
- 46% ▼ -5.00%
- Reading proficiency
- 59% ▬ 0.00%
- Median HH income
- $65,268
- Composite
- 46.27/100
- National rank
- #2480
- State rank
- #77 of 540 in MI
Livability — Westland
- Score
- 77/100
- State rank
- #124
- US rank
- #3067
Category grades
Schools grade is shown separately in the Schools card above.
Census & demographics
- Census place
- Westland, MI
- County
- Wayne County · 1,562,939 people
- City population
- 83,633
- Metro
- Detroit-Warren-Dearborn, MI
- Population (ZIP)
- 48,530
- Household income
- $60,854
- Rent vs Own
- Severe rent burden
- 2263.0
Population outlook (Wayne County) Hauer SSP2
- Today (2025)
- 1,675,273 people
- By 2030
- 1,620,300 · -3.3%
- By 2040
- 1,502,341 · -10.3%
- By 2050
- 1,384,039 · -17.4%
- By 2075
- 1,124,592 · -32.9%
- By 2100
- 881,193 · -47.4%
Race, ethnicity, and origin ACS 2023
- Neighborhood character
- Diverse neighborhood (Simpson 0.56)
- Race & ethnicity
- White 63% Black 22% Two or more races 7% Asian 5% Hispanic / Latino 5%
- Common ancestry
- Romanian 11% Lithuanian 3% Italian 2%
- Foreign-born
- 11% · Canada, China
- Languages at home
- 87% English-only · Other Indo-European 5% Arabic 2% Spanish 2%
Political lean MEDSL · Wayne
- 2024 margin
- Strong D (+29.0) · D 62.7% · R 33.7% · Other 3.6%
- 2008→2024 swing
- -20.5pp toward R · 2008: 49.5pp · 2024: 29.0pp
- All cycles
- 2024: D+29.0 2020: D+38.1 2016: D+37.3 2012: D+46.9 2008: D+49.5
Not yet ingested
- Civics
- —
Market trends
- HPI YoY
- ▼ -265.65%
- Current HPI
- 237.7594
- Rent YoY
- ▲ 0.17%
- Metro
- Detroit-Warren-Dearborn, MI
- State GDP YoY
- ▲ 1.37%
- F500 in state
- 28
Industry mix (Fortune 500 HQ in MI)
| Industry | F500 HQs | Revenue |
|---|---|---|
| Automotive Parts | 3 | $48B |
|
||
| Automotive | 2 | $372B |
|
||
| Chemicals | 1 | $45B |
|
||
| Automotive Retail | 1 | $29B |
|
||
| Healthcare / Medical Devices | 1 | $23B |
|
||
| Automotive Technology | 1 | $20B |
|
||
Price history
+24.8% since first listed22 events — show timeline
- 2026-06-08 Listed $74,900 REALCOMP
- 2026-06-08 Listed $74,900 MiRealSource-MiMLS
- 2023-12-20 Sold (Public Records) $65,900 Public Records
- 2023-12-12 Sold (Public Records) $35,000 Public Records
- 2023-11-22 Sold (MLS) $65,900 MiRealSource-MiMLS
- 2023-11-22 Sold (MLS) $65,900 REALCOMP
- 2023-10-30 Pending — REALCOMP
- 2023-10-30 Pending — MiRealSource-MiMLS
- 2023-10-16 Contingent — MiRealSource-MiMLS
- 2023-10-16 Contingent — REALCOMP
- 2023-10-05 Price Changed $68,900 MiRealSource-MiMLS
- 2023-10-04 Price Changed $68,900 REALCOMP
- 2023-09-17 Listed $74,900 REALCOMP
- 2023-09-17 Coming Soon $74,900 REALCOMP
- 2023-09-16 Listed $74,900 MiRealSource-MiMLS
- 2013-02-25 Sold (MLS) $18,000 MiRealSource-MiMLS
- 2013-02-25 Sold (MLS) $18,000 REALCOMP
- 2013-02-13 Listing Removed — MiRealSource-MiMLS
- 2013-02-13 Listing Removed — REALCOMP
- 2012-12-14 Listed $18,000 MiRealSource-MiMLS
- 2012-12-14 Listed $18,000 REALCOMP
- 2000-12-14 Sold (Public Records) $60,000 Public Records
Property tax history
+13.1%/yrLatest (2025): $2,318 · +2.4% YoY. Source: county tax records.
Cash-flow waterfall
monthlySold comps — $/sqft
last 12 mo · ≤1 miLoading sold comps…