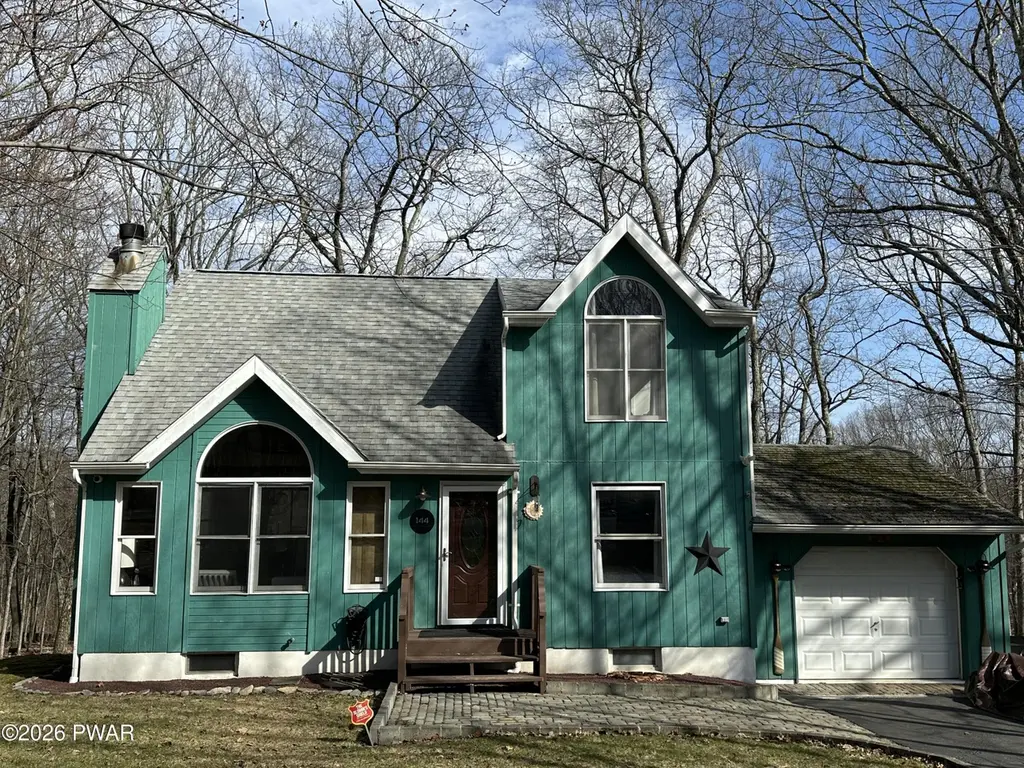
144 Westwood · Pocono Ranch Lands, PA
Flood risk No data
- FEMA flood zone
- —
- Chance of flooding over 30 yrs
- —
- Est. flood insurance / yr
- —
Fire risk No data
- Est. fire insurance / yr
- —
Heat risk No data
- Hot days now (above threshold)
- —
- Hot days in 30 yrs
- —
Wind risk No data
- Chance of severe wind over 30 yrs
- —
Air-quality risk No data
- Unhealthy air days now
- —
- Unhealthy air days in 30 yrs
- —
Risk factors via First Street. Map © Google.
Why this score? — see what drove the D grade
The composite is a weighted blend of 9 inputs, each scored 0–100. Each bar is that input's sub-score; the figure is the points it added to the 100-point composite (weight × sub-score).
- Appreciation +10.0/10.0
- ARV discount +8.3/15.0
- Cash flow +7.4/30.0
- Schools +4.7/10.0
- Livability +3.3/5.0
- 1% rule +2.6/10.0
- Rent growth +2.5/5.0
- Condition / age +2.5/5.0
- DSCR +1.6/10.0
$295,000
🖨 Deal sheet (PDF) 📄 Offer letter ✓ Due diligence
Listing remarks MLS
Completely renovated home in amenity filled community. New roof, flooring, paint, kitchen appliances, plumbing, septic just cleaned out & new pump. Perimeter French drain installed. Walk to pool. , Beds Description: 1 BED 2nd, Beds Description: 2+Bed1st, Beds Description: 1 BED 2nd, Baths: 1 Bath Level 2, Baths: 1/2 Bath Lev L, Baths: 2 Bath Lev 1, Eating Area: Dining Area
Key facts
- Open floor plan
- Versatile loft area
- Large walk-in closet
Tags
Property features AI
Finance
- Other: Subdivision: Wild Acres
- HOA & community: Homeowners association with annual fee; Association amenities include gated access, pool, playground, lake, beach access and beach rights; Association provides snow removal
Exterior
- Parking: Attached garage; Driveway (paved)
- Security: Community security (gated community)
- Utilities: Paved road surface
- Home design: Single-family house; Updated/remodeled condition; Two stories (three or more levels layout); Above-grade and below-grade finished living areas
- Construction: Finished below-grade living area
- Exterior features: Deck; Exterior lighting; Front and back yard; Paved road access
Interior
- Kitchen: Dishwasher; Refrigerator
- Bedrooms: Total of 7 rooms (includes bedrooms and living spaces)
- Bathrooms: 2 full bathrooms; 1 half bathroom
- Heating & cooling: Electric heating
- Interior features: Cathedral ceilings; Open floor plan; Finished full basement
- Laundry & utility: Washer; Dryer; Laundry room located on lower level
Neighborhood map
What this means for you Summary
Snapshot
- This is a 3-bed/2.5-bath single-family listed at $295k.
Deal economics
- At list price, monthly cash flow is $-374 ($-4k/yr) — negative.
- To cash-flow at today's rent, offer at most $241k (18.3% below list).
- To meet the 1% rule (rent ≥ 1% of price), the offer needs to be $225k (23.7% below list).
- Recommended offer: $225k (23.7% below list) — sets the bar for 1% rule.
Location & tenants
- Location reads 66/100 on livability (#1,037 in PA) — a middle-class / working-renter tenant base. Strengths: crime A+, cost of living A+, housing A; Watch: employment D, health & safety D, amenities F.
- Delaware Valley SD (rural): math 41% / reading 66% proficiency, ranked #121 of 539 in PA (top 22%) — acceptable for families but not a draw, mixed tenant base, ~2y average lease.
- Zoned schools: Delaware Valley Hs (math 77% / reading 75%, grade A-, #25 of 437 statewide, top 6%, 1,418 students, 37% FRL).
- Zoned-school proficiency averages 76% at this address vs 54% district-wide (+22 pts) — the actual schools serving this property are materially stronger than the Delaware Valley SD average implies; a family-tenant draw the district grade alone would hide.
- Market conditions: 213 active listings in the ZIP; 2 comparable units currently listed for rent nearby; 213 units permitted in Pike County in 2024 (0 in 5+ unit buildings).
Forward outlook
- In year one you build about $32k of equity ($2k loan paydown + $30k appreciation (10.0% local appreciation)).
- Pike County population projected at -25% by 2050 — secular population decline; favor cash flow + early exit over multi-decade hold.
- By year 2, paydown + projected appreciation supports a ~$51k cash-out refi (75% LTV) — recoverable capital for the next deal without selling this one.
Negotiation context
- Only 4 days on market — expect competitive offers; lowballing is unlikely to land.
- 2 sale attempts since 9y ago with the ask held roughly flat each time — persistent listings suggest the price (not the market) is what's stuck; bring a comps-based counter.
- Current owner paid $130k; list at $295k implies a 127% gain — meaningful room to come down on a strong offer.
Questions for the listing agent
- What do current leases actually rent for vs. the listed asking? Can we see a recent rent roll and the last 12 months of T-12 income?
- What does the HOA fee cover, when was the last increase, and are there any pending special assessments or reserve-fund shortfalls?
- Is there a deadline driving the sale (1031 exchange, divorce, estate, relocation)? That informs how much negotiation room exists.
- Schools are F-rated, which usually means shorter tenancies and higher turnover. Who's the typical renter profile here, and what's been the actual vacancy rate?
- The area grade is low — what's the realistic commute time and amenity access for the typical tenant pool here? Any planned neighborhood developments (good or bad) we should know about?
- What's the average days-on-market for RENTAL listings here right now (not sales)? A rising rental-DOM trend means longer vacancies and softer asking-rent achievability than the comps imply.
- What's the recent tenant-quality profile in this submarket — average credit score on applications, eviction rate, late-payment / NSF rate, and stable-employment percentage? A property-management company in the area should have these aggregated.
- How much new for-sale + rental construction is in the pipeline within 1–3 miles? Heavy new supply typically softens prices + rents 12–24 months out; constrained supply supports both.
Investment metrics
- 1% rule
- 0.76% ✗
- Cap rate
- 4.77%
- Cash-on-cash
- -5.43%
- DSCR
- 0.76
- GRM
- 10.9
CMA / ARV
- ARV (on-the-fly)
- $300,612
- Comps found
- 12
Show comp detail 12 sales within ~0.75 mi
| Address | Dist | Beds/Ba | Sqft | Sold | Price | $/sf | Match |
|---|---|---|---|---|---|---|---|
| 144 Westwood | 0.00mi | 3/2.5 | 2,132 (0%) | 1mo | $300,000 | $141 | 99 |
| 157 Westwood Dr | 0.07mi | 3/2.0 | 2,134 (+0%) | 12mo | $275,000 | $129 | 85 |
| 139 Westwood Dr | 0.05mi | 3/3.0 | 2,200 (+3%) | 8mo | $335,000 | $152 | 84 |
| 123 Lakeview Dr | 0.51mi | 3/2.0 | 2,164 (+2%) | 10mo | $249,000 | $115 | 64 |
| 104 Lakeview Dr | 0.65mi | 3/2.0 | 2,244 (+5%) | 2mo | $317,000 | $141 | 57 |
| 157 Mountain Lake Dr | 0.74mi | 3/2.0 | 2,206 (+4%) | 0mo | $550,000 | $249 | 57 |
| 174 Westwood Dr | 0.20mi | 3/3.0 | 2,435 (+14%) | 18mo | $336,000 | $138 | 50 |
| 240 Mountain Top Dr | 0.61mi | 4/3.0 (+1) | 1,936 (-9%) | 5mo | $365,000 | $189 | 45 |
| 116 Stroud Ct | 0.57mi | 3/2.0 | 1,904 (-11%) | 13mo | $263,000 | $138 | 43 |
| 115 Ridge Rd | 0.65mi | 3/3.0 | 1,956 (-8%) | 14mo | $365,000 | $187 | 42 |
| 109 Stamford Rd | 0.29mi | 3/2.0 | 1,816 (-15%) | 23mo | $265,000 | $146 | 41 |
| 123 Fairview Dr | 0.47mi | 4/3.0 (+1) | 2,336 (+10%) | 17mo | $275,000 | $118 | 41 |
Match score weights: distance 35% · size 25% · config 20% · recency 20%. Top-matched comps best support the ARV.
Projected returns pro-forma
10.0% appreciation · 3.0% rent growth · sell at horizon
- IRR
- 20.4%
- Equity multiple
- 2.66×
- Total profit
- $136,947
- Equity at exit
- $265,759
- IRR
- 18.6%
- Equity multiple
- 6.11×
- Total profit
- $422,228
- Equity at exit
- $573,120
Cash invested: $82,600 (down + closing). Projections, not guarantees.
Landlord ↔ Tenant lean methodology
- Overall (STATE)
- 62 Landlord-Friendly
- State Pennsylvania
- 62 Landlord-Friendly · EVEN
- County
- — inherits STATE
- City
- — inherits STATE
ZIP-level market 18328
- Home prices YoY
- 18.1%
- Active inventory
- 213
- Price-to-rent
- 10.9×
Monthly cashflow live
- Estimated rent
- $2,251 medium interval (Pro) →
- Mortgage (P&I)
- −$1,547
- Tax est. 1.5%
- −$369 /mo · $4,425/yr
- Insurance
- −$123
- HOA
- −$114
- Vacancy / Maint / Mgmt
- −$473
- Net cashflow
- $-374
Break-even live
Sensitivity live
| Price | -10% $-170 | -5% $-272 | +0% $-374 | +5% $-476 | +10% $-578 |
|---|---|---|---|---|---|
| Rent | -10% $-552 | -5% $-463 | +0% $-374 | +5% $-285 | +10% $-196 |
| Rate | -1.0pp $-225 | -0.5pp $-299 | base $-374 | +0.5pp $-450 | +1.0pp $-528 |
UW: 25.0% down · 7.5% · 30yr · 1.5% tax · 5.0% vac · 8.0% maint · 8.0% mgmt
Financing live
Cash to close
- Down payment
- $73,750
- Closing costs
- $8,850
- Reserves months
- —
- Total cash needed
- —
Loan-product check · same deal, 3 products live
Conventional
25% down · 7.5% · 30yr
- Down + closing
- —
- Monthly P&I
- —
- Monthly cashflow
- —
- DSCR
- —
- Eligible?
- —
Personal DTI + credit; lowest rate.
DSCR
20% down · 8.5% · 30yr
- Down + closing
- —
- Monthly P&I
- —
- Monthly cashflow
- —
- DSCR
- —
- Eligible?
- —
No personal income docs; deal must DSCR.
Hard money
10% down · 12.0% · 12mo
- Down + closing
- —
- Monthly P&I
- —
- Monthly cashflow
- —
- DSCR
- —
- Eligible?
- —
Short-term bridge; refi at stabilization.
Rent comps 2 comps
| Address | Beds | Baths | Sqft | Rent | $/sqft | DOM | Units | Dist |
|---|---|---|---|---|---|---|---|---|
| 159 Spring Dr Dingmans Ferry, PA | 3.0 | 2.0 | 1920 | $2,000 | $1.04 | 7d | 1 | 0.41mi |
| 368 Wild Acres Dr Dingmans Ferry, PA | 4.0 | 3.0 | 2262 | $3,000 | $1.33 | 0d | 1 | 1.27mi |
HOA detail
- Monthly dues
- $114 · $1,368/yr
- Likely covers
- pool
Listing history 4 events
-
2026-04-13status Pending
-
2026-04-10$295,000 Active
-
2017-12-14soldstatus $130,000 382-char remark
Show marketing remark (382 chars)
Completely renovated home in amenity filled community. New roof, flooring, paint, kitchen appliances, plumbing, septic just cleaned out & new pump. Perimeter French drain installed. Walk to pool. , Beds Description: 1 BED 2nd, Beds Description: 2+Bed1st, Beds Description: 1 BED 2nd, Baths: 1 Bath Level 2, Baths: 1/2 Bath Lev L, Baths: 2 Bath Lev 1, Eating Area: Dining Area
-
2017-10-02$137,900 382-char remark
Show marketing remark (382 chars)
Completely renovated home in amenity filled community. New roof, flooring, paint, kitchen appliances, plumbing, septic just cleaned out & new pump. Perimeter French drain installed. Walk to pool. , Beds Description: 1 BED 2nd, Beds Description: 2+Bed1st, Beds Description: 1 BED 2nd, Baths: 1 Bath Level 2, Baths: 1/2 Bath Lev L, Baths: 2 Bath Lev 1, Eating Area: Dining Area
ⓘ Source: listings_history table (triggers on properties + properties_extension) + one-shot
backfill from property_details.listing_events for pre-trigger history.
Nearby sold comps map
Loading sold comps map…
Walkable amenities ~0.75 mi
Loading nearby amenities…
Taxation est. · year 1
- Rental income
- $27,018
- − Mortgage interest
- −$16,525
- − Property taxes
- −$4,425
- − Insurance
- −$1,475
- − Repairs & maintenance
- −$2,161
- − Management
- −$2,161
- − HOA
- −$1,368
- − Depreciation
- −$8,582
- Taxable loss
- −$9,680
- Est. tax savings @ 24.0%
- +$2,323
- After-tax cash flow
- $-2,165/yr
For passive investors: Depreciation is non-cash, so a rental often shows a tax loss while cash-flowing — sheltering income. Rental losses are passive: they offset passive income freely, and up to $25,000/yr can offset ordinary (W-2) income if you actively participate and your MAGI is under $100k (phasing out to $0 by $150k); unused losses carry forward. On sale, claimed depreciation is recaptured at up to 25%, and gains may owe capital-gains tax (a 1031 exchange can defer both). Figures are a year-1 estimate at your 24.0% rate — not tax advice; consult a CPA.
Schools (NCES district)
- District
- Delaware Valley SD
- NCES district ID
- 4207530
- Math proficiency
- 41% ▼ -12.00%
- Reading proficiency
- 66% ▼ -9.00%
- Median HH income
- $64,202
- Composite
- 46.95/100
- National rank
- #2359
- State rank
- #121 of 539 in PA
Livability — Pocono Ranch Lands
- Score
- 66/100
- State rank
- #1037
- US rank
- #11566
Category grades
Schools grade is shown separately in the Schools card above.
Census & demographics
- Population (ZIP)
- 8,061
Population outlook (Pike County) Hauer SSP2
- Today (2025)
- 53,548 people
- By 2030
- 51,622 · -3.6%
- By 2040
- 46,490 · -13.2%
- By 2050
- 40,372 · -24.6%
- By 2075
- 31,951 · -40.3%
- By 2100
- 26,821 · -49.9%
Race, ethnicity, and origin ACS 2023
- Neighborhood character
- Predominantly White (85%)
- Race & ethnicity
- White 85% Hispanic / Latino 10% Two or more races 8%
- Hispanic origin (detail)
- Puerto Rican 5%
- Common ancestry
- Scotch-Irish 6% Romanian 6% Iranian 4%
- Foreign-born
- 9% · Canada, Jamaica
- Languages at home
- 86% English-only · Spanish 6% Russian/Polish/Slavic 5% Other Indo-European 2%
Political lean MEDSL · Pike
- 2024 margin
- Strong R (+24.1) · D 37.6% · R 61.6%
- 2008→2024 swing
- -19.8pp toward R · 2008: -4.2pp · 2024: -24.1pp
- All cycles
- 2024: R+24.1 2020: R+19.0 2016: R+26.0 2012: R+11.0 2008: R+4.2
Not yet ingested
- Civics
- —
Market trends
- HPI YoY
- ▲ 38.13%
- Current HPI
- 248.4494
- Rent YoY
- —
- Metro
- —
- State GDP YoY
- ▲ 1.68%
- F500 in state
- 34
Industry mix (Fortune 500 HQ in PA)
| Industry | F500 HQs | Revenue |
|---|---|---|
| Healthcare | 2 | $309B |
|
||
| Insurance | 2 | $27B |
|
||
| Telecommunications / Media | 1 | $124B |
|
||
| Industrial Distribution | 1 | $22B |
|
||
| Financial Services | 1 | $20B |
|
||
| Chemicals / Materials | 1 | $18B |
|
||
Price history
+113.9% since first listed4 events — show timeline
- 2026-04-13 Pending — PWMLS
- 2026-04-10 Listed $295,000 PWMLS
- 2017-12-14 Sold (MLS) $130,000 PWMLS
- 2017-10-02 Listed $137,900 PWMLS
Cash-flow waterfall
monthlySold comps — $/sqft
last 12 mo · ≤1 miLoading sold comps…