22908 Shell Shore Dr · Emerald Bay, TX
Flood risk 1/10 · Minimal
- FEMA flood zone
- X (unshaded)
- Chance of flooding over 30 yrs
- 0.0%
- Est. flood insurance / yr
- $507 – $1,088
Fire risk 4/10 · Minor
- Est. fire insurance / yr
- $1,222 – $2,270
Heat risk 7/10 · Major
- Hot days now (above 109°F)
- 7 days/yr
- Hot days in 30 yrs
- 26 days/yr
Wind risk 6/10 · Moderate
- Chance of severe wind over 30 yrs
- 77.0%
Air-quality risk 1/10 · Minimal
- Unhealthy air days now
- 0 days/yr
- Unhealthy air days in 30 yrs
- 0 days/yr
Risk factors via First Street. Map © Google.
Why this score? — see what drove the B- grade
The composite is a weighted blend of 9 inputs, each scored 0–100. Each bar is that input's sub-score; the figure is the points it added to the 100-point composite (weight × sub-score).
- Cash flow +30.0/30.0
- DSCR +10.0/10.0
- 1% rule +8.0/10.0
- ARV discount +7.5/15.0
- Schools +5.4/10.0
- Livability +3.6/5.0
- Rent growth +2.5/5.0
- Condition / age +2.5/5.0
- Appreciation +0.0/10.0
$115,500
🖨 Deal sheet (PDF) 📄 Offer letter ✓ Due diligence
Listing remarks MLS
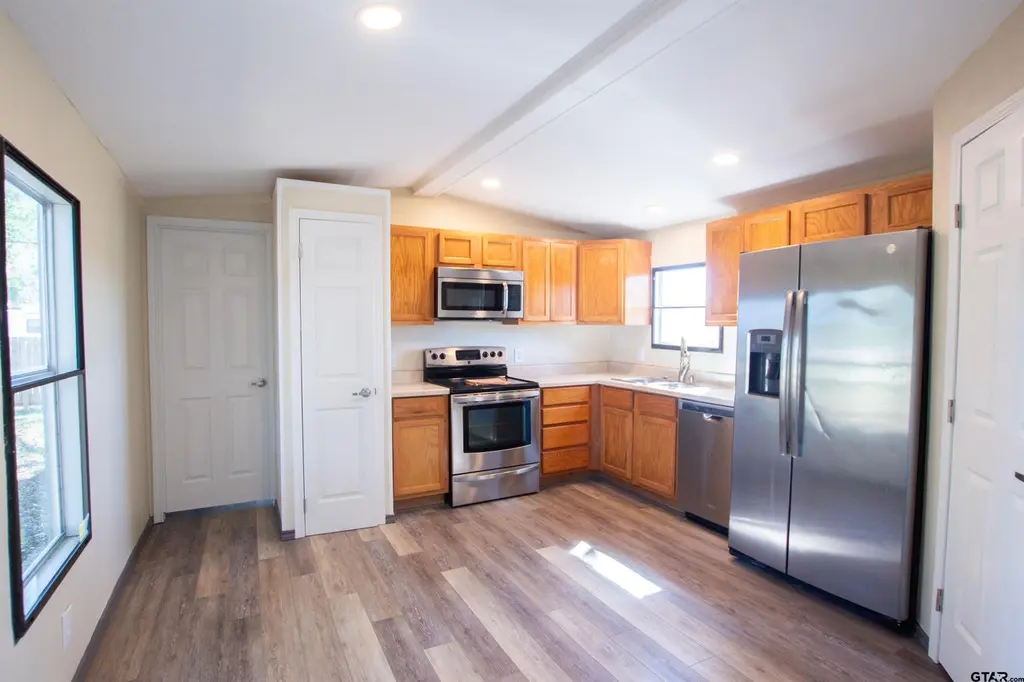
Welcome to this beautifully updated 2-bedroom, 2-bath home located in the highly sought-after Shell Shore subdivision. Sitting on a spacious . 41-acre lot and just minutes from Lake Palestine, this property offers comfort, convenience, and a touch of lakeside living. Residents of Shell Shore also enjoy access to the subdivision’s private boat launch—perfect for weekend getaways and lake adventures. This home has received several recent updates, including new siding, new flooring, and beautifully remodeled throughout the entire home, giving it a fresh and inviting feel throughout. The main living areas are open and spacious, filled with natural light from the many windows that create a warm and welcoming atmosphere. The kitchen offers plenty of room for cooking, dining, and entertaining, with an open layout that provides flexibility for your needs. Both bedrooms are nicely sized, offering comfort and versatility, while the newly renovated bathrooms bring modern style and charm—especially the master bathroom, which stands out with its unique character and design. Whether you’re looking for a peaceful full-time residence, a weekend retreat, or a smart investment near Lake Palestine, this charming home is one you won’t want to miss.
Key facts
- New siding
- New flooring
- Private boat launch
Tags
Neighborhood map
What this means for you Summary
Snapshot
- This is a 2-bed/2.0-bath manufactured listed at $116k.
Deal economics
- At list price, monthly cash flow is $472 ($6k/yr) — positive.
- The deal already cash-flows at list — no discount required.
- Meets the 1% rule at list price ($2k rent vs $116k).
- Recommended offer: $109k (6.0% below list) — sets the bar for market timing.
- Cap rate 11.2% vs local median 2.9% in Emerald Bay — top-decile yield for the area; either an underpriced asset or a hidden risk that comps aren't pricing in. Stress-test before assuming the spread holds.
Location & tenants
- Location reads 71/100 on livability (#293 in TX) — a middle-class / working-renter tenant base. Strengths: crime A+, housing A+, employment A; Watch: amenities F, commute F, health & safety D-.
- Bullard ISD (rural): math 65% / reading 60% proficiency, ranked #48 of 826 in TX (top 6%) — acceptable for families but not a draw, mixed tenant base, ~2y average lease.
- Market conditions: 581 active listings in the ZIP; 1 comparable units currently listed for rent nearby; 595 units permitted in Smith County in 2024 (45 in 5+ unit buildings).
Forward outlook
- Local home prices are declining (-3.0%/yr); year-one equity from $799 of loan paydown is wiped out by about $3k of value loss. Plan a longer hold.
- Smith County population projected at +24% by 2050 — long-run rental-demand tailwind backs the buy-and-hold thesis.
- At projected returns (-3.0% appreciation + 3.0% rent growth), your $32k cash investment doubles in ~7 years — after that, you're playing with house money.
Negotiation context
- It's been on market 66 days — a 6% lower offer ($109k) is reasonable based on typical stale-listing flexibility.
- 3 sale attempts since 2y ago with the ask held roughly flat each time — persistent listings suggest the price (not the market) is what's stuck; bring a comps-based counter.
Risks & watch-outs
- Climate carrying-cost: major wind risk, 77% chance of damaging wind over 30y; extreme-heat days projected 7→26/yr by 2055 (HVAC capex compounding) — expect insurance premiums to compound above CPI over the hold.
Questions for the listing agent
- It's been on market 66 days. Have you received any prior offers? Is the seller open to a 6% concession, seller financing, or rate buy-down credit?
- Why hasn't it sold? Are there any deal-killer items the seller is aware of (foundation, flood, title, zoning, code violations)?
- Is there a deadline driving the sale (1031 exchange, divorce, estate, relocation)? That informs how much negotiation room exists.
- What's the average days-on-market for RENTAL listings here right now (not sales)? A rising rental-DOM trend means longer vacancies and softer asking-rent achievability than the comps imply.
- What's the recent tenant-quality profile in this submarket — average credit score on applications, eviction rate, late-payment / NSF rate, and stable-employment percentage? A property-management company in the area should have these aggregated.
- How much new for-sale + rental construction is in the pipeline within 1–3 miles? Heavy new supply typically softens prices + rents 12–24 months out; constrained supply supports both.
Investment metrics
- 1% rule
- 1.30% ✓
- Cap rate
- 11.20%
- Cash-on-cash
- 17.52%
- DSCR
- 1.78
- GRM
- 6.4
CMA / ARV
- ARV (median comp)
- $254,348
- List price
- $115,500
- Delta
- -54.59%
- Verdict
- UNDERPRICED
- Comps
- 1 within 2.0 mi
Projected returns pro-forma
-3.0% appreciation · 3.0% rent growth · sell at horizon
- IRR
- 8.9%
- Equity multiple
- 1.35×
- Total profit
- $11,332
- Equity at exit
- $17,221
- IRR
- 18.1%
- Equity multiple
- 2.50×
- Total profit
- $48,477
- Equity at exit
- $9,986
Cash invested: $32,340 (down + closing). Projections, not guarantees.
Landlord ↔ Tenant lean methodology
- Overall (STATE)
- 87 Strongly Landlord-Friendly
- State Texas
- 87 Strongly Landlord-Friendly · R+5
- County
- — inherits STATE
- City
- — inherits STATE
ZIP-level market 75757
- Home prices YoY
- -23.6%
- Active inventory
- 581
- Price-to-rent
- 6.4×
Monthly cashflow live
- Estimated rent
- $1,500 medium interval (Pro) →
- Mortgage (P&I)
- −$606
- Tax from tax record
- −$59 /mo · $707/yr
- Insurance
- −$48
- HOA
- −$0
- Vacancy / Maint / Mgmt
- −$315
- Net cashflow
- $472
Break-even live
Sensitivity live
| Price | -10% $538 | -5% $505 | +0% $472 | +5% $440 | +10% $407 |
|---|---|---|---|---|---|
| Rent | -10% $354 | -5% $413 | +0% $472 | +5% $532 | +10% $591 |
| Rate | -1.0pp $530 | -0.5pp $502 | base $472 | +0.5pp $442 | +1.0pp $412 |
UW: 25.0% down · 7.5% · 30yr · 1.5% tax · 5.0% vac · 8.0% maint · 8.0% mgmt
Financing live
Cash to close
- Down payment
- $28,875
- Closing costs
- $3,465
- Reserves months
- —
- Total cash needed
- —
Loan-product check · same deal, 3 products live
Conventional
25% down · 7.5% · 30yr
- Down + closing
- —
- Monthly P&I
- —
- Monthly cashflow
- —
- DSCR
- —
- Eligible?
- —
Personal DTI + credit; lowest rate.
DSCR
20% down · 8.5% · 30yr
- Down + closing
- —
- Monthly P&I
- —
- Monthly cashflow
- —
- DSCR
- —
- Eligible?
- —
No personal income docs; deal must DSCR.
Hard money
10% down · 12.0% · 12mo
- Down + closing
- —
- Monthly P&I
- —
- Monthly cashflow
- —
- DSCR
- —
- Eligible?
- —
Short-term bridge; refi at stabilization.
Rent comps 1 comps
| Address | Beds | Baths | Sqft | Rent | $/sqft | DOM | Units | Dist |
|---|---|---|---|---|---|---|---|---|
| 22712 Creekwood Dr Flint, TX | 2.0 | 1.0 | 992 | $1,500 | $1.51 | 14d | 1 | 1.37mi |
Listing history 22 events
-
2026-06-19days on market $115,500 Active 66 DOM
-
2026-06-18days on market $115,500 Active 65 DOM
-
2026-06-17days on market $115,500 Active 64 DOM
-
2026-06-16days on market $115,500 Active 63 DOM
-
2026-06-15days on market $115,500 Active 62 DOM
-
2026-06-14days on market $115,500 Active 60 DOM
-
2026-06-13days on market $115,500 Active 59 DOM
-
2026-06-10days on market $115,500 Active 57 DOM
-
2026-06-09days on market $115,500 Active 56 DOM
-
2026-06-08days on market $115,500 Active 55 DOM
-
2026-06-07days on market $115,500 Active 54 DOM
-
2026-06-03days on market $115,500 Active 50 DOM
-
2026-06-02days on market $115,500 Active 49 DOM
-
2026-06-01days on market $115,500 Active 48 DOM
-
2026-05-31days on market $115,500 Active 47 DOM
-
2026-05-30days on market $115,500 Active 46 DOM
-
2026-04-14$115,500 Active 1278-char remark
Show marketing remark (1278 chars)
Welcome to this beautifully updated 2-bedroom, 2-bath home located in the highly sought-after Shell Shore subdivision. Sitting on a spacious . 41-acre lot and just minutes from Lake Palestine, this property offers comfort, convenience, and a touch of lakeside living. Residents of Shell Shore also enjoy access to the subdivision’s private boat launch—perfect for weekend getaways and lake adventures. This home has received several recent updates, including new siding, new flooring, and beautifully remodeled throughout the entire home, giving it a fresh and inviting feel throughout. The main living areas are open and spacious, filled with natural light from the many windows that create a warm and welcoming atmosphere. The kitchen offers plenty of room for cooking, dining, and entertaining, with an open layout that provides flexibility for your needs. Both bedrooms are nicely sized, offering comfort and versatility, while the newly renovated bathrooms bring modern style and charm—especially the master bathroom, which stands out with its unique character and design. Whether you’re looking for a peaceful full-time residence, a weekend retreat, or a smart investment near Lake Palestine, this charming home is one you won’t want to miss.
-
2025-07-06price $129,900
-
2025-02-03$125,000 Active
-
2024-11-04$139,000 Active
-
2022-12-07soldstatus
-
2005-12-12soldstatus
ⓘ Source: listings_history table (triggers on properties + properties_extension) + one-shot
backfill from property_details.listing_events for pre-trigger history.
Tax reassessment forecast TX · Resets to sale price
- Current annual tax
- $707 · $59/mo
- Projected year-2 tax
- $2,114 · $176/mo
- Expected delta
- +$1,407/yr (+$117/mo · 198.9%)
ⓘ Screening estimate from a state-policy table — verify with the county assessor before closing.
Climate risk First Street
- Flood 1/10 Low FEMA zone X (unshaded) · 0% chance over 30 yrs
- Wildfire 4/10 Moderate
- Heat 7/10 Severe 7 d/yr ≥109°F today · 26 d/yr by 30 yrs out
- Wind 6/10 Major 77% chance of damaging wind over 30 yrs
- Air quality 1/10 Low 0 unhealthy d/yr today · 0 by 30 yrs out
Nearby sold comps map
Loading sold comps map…
Walkable amenities ~0.75 mi
Loading nearby amenities…
Taxation est. · year 1
- Rental income
- $18,000
- − Mortgage interest
- −$6,470
- − Property taxes
- −$707
- − Insurance
- −$578
- − Repairs & maintenance
- −$1,440
- − Management
- −$1,440
- − Depreciation
- −$3,360
- Taxable income
- $4,006
- Est. tax owed @ 24.0%
- −$961
- After-tax cash flow
- $4,706/yr
For passive investors: Depreciation is non-cash, so a rental often shows a tax loss while cash-flowing — sheltering income. Rental losses are passive: they offset passive income freely, and up to $25,000/yr can offset ordinary (W-2) income if you actively participate and your MAGI is under $100k (phasing out to $0 by $150k); unused losses carry forward. On sale, claimed depreciation is recaptured at up to 25%, and gains may owe capital-gains tax (a 1031 exchange can defer both). Figures are a year-1 estimate at your 24.0% rate — not tax advice; consult a CPA.
Schools (NCES district)
- District
- Bullard ISD
- NCES district ID
- 4812060
- Math proficiency
- 65% ▼ -2.00%
- Reading proficiency
- 60% ▬ 0.00%
- Median HH income
- $55,026
- Composite
- 53.66/100
- National rank
- #1433
- State rank
- #48 of 826 in TX
Livability — Emerald Bay
- Score
- 71/100
- State rank
- #293
- US rank
- #6721
Category grades
Schools grade is shown separately in the Schools card above.
Census & demographics
- Population (ZIP)
- 13,977
Population outlook (Smith County) Hauer SSP2
- Today (2025)
- 248,890 people
- By 2030
- 261,665 · +5.1%
- By 2040
- 286,114 · +15.0%
- By 2050
- 308,006 · +23.8%
- By 2075
- 354,171 · +42.3%
- By 2100
- 372,828 · +49.8%
Race, ethnicity, and origin ACS 2023
- Neighborhood character
- Predominantly White (80%)
- Race & ethnicity
- White 80% Hispanic / Latino 13% Two or more races 10% Black 2%
- Hispanic origin (detail)
- Mexican 10%
- Common ancestry
- Iranian 5% Italian 4% Slovak 2%
- Foreign-born
- 4% · Canada, Guatemala
- Languages at home
- 92% English-only · Spanish 8%
Political lean MEDSL · Smith
- 2024 margin
- Solid R (+45.1) · D 27.0% · R 72.1%
- 2008→2024 swing
- -5.6pp toward R · 2008: -39.5pp · 2024: -45.1pp
- All cycles
- 2024: R+45.1 2020: R+39.4 2016: R+43.9 2012: R+46.9 2008: R+39.5
Not yet ingested
- Civics
- —
Market trends
- HPI YoY
- ▼ -58.57%
- Current HPI
- 189.5215
- Rent YoY
- —
- Metro
- —
- State GDP YoY
- ▲ 3.95%
- F500 in state
- 110
Industry mix (Fortune 500 HQ in TX)
| Industry | F500 HQs | Revenue |
|---|---|---|
| Energy | 16 | $1,198B |
|
||
| Technology | 5 | $198B |
|
||
| Engineering / Construction | 4 | $72B |
|
||
| Energy Services | 3 | $60B |
|
||
| Utilities | 3 | $41B |
|
||
| Healthcare | 2 | $330B |
|
||
Price history
-16.9% since first listed6 events — show timeline
- 2026-04-14 Listed $115,500 GTAR
- 2025-07-06 Price Changed $129,900 GTAR
- 2025-02-03 Listed $125,000 GTAR
- 2024-11-04 Listed $139,000 GTAR
- 2022-12-07 Sold (Public Records) — Public Records
- 2005-12-12 Sold (Public Records) — Public Records
Property tax history
+5.7%/yrLatest (2024): $707 · +1.0% YoY. Source: county tax records.
Cash-flow waterfall
monthlySold comps — $/sqft
last 12 mo · ≤1 miLoading sold comps…