 Triplex
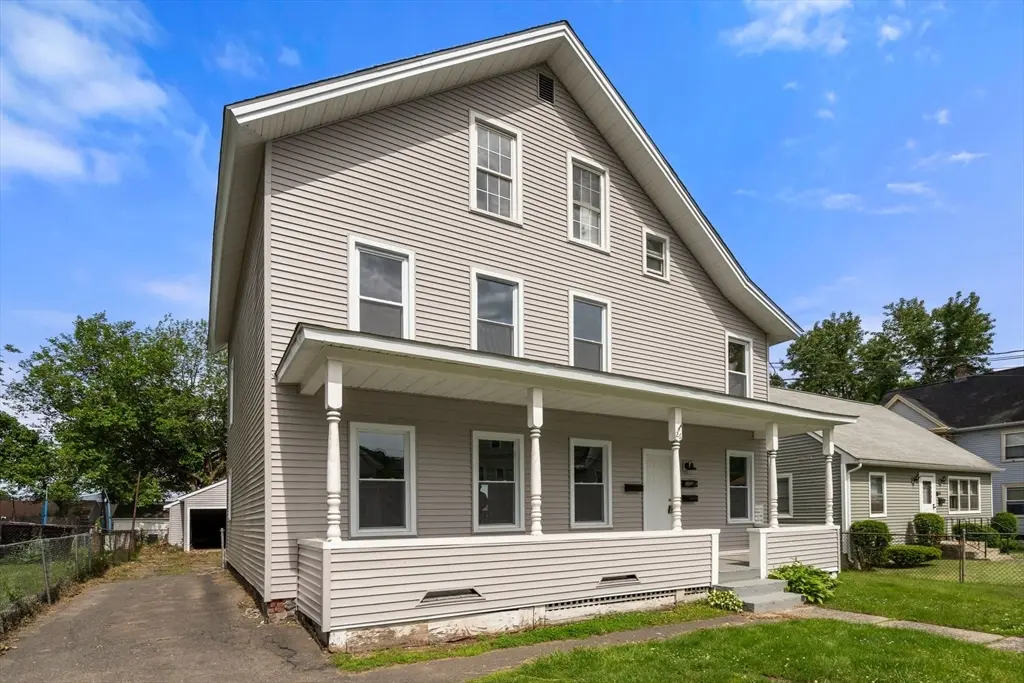
26 Vernon St · Holyoke, MA
Flood risk 1/10 · Minimal
- FEMA flood zone
- X (unshaded)
- Chance of flooding over 30 yrs
- 0.0%
- Est. flood insurance / yr
- $473 – $860
Fire risk 1/10 · Minimal
- Est. fire insurance / yr
- $915 – $1,699
Heat risk 5/10 · Moderate
- Hot days now (above 98°F)
- 7 days/yr
- Hot days in 30 yrs
- 16 days/yr
Wind risk 5/10 · Moderate
- Chance of severe wind over 30 yrs
- 23.0%
Air-quality risk 2/10 · Minimal
- Unhealthy air days now
- 1 days/yr
- Unhealthy air days in 30 yrs
- 1 days/yr
Risk factors via First Street. Map © Google.
Why this score? — see what drove the C+ grade
The composite is a weighted blend of 9 inputs, each scored 0–100. Each bar is that input's sub-score; the figure is the points it added to the 100-point composite (weight × sub-score).
- Cash flow +30.0/30.0
- DSCR +10.0/10.0
- 1% rule +9.9/10.0
- ARV discount +5.9/15.0
- Livability +3.1/5.0
- Rent growth +2.5/5.0
- Condition / age +2.5/5.0
- Schools +0.8/10.0
- Appreciation +0.0/10.0
$449,900
🖨 Deal sheet 📄 Offer letter ✓ Due diligence
Multi-family units
County records classify this as Multi-Family (2-4 Unit). Listing-text estimate: 3 units. confirmed
Listing remarks MLS
HUD PROPERTIES SUBJECT TO PRIOR SALE, WTHDWL OR CANCELLATION & SOLD AS IS. INFO & BIDS WWW.CITIWESTINC.COM & WEB SITES SUPERCEEDS LISTING. HUD, CITIWEST AND BROKERS ASSUME NO FAUL FOR ERRORS. HUDS RIGHT TO ACCEPT OR REJECT ANY AND ALL BIDS
Key facts
- Covered front porch
- Basement access
- Spacious yard
Tags
Property features AI
Finance
- HOA & community: Not a senior community
Exterior
- Parking: Attached garage (1 car); 1 covered parking space; 4 off-street open parking spaces; Total 5 parking spaces
- Utilities: Public water; Public sewer; Electric individually metered
- Home design: 3-family property; 3 stories; Grey exterior
- Construction: Frame construction; Brick/mortar foundation; Shingle roof; Built (year per public records)
- Exterior features: Porch; Wood deck; Level lot; Public road frontage
Interior
- Kitchen: Range; Refrigerator
- Flooring: Vinyl flooring
- Bathrooms: 3 full bathrooms
- Heating & cooling: Natural gas heating; Electric heating
- Interior features: Pantry; Full bathroom with tub and shower; Remodeled areas; Sliding door; Living room; Kitchen; Laundry room; Office/Den; Total of 14 rooms
- Laundry & utility: Laundry room; Individually metered electric
Neighborhood map
What this means for you Summary
Snapshot
- This is a 3 × 5-bed/3.0-bath units multifamily listed at $450k.
Deal economics
- At list price, monthly cash flow is $3k ($30k/yr) — positive. Per door: $837/mo.
- The deal already cash-flows at list — no discount required.
- Meets the 1% rule at list price ($7k rent vs $450k).
- Cap rate 13.0% vs local median 5.3% in Holyoke — top-decile yield for the area; either an underpriced asset or a hidden risk that comps aren't pricing in. Stress-test before assuming the spread holds.
Location & tenants
- Location reads 62/100 on livability (#203 in MA) — a middle-class / working-renter tenant base. Strengths: commute A+, health & safety A+, housing B; Watch: schools F, crime F, amenities F.
- Holyoke (suburban): math 5% / reading 14% proficiency, ranked #302 of 302 in MA (top 100%) — low school quality limits family demand, transient renter base, plan for 1-2y turnover; 82% free/reduced lunch — lower-income household profile, screen leases tightly.
- Market conditions: 43 active listings in the ZIP; 453 units permitted in Hampden County in 2024 (116 in 5+ unit buildings).
- At $6,714/mo this rent would consume 150% of the median local household income ($54k/yr) (locally 2404% of renters already pay >50% of income on rent) — very limited rent-growth headroom before tenants either downsize or default.
Forward outlook
- Local home prices are declining (-3.0%/yr); year-one equity from $3k of loan paydown is wiped out by about $13k of value loss. Plan a longer hold.
- Hampden County population projected at +5% by 2050 — modest demand growth; plan on rents tracking national, not racing it.
- At projected returns (-3.0% appreciation + 3.0% rent growth), your $126k cash investment doubles in ~6 years — after that, you're playing with house money.
Negotiation context
- Only 13 days on market — expect competitive offers; lowballing is unlikely to land.
- 2 sale attempts since 26y ago with the ask held roughly flat each time — persistent listings suggest the price (not the market) is what's stuck; bring a comps-based counter.
- Current owner paid $64k; list at $450k implies a 604% gain — meaningful room to come down on a strong offer.
Risks & watch-outs
- Watch-outs: built in 1890 — expect roof / HVAC / electrical / plumbing capex.
- Climate carrying-cost: moderate wind risk, 23% chance of damaging wind over 30y; extreme-heat days projected 7→16/yr by 2055 (HVAC capex compounding) — expect insurance premiums to compound above CPI over the hold.
Questions for the listing agent
- Can we see the unit-by-unit rent roll, current vacancy, and any below-market leases? What's the average tenancy length?
- What capital expenditures (roof, boiler, parking lot, exteriors) have been made in the last 5 years, and what's planned in the next 2?
- Built in 1890 — when were the roof, HVAC, electrical panel, plumbing, and water heater last replaced?
- Is there a deadline driving the sale (1031 exchange, divorce, estate, relocation)? That informs how much negotiation room exists.
- Schools are F-rated, which usually means shorter tenancies and higher turnover. Who's the typical renter profile here, and what's been the actual vacancy rate?
- Crime grade is F in this area — have there been break-ins, vandalism, or insurance claims at this property in the last 3 years? What carrier currently insures it and at what premium?
- What's the average days-on-market for RENTAL listings here right now (not sales)? A rising rental-DOM trend means longer vacancies and softer asking-rent achievability than the comps imply.
- What's the recent tenant-quality profile in this submarket — average credit score on applications, eviction rate, late-payment / NSF rate, and stable-employment percentage? A property-management company in the area should have these aggregated.
- How much new apartment / multifamily construction is in the pipeline within 1–3 miles? Heavy new supply (>2% of stock underway) typically softens rents 12–24 months out; light construction supports rent growth.
Investment metrics
- 1% rule
- 1.49% ✓
- Cap rate
- 12.99%
- Cash-on-cash
- 23.93%
- DSCR
- 2.06
- GRM
- 5.6
CMA / ARV
- ARV (on-the-fly)
- $434,560
- Comps found
- 2
Show comp detail 2 sales within ~0.75 mi
| Address | Dist | Beds/Ba | Sqft | Sold | Price | $/sf | Match |
|---|---|---|---|---|---|---|---|
| 20-22 Clark St | 0.50mi | 6/3.0 (+1) | 3,132 (+1%) | 17mo | $440,000 | $140 | 56 |
| 223 Skeele St | 0.58mi | 6/3.0 (+1) | 3,354 (+8%) | 18mo | $385,000 | $115 | 39 |
Match score weights: distance 35% · size 25% · config 20% · recency 20%. Top-matched comps best support the ARV.
Projected returns pro-forma
-3.0% appreciation · 3.0% rent growth · sell at horizon
- IRR
- 17.1%
- Equity multiple
- 1.69×
- Total profit
- $87,022
- Equity at exit
- $67,082
- IRR
- 25.6%
- Equity multiple
- 3.23×
- Total profit
- $281,446
- Equity at exit
- $38,899
Cash invested: $125,972 (down + closing). Projections, not guarantees.
Landlord ↔ Tenant lean methodology
- Overall (STATE)
- 20 Strongly Tenant-Friendly
- State Massachusetts
- 20 Strongly Tenant-Friendly · D+15
- County
- — inherits STATE
- City
- — inherits STATE
ZIP-level market 01040
- Home prices YoY
- -33.2%
- Active inventory
- 43
- Price-to-rent
- 16.8×
Monthly cashflow live
- Estimated rent
- $6,714 medium interval (Pro) →
- Mortgage (P&I)
- −$2,359
- Tax from tax record
- −$245 /mo · $2,938/yr
- Insurance
- −$187
- HOA
- −$0
- Vacancy / Maint / Mgmt
- −$1,410
- Net cashflow
- $2,512
Break-even live
3-unit breakdown (identical units grouped — click to expand)
| Units | Beds | Baths | Est. rent |
|---|---|---|---|
| 3× units | 5 | 3 | $6,714 |
| #1 | 5 | 3 | $2,238 |
| #2 | 5 | 3 | $2,238 |
| #3 | 5 | 3 | $2,238 |
| Total (3 units) | $6,714 | ||
UW: 25.0% down · 7.5% · 30yr · 1.5% tax · 5.0% vac · 8.0% maint · 8.0% mgmt
Financing live
Cash to close
- Down payment
- $112,475
- Closing costs
- $13,497
- Reserves months
- —
- Total cash needed
- —
Loan-product check · same deal, 3 products live
Conventional
25% down · 7.5% · 30yr
- Down + closing
- —
- Monthly P&I
- —
- Monthly cashflow
- —
- DSCR
- —
- Eligible?
- —
Personal DTI + credit; lowest rate.
DSCR
20% down · 8.5% · 30yr
- Down + closing
- —
- Monthly P&I
- —
- Monthly cashflow
- —
- DSCR
- —
- Eligible?
- —
No personal income docs; deal must DSCR.
Hard money
10% down · 12.0% · 12mo
- Down + closing
- —
- Monthly P&I
- —
- Monthly cashflow
- —
- DSCR
- —
- Eligible?
- —
Short-term bridge; refi at stabilization.
Listing history 10 events
-
2026-06-18days on market $449,900 Active 13 DOM
-
2026-06-17days on market $449,900 Active 12 DOM
-
2026-06-16days on market $449,900 Active 11 DOM
-
2026-06-15days on market $449,900 Active 10 DOM
-
2026-06-14days on market $449,900 Active 8 DOM
-
2026-06-10days on market $449,900 Active 5 DOM
-
2026-06-09statusdays on market $449,900 Active 4 DOM
-
2026-06-08days on market $449,900 New 3 DOM
-
2026-06-07remarks 693-char remark
-
2026-06-07$449,900 New 2 DOM
ⓘ Source: listings_history table (triggers on properties + properties_extension) + one-shot
backfill from property_details.listing_events for pre-trigger history.
Tax reassessment forecast MA · Partial reset (capped growth)
- Current annual tax
- $2,938 · $245/mo
- Projected year-2 tax
- $4,236 · $353/mo
- Expected delta
- +$1,298/yr (+$108/mo · 44.2%)
ⓘ Screening estimate from a state-policy table — verify with the county assessor before closing.
Climate risk First Street
- Flood 1/10 Low FEMA zone X (unshaded) · 0% chance over 30 yrs
- Wildfire 1/10 Low
- Heat 5/10 Major 7 d/yr ≥98°F today · 16 d/yr by 30 yrs out
- Wind 5/10 Major 23% chance of damaging wind over 30 yrs
- Air quality 2/10 Low 1 unhealthy d/yr today · 1 by 30 yrs out
Nearby sold comps map
Loading sold comps map…
Walkable amenities ~0.75 mi
Loading nearby amenities…
Taxation est. · year 1
- Rental income
- $80,568
- − Mortgage interest
- −$25,201
- − Property taxes
- −$2,938
- − Insurance
- −$2,250
- − Repairs & maintenance
- −$6,445
- − Management
- −$6,445
- − Depreciation
- −$13,088
- Taxable income
- $24,200
- Est. tax owed @ 24.0%
- −$5,808
- After-tax cash flow
- $24,341/yr
For passive investors: Depreciation is non-cash, so a rental often shows a tax loss while cash-flowing — sheltering income. Rental losses are passive: they offset passive income freely, and up to $25,000/yr can offset ordinary (W-2) income if you actively participate and your MAGI is under $100k (phasing out to $0 by $150k); unused losses carry forward. On sale, claimed depreciation is recaptured at up to 25%, and gains may owe capital-gains tax (a 1031 exchange can defer both). Figures are a year-1 estimate at your 24.0% rate — not tax advice; consult a CPA.
Schools (NCES district)
- District
- Holyoke
- NCES district ID
- 2506270
- Math proficiency
- 5% ▼ -7.00%
- Reading proficiency
- 14% ▼ -5.00%
- Median HH income
- $35,495
- Composite
- 7.79/100
- National rank
- #9934
- State rank
- #302 of 302 in MA
Livability — Holyoke
- Score
- 62/100
- State rank
- #203
- US rank
- #16308
Category grades
Schools grade is shown separately in the Schools card above.
Census & demographics
- Census place
- Holyoke, MA
- County
- Hampden County · 230,965 people
- City population
- 37,813
- Metro
- Springfield, MA
- Population (ZIP)
- 37,813
- Household income
- $53,605
- Rent vs Own
- Severe rent burden
- 2404.0
Population outlook (Hampden County) Hauer SSP2
- Today (2025)
- 485,646 people
- By 2030
- 491,517 · +1.2%
- By 2040
- 500,539 · +3.1%
- By 2050
- 508,827 · +4.8%
- By 2075
- 539,167 · +11.0%
- By 2100
- 545,698 · +12.4%
Race, ethnicity, and origin ACS 2023
- Neighborhood character
- Majority Hispanic (52%)
- Race & ethnicity
- Hispanic / Latino 52% White 43% Two or more races 23% Black 2%
- Hispanic origin (detail)
- Puerto Rican 45% Dominican 2%
- Common ancestry
- Lithuanian 5% Romanian 4% Slovak 1%
- Foreign-born
- 6% · Canada, Jamaica
- Languages at home
- 58% English-only · Spanish 39% Russian/Polish/Slavic 1% French/Haitian/Cajun 1%
Political lean MEDSL · Hampden
- 2024 margin
- Lean D (+8.9) · D 53.4% · R 44.5% · Other 2.1%
- 2008→2024 swing
- -16.4pp toward R · 2008: 25.3pp · 2024: 8.9pp
- All cycles
- 2024: D+8.9 2020: D+17.7 2016: D+16.0 2012: D+25.4 2008: D+25.3
Not yet ingested
- Civics
- —
Market trends
- HPI YoY
- ▼ -146.03%
- Current HPI
- 293.93
- Rent YoY
- —
- Metro
- Springfield, MA
- State GDP YoY
- ▲ 2.28%
- F500 in state
- 38
Industry mix (Fortune 500 HQ in MA)
| Industry | F500 HQs | Revenue |
|---|---|---|
| Technology | 3 | $17B |
|
||
| Insurance | 2 | $84B |
|
||
| Retail | 2 | $76B |
|
||
| Life Sciences | 1 | $43B |
|
||
| Energy Technology | 1 | $31B |
|
||
| Aerospace / Defense | 1 | $18B |
|
||
Price history
+254.3% since first listed6 events — show timeline
- 2026-06-05 Listed $449,900 MLS PIN
- 2000-04-09 Sold (MLS) $63,900 MLS PIN
- 2000-03-31 Sold (Public Records) $63,900 Public Records
- 2000-02-04 Listed $66,500 MLS PIN
- 1992-04-16 Sold (Public Records) $118,000 Public Records
- 1988-07-28 Sold (Public Records) $127,000 Public Records
Property tax history
+3.8%/yrLatest (2023): $2,938 · -0.7% YoY. Source: county tax records.
Cash-flow waterfall
monthlySold comps — $/sqft
last 12 mo · ≤1 miLoading sold comps…