3600 Corbett St · Charlotte, NC
Flood risk 1/10 · Minimal
- FEMA flood zone
- X (unshaded)
- Chance of flooding over 30 yrs
- 0.0%
- Est. flood insurance / yr
- $507 – $1,088
Fire risk 1/10 · Minimal
- Est. fire insurance / yr
- $906 – $1,684
Heat risk 6/10 · Moderate
- Hot days now (above 103°F)
- 7 days/yr
- Hot days in 30 yrs
- 17 days/yr
Wind risk 6/10 · Moderate
- Chance of severe wind over 30 yrs
- 27.0%
Air-quality risk 3/10 · Minor
- Unhealthy air days now
- 3 days/yr
- Unhealthy air days in 30 yrs
- 4 days/yr
Risk factors via First Street. Map © Google.
Why this score? — see what drove the B grade
The composite is a weighted blend of 9 inputs, each scored 0–100. Each bar is that input's sub-score; the figure is the points it added to the 100-point composite (weight × sub-score).
- Cash flow +30.0/30.0
- 1% rule +10.0/10.0
- DSCR +10.0/10.0
- ARV discount +7.5/15.0
- Livability +3.9/5.0
- Schools +3.8/10.0
- Rent growth +2.9/5.0
- Condition / age +2.5/5.0
- Appreciation +0.0/10.0
$97,800
🖨 Deal sheet 📄 Offer letter ✓ Due diligence
Listing remarks
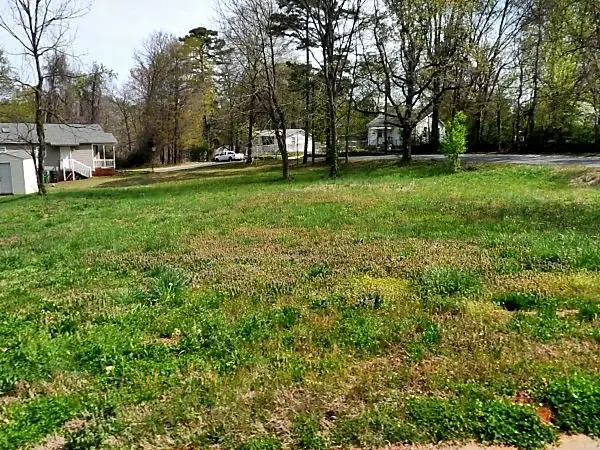
Prime vacant lot opportunity in growing West Charlotte. Located at 3600 Corbett St, Charlotte, NC 28208, this property offers strong potential for new construction or investment. Convenient access to Wilkinson Blvd, Uptown Charlotte, I-85, and Charlotte Douglas Airport. Surrounded by ongoing redevelopment and newer homes, this lot is ideal for builders, investors, or buyers looking to build in an appreciating area. Utilities available nearby. Quiet residential street with easy access to shopping, dining, and major highways. Great opportunity to secure land in one of Charlotte & acirc; & euro; & trade; s rapidly developing corridors
Key facts
- Built 1938
- Listed 17 days
Tags
Property features AI
Exterior
- Home design: Built in 1938
- Construction: Original construction from 1938
- Exterior features: Located in the Westerly Hills subdivision
Neighborhood map
What this means for you Summary
Snapshot
- This is a 3-bed/?-bath single-family listed at $98k.
Deal economics
- At list price, monthly cash flow is $753 ($9k/yr) — positive.
- The deal already cash-flows at list — no discount required.
- Meets the 1% rule at list price ($2k rent vs $98k).
- Recommended offer: $96k (1.5% below list) — sets the bar for market timing.
- Cap rate 15.5% vs local median 3.1% in Charlotte — top-decile yield for the area; either an underpriced asset or a hidden risk that comps aren't pricing in. Stress-test before assuming the spread holds.
Location & tenants
- Location reads 78/100 on livability (#26 in NC, #2,502 nationally) — a middle-class / working-renter tenant base. Strengths: amenities A+, commute A+, housing A+; Watch: schools D+, crime F.
- Charlotte-Mecklenburg Schools (urban): math 42% / reading 46% proficiency, ranked #85 of 178 in NC (top 48%) — families likely to look elsewhere, expect single-tenant / working-renter base with shorter leases.
- Market conditions: Rents rising (+1.5%/yr); 349 active listings in the ZIP; 40 comparable units currently listed for rent nearby; rentals at typical pace (median 16d on market — plan ~3-4 weeks tenant-placement turnaround); 11,969 units permitted in Mecklenburg County in 2024 (5,377 in 5+ unit buildings).
- This rent runs 38% of the median local income ($55k/yr) — at the standard rent-burdened threshold; future hikes will face affordability resistance.
Forward outlook
- Local home prices are declining (-3.0%/yr); year-one equity from $676 of loan paydown is wiped out by about $3k of value loss. Plan a longer hold.
- Mecklenburg County population projected at +53% by 2050 — long-run rental-demand tailwind backs the buy-and-hold thesis.
- At projected returns (-3.0% appreciation + 1.5% rent growth), your $27k cash investment doubles in ~4 years — after that, you're playing with house money.
Negotiation context
- It's been on market 17 days — a 2% lower offer ($96k) is reasonable based on typical stale-listing flexibility.
- Current owner paid $26k; list at $98k implies a 276% gain — meaningful room to come down on a strong offer.
Risks & watch-outs
- Watch-outs: built in 1938 — expect roof / HVAC / electrical / plumbing capex.
- Climate carrying-cost: major wind risk, 27% chance of damaging wind over 30y; extreme-heat days projected 7→17/yr by 2055 (HVAC capex compounding) — expect insurance premiums to compound above CPI over the hold.
Questions for the listing agent
- Built in 1938 — when were the roof, HVAC, electrical panel, plumbing, and water heater last replaced?
- Is there a deadline driving the sale (1031 exchange, divorce, estate, relocation)? That informs how much negotiation room exists.
- Schools are D-rated, which usually means shorter tenancies and higher turnover. Who's the typical renter profile here, and what's been the actual vacancy rate?
- Crime grade is F in this area — have there been break-ins, vandalism, or insurance claims at this property in the last 3 years? What carrier currently insures it and at what premium?
- What's the average days-on-market for RENTAL listings here right now (not sales)? A rising rental-DOM trend means longer vacancies and softer asking-rent achievability than the comps imply.
- What's the recent tenant-quality profile in this submarket — average credit score on applications, eviction rate, late-payment / NSF rate, and stable-employment percentage? A property-management company in the area should have these aggregated.
- How much new for-sale + rental construction is in the pipeline within 1–3 miles? Heavy new supply typically softens prices + rents 12–24 months out; constrained supply supports both.
Investment metrics
- 1% rule
- 1.77% ✓
- Cap rate
- 15.54%
- Cash-on-cash
- 33.01%
- DSCR
- 2.47
- GRM
- 4.7
CMA / ARV
- ARV (on-the-fly)
- $305,254
- Comps found
- 12
Show comp detail 12 sales within ~0.75 mi
| Address | Dist | Beds/Ba | Sqft | Sold | Price | $/sf | Match |
|---|---|---|---|---|---|---|---|
| 3615 Kempton Pl | 0.15mi | 3/1.0 | 1,140 (+3%) | 9mo | $345,000 | $303 | 80 |
| 2243 Ashley Rd | 0.33mi | 3/1.0 | 1,148 (+4%) | 6mo | $330,000 | $287 | 73 |
| 4021 Paisley Pl | 0.28mi | 3/1.0 | 1,183 (+7%) | 12mo | $339,000 | $287 | 64 |
| 3512 Carlyle Dr | 0.26mi | 3/1.0 | 975 (-12%) | 12mo | $300,000 | $308 | 59 |
| 2409 Thornton Rd | 0.41mi | 4/1.0 (+1) | 1,169 (+6%) | 11mo | $197,000 | $169 | 57 |
| 2701 Sonora Ln | 0.46mi | 3/1.0 | 950 (-14%) | 2mo | $235,000 | $247 | 54 |
| 2416 Carrington Ct | 0.63mi | 2/1.0 (-1) | 1,055 (-4%) | 8mo | $190,000 | $180 | 52 |
| 2501 Thornton Rd | 0.42mi | 3/1.0 | 950 (-14%) | 8mo | $260,000 | $274 | 50 |
| 2410 Carrington Ct | 0.63mi | 3/2.0 | 985 (-11%) | 4mo | $255,000 | $259 | 50 |
| 2600 Alleghany St | 0.57mi | 3/2.0 | 1,002 (-9%) | 11mo | $335,500 | $335 | 49 |
| 2812 Alleghany St | 0.63mi | 3/1.0 | 992 (-10%) | 7mo | $275,000 | $277 | 48 |
| 4408 Pebblebrook Dr | 0.65mi | 3/1.0 | 952 (-14%) | 14mo | $205,000 | $215 | 35 |
Match score weights: distance 35% · size 25% · config 20% · recency 20%. Top-matched comps best support the ARV.
Projected returns pro-forma
-3.0% appreciation · 1.47% rent growth · sell at horizon
- IRR
- 26.5%
- Equity multiple
- 2.08×
- Total profit
- $29,489
- Equity at exit
- $14,582
- IRR
- 33.2%
- Equity multiple
- 3.81×
- Total profit
- $76,952
- Equity at exit
- $8,456
Cash invested: $27,384 (down + closing). Projections, not guarantees.
Landlord ↔ Tenant lean methodology
- Overall (STATE)
- 85 Strongly Landlord-Friendly
- State North Carolina
- 85 Strongly Landlord-Friendly · R+3
- County
- — inherits STATE
- City
- — inherits STATE
ZIP-level market 28208
- Home prices YoY
- -33.4%
- Rents YoY
- 1.5%
- Active inventory
- 349
- Price-to-rent
- 4.7×
Monthly cashflow live
- Estimated rent
- $1,733 high interval (Pro) →
- Mortgage (P&I)
- −$513
- Tax from tax record
- −$62 /mo · $750/yr
- Insurance
- −$41
- HOA
- −$0
- Vacancy / Maint / Mgmt
- −$364
- Net cashflow
- $753
Break-even live
UW: 25.0% down · 7.5% · 30yr · 1.5% tax · 5.0% vac · 8.0% maint · 8.0% mgmt
Financing live
Cash to close
- Down payment
- $24,450
- Closing costs
- $2,934
- Reserves months
- —
- Total cash needed
- —
Loan-product check · same deal, 3 products live
Conventional
25% down · 7.5% · 30yr
- Down + closing
- —
- Monthly P&I
- —
- Monthly cashflow
- —
- DSCR
- —
- Eligible?
- —
Personal DTI + credit; lowest rate.
DSCR
20% down · 8.5% · 30yr
- Down + closing
- —
- Monthly P&I
- —
- Monthly cashflow
- —
- DSCR
- —
- Eligible?
- —
No personal income docs; deal must DSCR.
Hard money
10% down · 12.0% · 12mo
- Down + closing
- —
- Monthly P&I
- —
- Monthly cashflow
- —
- DSCR
- —
- Eligible?
- —
Short-term bridge; refi at stabilization.
Rent comps 40 comps
| Address | Beds | Baths | Sqft | Rent | $/sqft | DOM | Units | Dist |
|---|---|---|---|---|---|---|---|---|
| 2315 Deherradora Ave Charlotte, NC | 4.0 | 2.0 | 1015 | $2,100 | $2.07 | 23d | 1 | 0.16mi |
| 3500 Blessing St Charlotte, NC | 2.0 | 2.0 | 1042 | $1,050 | $1.01 | 7d | 1 | 0.23mi |
| 1910 Bromwich Rd Unit A Charlotte, NC | 3.0 | 2.0 | 1268 | $1,950 | $1.54 | 16d | 1 | 0.36mi |
| 2515 Thornton Rd Charlotte, NC | 2.0 | 2.0 | 935 | $1,795 | $1.92 | 17d | 1 | 0.40mi |
| 2715 Sonora Ln Charlotte, NC | 3.0 | 1.0 | 950 | $1,900 | $2.00 | 23d | 1 | 0.42mi |
| 2607 Thornton Rd Charlotte, NC | 3.0 | 1.0 | 950 | $1,300 | $1.37 | 2d | 1 | 0.43mi |
| 3201 Dublin Rd Charlotte, NC | 2.0 | 1.0 | 1050 | $1,600 | $1.52 | 23d | 1 | 0.44mi |
| 2322 Belfast Dr Charlotte, NC | 3.0 | 1.0 | 1260 | $1,375 | $1.09 | 7d | 1 | 0.46mi |
| 2620 Thornton Rd Charlotte, NC | 3.0 | 1.0 | 989 | $1,595 | $1.61 | 4d | 1 | 0.47mi |
| 1901 Ashley Rd Charlotte, NC | 2.0 | 1.0 | 750 | $1,330 | $1.77 | 7d | 1 | 0.52mi |
| 4201 Carlyle Dr Charlotte, NC | 3.0 | 1.0 | 1080 | $1,310 | $1.21 | 23d | 1 | 0.52mi |
| 3251 Dannelly Towns Aly Charlotte, NC | 3.0 | 3.5 | 1500 | $2,150 | $1.43 | 7d | 1 | 0.57mi |
| 5025 Taggart Springs Way Charlotte, NC | 1.0–3.0 | 1.0–2.0 | 1087 | $1,593 | $1.46 | 2d | 22 | 0.61mi |
| 5025 Taggart Springs Way Charlotte, NC | 1.0–3.0 | 1.0–2.0 | 1087 | $1,593 | $1.46 | 23d | 1 | 0.61mi |
| 3017 Minnesota Rd Charlotte, NC | 2.0 | 1.0 | 725 | $1,100 | $1.52 | 23d | 1 | 0.65mi |
| 2811 Marlowe Ave Charlotte, NC | 1.0–3.0 | 1.0 | 820 | $1,525 | $1.86 | 1d | 23 | 0.71mi |
| 2019 Highland St Charlotte, NC | 3.0 | 2.0 | 1100 | $2,100 | $1.91 | 7d | 1 | 0.82mi |
| 2425 Kingspark Dr Charlotte, NC | 2.0 | 1.0 | 757 | $1,099 | $1.45 | 23d | 6 | 0.92mi |
| 2143 Camp Greene St Charlotte, NC | 2.0 | 1.0 | 1020 | $1,800 | $1.76 | 23d | 1 | 0.93mi |
| 3021 Seymour Dr Charlotte, NC | 4.0 | 2.0 | 1280 | $1,685 | $1.32 | 16d | 1 | 0.95mi |
| 1936 Garibaldi Ave Charlotte, NC | 2.0 | 1.0 | 884 | $1,690 | $1.91 | 11d | 1 | 0.96mi |
| 2429 Marlowe Ave Charlotte, NC | 3.0 | 2.0 | 1384 | $2,100 | $1.52 | 23d | 1 | 1.04mi |
| 4915 Magnasco Ln Charlotte, NC | 3.0 | 2.0 | 1440 | $1,789 | $1.24 | 16d | 1 | 1.10mi |
| 2721 Columbus Cir Charlotte, NC | 2.0 | 1.0 | 750 | $1,125 | $1.50 | 23d | 1 | 1.11mi |
| 2717 Columbus Cir Charlotte, NC | 2.0 | 1.0 | 750 | $1,095 | $1.46 | 23d | 1 | 1.11mi |
| 2429 Remount Rd Charlotte, NC | 3.0 | 2.0 | 1500 | $2,350 | $1.57 | 23d | 1 | 1.11mi |
| 1601 Dewberry Ter Charlotte, NC | 3.0–4.0 | 1.0–1.5 | 1100 | $1,349 | $1.23 | 3d | 11 | 1.17mi |
| 2805 McCombs St Charlotte, NC | 2.0 | 1.0 | 884 | $1,700 | $1.92 | 17d | 1 | 1.18mi |
| 2220 Berryhill Rd Charlotte, NC | 2.0 | 1.0–2.0 | 825 | $2,365 | $2.86 | 2d | 82 | 1.18mi |
| 2405 Greenland Ave Charlotte, NC | 3.0 | 1.0 | 1203 | $1,800 | $1.50 | 4d | 1 | 1.20mi |
| 2930 Tacoma St Charlotte, NC | 1.0–3.0 | 1.0–2.0 | 997 | $1,625 | $1.63 | 23d | 1 | 1.21mi |
| 2423 Shad Ct Charlotte, NC | 4.0 | 2.0 | 1488 | $1,919 | $1.29 | 2d | 1 | 1.22mi |
| 1831 J Julian Ln Charlotte, NC | 2.0 | 2.0 | 968 | $1,575 | $1.63 | 4d | 1 | 1.23mi |
| 2314 Berryhill Rd Charlotte, NC | 2.0 | 1.0–2.5 | 989 | $2,474 | $2.50 | 1d | 20 | 1.23mi |
| 1840 J Julian Ln Unit A Charlotte, NC | 2.0 | 2.0 | 968 | $1,425 | $1.47 | 16d | 1 | 1.26mi |
| 3216 Credenza Rd Charlotte, NC | 4.0 | 2.0 | 1343 | $1,900 | $1.41 | 4d | 1 | 1.27mi |
| 1832 J Julian Ln Unit D Charlotte, NC | 2.0 | 2.0 | 972 | $1,299 | $1.34 | 14d | 1 | 1.28mi |
| 1416 Effingham Rd Charlotte, NC | 2.0 | 1.0 | 945 | $1,595 | $1.69 | 16d | 1 | 1.28mi |
| 4929 Arborwood Dr Charlotte, NC | 1.0–2.0 | 1.0–1.5 | 916 | $1,388 | $1.52 | 1d | 21 | 1.30mi |
| 1701 West Blvd Unit V3 Charlotte, NC | 2.0 | 1.5 | 765 | $1,323 | $1.73 | 23d | 1 | 1.31mi |
Listing history 10 events
-
2026-06-16days on market $97,800 Active 17 DOM
-
2026-06-15days on market $97,800 Active 16 DOM
-
2026-06-13days on market $97,800 Active 14 DOM
-
2026-06-10days on market $97,800 Active 10 DOM
-
2026-06-07days on market $97,800 Active 8 DOM
-
2026-06-04days on market $97,800 Active 5 DOM
-
2026-06-03days on market $97,800 Active 4 DOM
-
2026-06-02days on market $97,800 Active 3 DOM
-
2026-06-02days on market $97,800 Active 2 DOM
-
2026-05-31$97,800 Active 1 DOM
ⓘ Source: listings_history table (triggers on properties + properties_extension) + one-shot
backfill from property_details.listing_events for pre-trigger history.
Tax reassessment forecast NC · Resets to sale price
- Current annual tax
- $750 · $62/mo
- Projected year-2 tax
- $802 · $67/mo
- Expected delta
- +$52/yr (+$4/mo · 6.9%)
ⓘ Screening estimate from a state-policy table — verify with the county assessor before closing.
Climate risk First Street
- Flood 1/10 Low FEMA zone X (unshaded) · 0% chance over 30 yrs
- Wildfire 1/10 Low
- Heat 6/10 Major 7 d/yr ≥103°F today · 17 d/yr by 30 yrs out
- Wind 6/10 Major 27% chance of damaging wind over 30 yrs
- Air quality 3/10 Moderate 3 unhealthy d/yr today · 4 by 30 yrs out
Nearby sold comps map
Loading sold comps map…
Walkable amenities ~0.75 mi
Loading nearby amenities…
Taxation est. · year 1
- Rental income
- $20,801
- − Mortgage interest
- −$5,478
- − Property taxes
- −$750
- − Insurance
- −$489
- − Repairs & maintenance
- −$1,664
- − Management
- −$1,664
- − Depreciation
- −$2,845
- Taxable income
- $7,910
- Est. tax owed @ 24.0%
- −$1,898
- After-tax cash flow
- $7,141/yr
For passive investors: Depreciation is non-cash, so a rental often shows a tax loss while cash-flowing — sheltering income. Rental losses are passive: they offset passive income freely, and up to $25,000/yr can offset ordinary (W-2) income if you actively participate and your MAGI is under $100k (phasing out to $0 by $150k); unused losses carry forward. On sale, claimed depreciation is recaptured at up to 25%, and gains may owe capital-gains tax (a 1031 exchange can defer both). Figures are a year-1 estimate at your 24.0% rate — not tax advice; consult a CPA.
Schools (NCES district)
- District
- Charlotte-Mecklenburg Schools
- NCES district ID
- 3702970
- Math proficiency
- 42% ▼ -6.00%
- Reading proficiency
- 46% ▲ 1.00%
- Median HH income
- $57,175
- Composite
- 38.49/100
- National rank
- #4183
- State rank
- #85 of 178 in NC
Livability — Charlotte
- Score
- 78/100
- State rank
- #26
- US rank
- #2502
Category grades
Schools grade is shown separately in the Schools card above.
Census & demographics
- Census place
- Charlotte, NC
- County
- Mecklenburg County · 1,167,319 people
- City population
- 920,422
- Metro
- Charlotte-Concord-Gastonia, NC-SC
- Population (ZIP)
- 40,197
- Household income
- $55,431
- Rent vs Own
- Severe rent burden
- 2368.0
Population outlook (Mecklenburg County) Hauer SSP2
- Today (2025)
- 1,305,740 people
- By 2030
- 1,442,752 · +10.5%
- By 2040
- 1,722,441 · +31.9%
- By 2050
- 1,999,450 · +53.1%
- By 2075
- 2,642,495 · +102.4%
- By 2100
- 3,106,755 · +137.9%
Race, ethnicity, and origin ACS 2023
- Neighborhood character
- Diverse neighborhood (Simpson 0.57)
- Race & ethnicity
- Black 61% White 16% Hispanic / Latino 14% Two or more races 6% Asian 4%
- Hispanic origin (detail)
- Mexican 5%
- Common ancestry
- Italian 1%
- Foreign-born
- 11% · Canada, Vietnam, China
- Languages at home
- 83% English-only · Spanish 12% Other Asian/Pacific 1% French/Haitian/Cajun 1%
Political lean MEDSL · Mecklenburg
- 2024 margin
- Solid D (+32.9) · D 65.6% · R 32.7% · Other 1.6%
- 2008→2024 swing
- +8.5pp toward D · 2008: 24.4pp · 2024: 32.9pp
- All cycles
- 2024: D+32.9 2020: D+35.1 2016: D+29.9 2012: D+22.5 2008: D+24.4
Not yet ingested
- Civics
- —
Market trends
- HPI YoY
- ▼ -162.76%
- Current HPI
- 324.3642
- Rent YoY
- ▲ 1.47%
- Metro
- Charlotte-Concord-Gastonia, NC-SC
- State GDP YoY
- ▲ 3.28%
- F500 in state
- 26
Industry mix (Fortune 500 HQ in NC)
| Industry | F500 HQs | Revenue |
|---|---|---|
| Financial Services | 2 | $213B |
|
||
| Retail | 2 | $95B |
|
||
| Industrial Conglomerate | 1 | $38B |
|
||
| Metals / Steel | 1 | $35B |
|
||
| Utilities | 1 | $30B |
|
||
| Industrial Machinery | 1 | $19B |
|
||
Price history
+276.2% since first listed2 events — show timeline
- 2026-05-30 Listed $97,800 FSBO.com
- 1992-08-01 Sold (Public Records) $26,000 Public Records
Property tax history
+25.4%/yrLatest (2025): $750 · +1.3% YoY. Source: county tax records.
Cash-flow waterfall
monthlySold comps — $/sqft
last 12 mo · ≤1 miLoading sold comps…