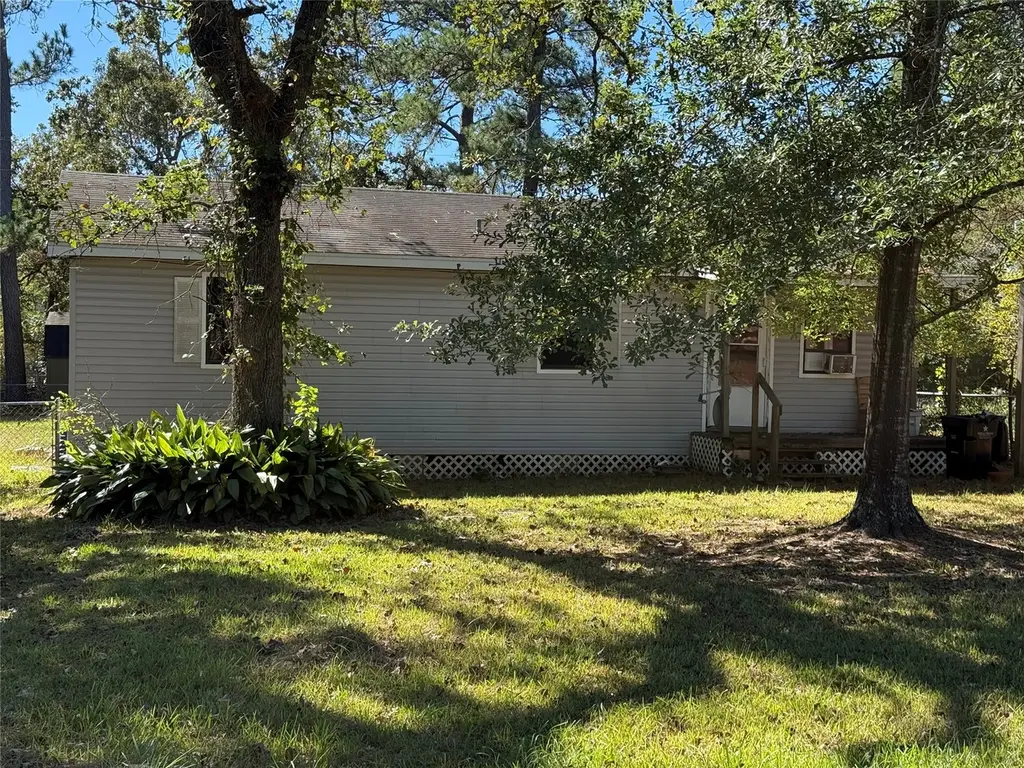
26457 Easy St · Magnolia, TX
Flood risk 1/10 · Minimal
- FEMA flood zone
- X (unshaded)
- Chance of flooding over 30 yrs
- 0.0%
- Est. flood insurance / yr
- $507 – $1,088
Fire risk 5/10 · Moderate
- Est. fire insurance / yr
- $1,222 – $2,270
Heat risk 8/10 · Major
- Hot days now (above 111°F)
- 7 days/yr
- Hot days in 30 yrs
- 23 days/yr
Wind risk 8/10 · Major
- Chance of severe wind over 30 yrs
- 99.0%
Air-quality risk 2/10 · Minimal
- Unhealthy air days now
- 1 days/yr
- Unhealthy air days in 30 yrs
- 1 days/yr
Risk factors via First Street. Map © Google.
Why this score? — see what drove the B- grade
The composite is a weighted blend of 9 inputs, each scored 0–100. Each bar is that input's sub-score; the figure is the points it added to the 100-point composite (weight × sub-score).
- Cash flow +23.6/30.0
- ARV discount +15.0/15.0
- DSCR +7.6/10.0
- 1% rule +6.9/10.0
- Schools +3.9/10.0
- Livability +3.7/5.0
- Rent growth +2.5/5.0
- Condition / age +2.5/5.0
- Appreciation +0.0/10.0
$135,000
🖨 Deal sheet 📄 Offer letter ✓ Due diligence
Listing remarks MLS
GREAT LOCATION! 2-3 BEDROOM HOME READY FOR YOUR TOUCHES! NEEDS SOME UPDATING AND REPAIRS, HAS GOOD BONES! Easy access to main HWYS. Easy commute, 5-10 minutes to restaurants, shopping, doctors, hospital, etc. Great opportunity to own a prime location!
Key facts
- Great location
- Easy commute
- Prime location
Tags
Neighborhood map
What this means for you Summary
Snapshot
- This is a 2-bed/2.0-bath single-family listed at $135k.
Deal economics
- At list price, monthly cash flow is $255 ($3k/yr) — positive.
- The deal already cash-flows at list — no discount required.
- Meets the 1% rule at list price ($2k rent vs $135k).
- Recommended offer: $119k (12.0% below list) — sets the bar for market timing.
- Cap rate 8.6% vs local median 3.4% in Magnolia — top-decile yield for the area; either an underpriced asset or a hidden risk that comps aren't pricing in. Stress-test before assuming the spread holds.
Location & tenants
- Location reads 73/100 on livability (#222 in TX) — a middle-class / working-renter tenant base. Strengths: crime A+, cost of living A+, housing A+; Watch: schools D+, amenities F, commute F.
- Magnolia ISD (rural): math 42% / reading 45% proficiency, ranked #247 of 826 in TX (top 30%) — families likely to look elsewhere, expect single-tenant / working-renter base with shorter leases.
- Market conditions: 553 active listings in the ZIP; 9 comparable units currently listed for rent nearby; rentals at typical pace (median 22d on market — plan ~3-4 weeks tenant-placement turnaround); solid renter incomes; 13,259 units permitted in Montgomery County in 2024 (1,402 in 5+ unit buildings).
Forward outlook
- Local home prices are declining (-3.0%/yr); year-one equity from $933 of loan paydown is wiped out by about $4k of value loss. Plan a longer hold.
- Montgomery County population projected at +65% by 2050 — long-run rental-demand tailwind backs the buy-and-hold thesis.
Negotiation context
- It's been on market 228 days — a 12% lower offer ($119k) is reasonable based on typical stale-listing flexibility.
Risks & watch-outs
- Climate carrying-cost: severe wind risk, 99% chance of damaging wind over 30y; moderate wildfire risk; extreme-heat days projected 7→23/yr by 2055 (HVAC capex compounding) — expect insurance premiums to compound above CPI over the hold.
Questions for the listing agent
- It's been on market 228 days. Have you received any prior offers? Is the seller open to a 12% concession, seller financing, or rate buy-down credit?
- What does the HOA fee cover, when was the last increase, and are there any pending special assessments or reserve-fund shortfalls?
- Why hasn't it sold? Are there any deal-killer items the seller is aware of (foundation, flood, title, zoning, code violations)?
- Is there a deadline driving the sale (1031 exchange, divorce, estate, relocation)? That informs how much negotiation room exists.
- Schools are D-rated, which usually means shorter tenancies and higher turnover. Who's the typical renter profile here, and what's been the actual vacancy rate?
- What's the average days-on-market for RENTAL listings here right now (not sales)? A rising rental-DOM trend means longer vacancies and softer asking-rent achievability than the comps imply.
- What's the recent tenant-quality profile in this submarket — average credit score on applications, eviction rate, late-payment / NSF rate, and stable-employment percentage? A property-management company in the area should have these aggregated.
- How much new for-sale + rental construction is in the pipeline within 1–3 miles? Heavy new supply typically softens prices + rents 12–24 months out; constrained supply supports both.
Investment metrics
- 1% rule
- 1.19% ✓
- Cap rate
- 8.56%
- Cash-on-cash
- 8.10%
- DSCR
- 1.36
- GRM
- 7.0
CMA / ARV
- ARV (median comp)
- $213,492
- List price
- $135,000
- Delta
- -36.77%
- Verdict
- UNDERPRICED
- Comps
- 20 within 1.0 mi
Show comp detail 4 sales within ~0.75 mi
| Address | Dist | Beds/Ba | Sqft | Sold | Price | $/sf | Match |
|---|---|---|---|---|---|---|---|
| 19285 Todd Rd | 0.63mi | 2/1.0 | 980 (-3%) | 12mo | $260,000 | $265 | 52 |
| 26424 Leisure Ln | 0.09mi | 3/1.0 (+1) | 1,152 (+14%) | 23mo | $132,000 | $115 | 44 |
| 23015 Bellini Dr | 0.67mi | 3/2.0 (+1) | 1,152 (+14%) | 0mo | $204,000 | $177 | 40 |
| 27010 Poets Dr | 0.67mi | 3/2.0 (+1) | 1,152 (+14%) | 13mo | $219,900 | $191 | 29 |
Match score weights: distance 35% · size 25% · config 20% · recency 20%. Top-matched comps best support the ARV.
Projected returns pro-forma
-3.0% appreciation · 3.0% rent growth · sell at horizon
- IRR
- -3.9%
- Equity multiple
- 0.85×
- Total profit
- $-5,550
- Equity at exit
- $20,129
- IRR
- 5.8%
- Equity multiple
- 1.43×
- Total profit
- $16,390
- Equity at exit
- $11,672
Cash invested: $37,800 (down + closing). Projections, not guarantees.
Landlord ↔ Tenant lean methodology
- Overall (STATE)
- 87 Strongly Landlord-Friendly
- State Texas
- 87 Strongly Landlord-Friendly · R+5
- County
- — inherits STATE
- City
- — inherits STATE
ZIP-level market 77355
- Home prices YoY
- -30.3%
- Active inventory
- 553
- Price-to-rent
- 7.0×
Monthly cashflow live
- Estimated rent
- $1,604 high interval (Pro) →
- Mortgage (P&I)
- −$708
- Tax from tax record
- −$236 /mo · $2,837/yr
- Insurance
- −$56
- HOA
- −$11
- Vacancy / Maint / Mgmt
- −$337
- Net cashflow
- $255
Break-even live
UW: 25.0% down · 7.5% · 30yr · 1.5% tax · 5.0% vac · 8.0% maint · 8.0% mgmt
Financing live
Cash to close
- Down payment
- $33,750
- Closing costs
- $4,050
- Reserves months
- —
- Total cash needed
- —
Loan-product check · same deal, 3 products live
Conventional
25% down · 7.5% · 30yr
- Down + closing
- —
- Monthly P&I
- —
- Monthly cashflow
- —
- DSCR
- —
- Eligible?
- —
Personal DTI + credit; lowest rate.
DSCR
20% down · 8.5% · 30yr
- Down + closing
- —
- Monthly P&I
- —
- Monthly cashflow
- —
- DSCR
- —
- Eligible?
- —
No personal income docs; deal must DSCR.
Hard money
10% down · 12.0% · 12mo
- Down + closing
- —
- Monthly P&I
- —
- Monthly cashflow
- —
- DSCR
- —
- Eligible?
- —
Short-term bridge; refi at stabilization.
Rent comps 9 comps
| Address | Beds | Baths | Sqft | Rent | $/sqft | DOM | Units | Dist |
|---|---|---|---|---|---|---|---|---|
| 24053 Wilde Dr Magnolia, TX | 3.0 | 2.0 | 1152 | $1,495 | $1.30 | 3d | 1 | 0.66mi |
| 23022 Bellini Dr Magnolia, TX | 3.0 | 2.0 | 1414 | $1,549 | $1.10 | 20d | 1 | 0.70mi |
| 25238 Dickens Dr Magnolia, TX | 3.0 | 2.0 | 1152 | $1,585 | $1.38 | 43d | 1 | 0.74mi |
| 25194 Dickens Dr Magnolia, TX | 3.0 | 2.0 | 1152 | $1,570 | $1.36 | 20d | 1 | 0.75mi |
| 21163 Titian Dr Magnolia, TX | 3.0 | 2.0 | 1366 | $1,540 | $1.13 | 43d | 1 | 0.76mi |
| 27016 Leonardo Dr Magnolia, TX | 3.0 | 2.0 | 1364 | $1,539 | $1.13 | 22d | 1 | 0.80mi |
| 26323 Michelangelo Dr Magnolia, TX | 3.0 | 2.0 | 1152 | $1,480 | $1.28 | 43d | 1 | 0.80mi |
| 27032 Leonardo Dr Magnolia, TX | 3.0 | 2.0 | 1366 | $1,560 | $1.14 | 24d | 1 | 0.81mi |
| 26327 Michelangelo Dr Magnolia, TX | 3.0 | 2.0 | 1366 | $1,580 | $1.16 | 20d | 1 | 0.81mi |
HOA detail
- Monthly dues
- $11 · $132/yr
Listing history 21 events
-
2026-06-18days on market $135,000 Active 228 DOM
-
2026-06-17days on market $135,000 Active 227 DOM
-
2026-06-16days on market $135,000 Active 226 DOM
-
2026-06-15days on market $135,000 Active 225 DOM
-
2026-06-13days on market $135,000 Active 223 DOM
-
2026-06-09days on market $135,000 Active 219 DOM
-
2026-06-08days on market $135,000 Active 218 DOM
-
2026-06-07days on market $135,000 Active 217 DOM
-
2026-06-04days on market $135,000 Active 214 DOM
-
2026-06-03days on market $135,000 Active 213 DOM
-
2026-06-02days on market $135,000 Active 212 DOM
-
2026-06-01days on market $135,000 Active 211 DOM
-
2026-05-31days on market $135,000 Active 210 DOM
-
2026-03-21price $135,000 251-char remark
Show marketing remark (251 chars)
GREAT LOCATION! 2-3 BEDROOM HOME READY FOR YOUR TOUCHES! NEEDS SOME UPDATING AND REPAIRS, HAS GOOD BONES! Easy access to main HWYS. Easy commute, 5-10 minutes to restaurants, shopping, doctors, hospital, etc. Great opportunity to own a prime location!
-
2026-01-26price $140,000 251-char remark
Show marketing remark (251 chars)
GREAT LOCATION! 2-3 BEDROOM HOME READY FOR YOUR TOUCHES! NEEDS SOME UPDATING AND REPAIRS, HAS GOOD BONES! Easy access to main HWYS. Easy commute, 5-10 minutes to restaurants, shopping, doctors, hospital, etc. Great opportunity to own a prime location!
-
2025-12-17price $150,000 251-char remark
Show marketing remark (251 chars)
GREAT LOCATION! 2-3 BEDROOM HOME READY FOR YOUR TOUCHES! NEEDS SOME UPDATING AND REPAIRS, HAS GOOD BONES! Easy access to main HWYS. Easy commute, 5-10 minutes to restaurants, shopping, doctors, hospital, etc. Great opportunity to own a prime location!
-
2025-11-20price $155,000 251-char remark
Show marketing remark (251 chars)
GREAT LOCATION! 2-3 BEDROOM HOME READY FOR YOUR TOUCHES! NEEDS SOME UPDATING AND REPAIRS, HAS GOOD BONES! Easy access to main HWYS. Easy commute, 5-10 minutes to restaurants, shopping, doctors, hospital, etc. Great opportunity to own a prime location!
-
2025-11-03$165,000 Active 251-char remark
Show marketing remark (251 chars)
GREAT LOCATION! 2-3 BEDROOM HOME READY FOR YOUR TOUCHES! NEEDS SOME UPDATING AND REPAIRS, HAS GOOD BONES! Easy access to main HWYS. Easy commute, 5-10 minutes to restaurants, shopping, doctors, hospital, etc. Great opportunity to own a prime location!
-
2025-10-07soldstatus
-
1992-09-29soldstatus
-
1992-09-15soldstatus
ⓘ Source: listings_history table (triggers on properties + properties_extension) + one-shot
backfill from property_details.listing_events for pre-trigger history.
Tax reassessment forecast TX · Resets to sale price
- Current annual tax
- $2,837 · $236/mo
- Projected year-2 tax
- $2,837 · $236/mo
- Expected delta
- $0/yr ($0/mo · 0.0%)
ⓘ Screening estimate from a state-policy table — verify with the county assessor before closing.
Climate risk First Street
- Flood 1/10 Low FEMA zone X (unshaded) · 0% chance over 30 yrs
- Wildfire 5/10 Major
- Heat 8/10 Severe 7 d/yr ≥111°F today · 23 d/yr by 30 yrs out
- Wind 8/10 Severe 99% chance of damaging wind over 30 yrs
- Air quality 2/10 Low 1 unhealthy d/yr today · 1 by 30 yrs out
Nearby sold comps map
Loading sold comps map…
Walkable amenities ~0.75 mi
Loading nearby amenities…
Taxation est. · year 1
- Rental income
- $19,243
- − Mortgage interest
- −$7,562
- − Property taxes
- −$2,837
- − Insurance
- −$675
- − Repairs & maintenance
- −$1,539
- − Management
- −$1,539
- − HOA
- −$132
- − Depreciation
- −$3,927
- Taxable income
- $1,030
- Est. tax owed @ 24.0%
- −$247
- After-tax cash flow
- $2,815/yr
For passive investors: Depreciation is non-cash, so a rental often shows a tax loss while cash-flowing — sheltering income. Rental losses are passive: they offset passive income freely, and up to $25,000/yr can offset ordinary (W-2) income if you actively participate and your MAGI is under $100k (phasing out to $0 by $150k); unused losses carry forward. On sale, claimed depreciation is recaptured at up to 25%, and gains may owe capital-gains tax (a 1031 exchange can defer both). Figures are a year-1 estimate at your 24.0% rate — not tax advice; consult a CPA.
Schools (NCES district)
- District
- Magnolia ISD
- NCES district ID
- 4828740
- Math proficiency
- 42% ▼ -7.00%
- Reading proficiency
- 45% ▼ -4.00%
- Median HH income
- $71,692
- Composite
- 39.46/100
- National rank
- #3958
- State rank
- #247 of 826 in TX
Livability — Magnolia
- Score
- 73/100
- State rank
- #222
- US rank
- #5442
Category grades
Schools grade is shown separately in the Schools card above.
Census & demographics
- County
- Montgomery County · 663,713 people
- City population
- 32,847
- Metro
- Houston-The Woodlands-Sugar Land, TX
- Population (ZIP)
- 32,847
- Household income
- $102,066
- Rent vs Own
- Severe rent burden
- 209.0
Population outlook (Montgomery County) Hauer SSP2
- Today (2025)
- 713,896 people
- By 2030
- 805,263 · +12.8%
- By 2040
- 992,708 · +39.1%
- By 2050
- 1,179,590 · +65.2%
- By 2075
- 1,628,084 · +128.1%
- By 2100
- 1,937,880 · +171.5%
Race, ethnicity, and origin ACS 2023
- Neighborhood character
- Predominantly White (68%)
- Race & ethnicity
- White 68% Hispanic / Latino 25% Two or more races 14% Black 2% Native American 2%
- Hispanic origin (detail)
- Mexican 18%
- Common ancestry
- Slovak 4% Serbian 2% Romanian 2%
- Foreign-born
- 7% · Canada, Jamaica
- Languages at home
- 82% English-only · Spanish 17%
Political lean MEDSL · Montgomery
- 2024 margin
- Solid R (+45.5) · D 26.8% · R 72.3%
- 2008→2024 swing
- +7.2pp toward D · 2008: -52.7pp · 2024: -45.5pp
- All cycles
- 2024: R+45.5 2020: R+43.8 2016: R+51.4 2012: R+60.7 2008: R+52.7
Not yet ingested
- Civics
- —
Market trends
- HPI YoY
- ▼ -116.90%
- Current HPI
- 268.5845
- Rent YoY
- —
- Metro
- Houston-The Woodlands-Sugar Land, TX
- State GDP YoY
- ▲ 3.95%
- F500 in state
- 110
Industry mix (Fortune 500 HQ in TX)
| Industry | F500 HQs | Revenue |
|---|---|---|
| Energy | 16 | $1,198B |
|
||
| Technology | 5 | $198B |
|
||
| Engineering / Construction | 4 | $72B |
|
||
| Energy Services | 3 | $60B |
|
||
| Utilities | 3 | $41B |
|
||
| Healthcare | 2 | $330B |
|
||
Price history
-18.2% since first listed8 events — show timeline
- 2026-03-21 Price Changed $135,000 HARMLS
- 2026-01-26 Price Changed $140,000 HARMLS
- 2025-12-17 Price Changed $150,000 HARMLS
- 2025-11-20 Price Changed $155,000 HARMLS
- 2025-11-03 Listed $165,000 HARMLS
- 2025-10-07 Sold (Public Records) — Public Records
- 1992-09-29 Sold (Public Records) — Public Records
- 1992-09-15 Sold (Public Records) — Public Records
Property tax history
+3.4%/yrLatest (2025): $2,837 · +1.9% YoY. Source: county tax records.
Cash-flow waterfall
monthlySold comps — $/sqft
last 12 mo · ≤1 miLoading sold comps…