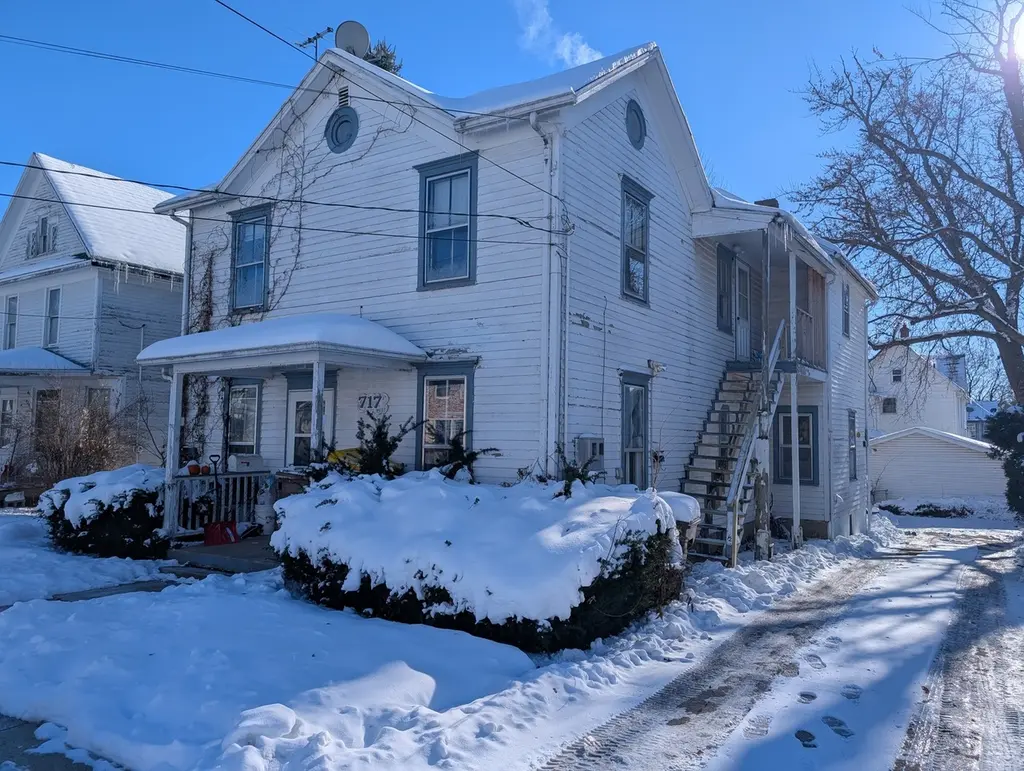
717 W Pleasant St · Freeport, IL
Flood risk 1/10 · Minimal
- FEMA flood zone
- X (unshaded)
- Chance of flooding over 30 yrs
- 0.0%
- Est. flood insurance / yr
- $507 – $1,088
Fire risk 1/10 · Minimal
- Est. fire insurance / yr
- $804 – $1,492
Heat risk 3/10 · Minor
- Hot days now (above 101°F)
- 7 days/yr
- Hot days in 30 yrs
- 15 days/yr
Wind risk 2/10 · Minimal
- Chance of severe wind over 30 yrs
- —
Air-quality risk 2/10 · Minimal
- Unhealthy air days now
- 1 days/yr
- Unhealthy air days in 30 yrs
- 2 days/yr
Risk factors via First Street. Map © Google.
Why this score? — see what drove the B- grade
The composite is a weighted blend of 9 inputs, each scored 0–100. Each bar is that input's sub-score; the figure is the points it added to the 100-point composite (weight × sub-score).
- Cash flow +30.0/30.0
- DSCR +10.0/10.0
- 1% rule +8.7/10.0
- ARV discount +8.2/15.0
- Livability +3.6/5.0
- Rent growth +2.5/5.0
- Condition / age +2.5/5.0
- Schools +1.0/10.0
- Appreciation +0.0/10.0
$85,000
🖨 Deal sheet 📄 Offer letter ✓ Due diligence
Listing remarks MLS
Great two-flat investment proprety with each unit offering nearly 1,000 square feet of living space. Both units feature a living room, one to two bedrooms, and a full bath, along with ample off-street parking. The property generates $1,600 per month in rental income, with tenants responsible for all utilities except water and sewer, supporting strong cash flow and reduced owner expenses. The main-floor unit offers excellent owner-occupant potential and includes a large 16' x 14' deck, spacious kitchen, and laundry hookups, making it ideal for a buyer looking to live in one unit while renting the other. A solid opportunity for investors or owner-occupants seeking rental income, mortgage offset, and long-term value. Let the tenants help pay your mortgage while you build equity.
Key facts
- Large deck
- Spacious kitchen
- Off-street parking
Tags
Neighborhood map
What this means for you Summary
Snapshot
- This is a 3-bed/2.0-bath other listed at $85k.
Deal economics
- At list price, monthly cash flow is $341 ($4k/yr) — positive.
- The deal already cash-flows at list — no discount required.
- Meets the 1% rule at list price ($1k rent vs $85k).
- Recommended offer: $75k (12.0% below list) — sets the bar for market timing.
- Cap rate 11.1% vs local median 5.8% in Freeport — top-decile yield for the area; either an underpriced asset or a hidden risk that comps aren't pricing in. Stress-test before assuming the spread holds.
Location & tenants
- Location reads 72/100 on livability (#302 in IL) — a middle-class / working-renter tenant base. Strengths: cost of living A+, health & safety A+, housing A-; Watch: schools F, commute F, employment F.
- Freeport SD 145 (town): math 11% / reading 12% proficiency, ranked #565 of 620 in IL (top 91%) — low school quality limits family demand, transient renter base, plan for 1-2y turnover; 65% free/reduced lunch — lower-income household profile, screen leases tightly.
- Market conditions: 197 active listings in the ZIP; 24 comparable units currently listed for rent nearby; rentals lingering (median 44d on market — plan ~5-8 weeks vacancy on turnover, expect pricing pressure); 75% of comp listings sitting > 30 days — soft ceiling on asking rent; 7 units permitted in Stephenson County in 2024 (0 in 5+ unit buildings).
Forward outlook
- Local home prices are declining (-3.0%/yr); year-one equity from $588 of loan paydown is wiped out by about $3k of value loss. Plan a longer hold.
- Stephenson County population projected at -29% by 2050 — secular population decline; favor cash flow + early exit over multi-decade hold.
- At projected returns (-3.0% appreciation + 3.0% rent growth), your $24k cash investment doubles in ~7 years — after that, you're playing with house money.
Negotiation context
- It's been on market 184 days — a 12% lower offer ($75k) is reasonable based on typical stale-listing flexibility.
- 6 sale attempts since 8y ago with the ask held roughly flat each time — persistent listings suggest the price (not the market) is what's stuck; bring a comps-based counter.
- Current owner paid $23k; list at $85k implies a 270% gain — meaningful room to come down on a strong offer.
Risks & watch-outs
- Watch-outs: built in 1867 — expect roof / HVAC / electrical / plumbing capex.
Questions for the listing agent
- It's been on market 184 days. Have you received any prior offers? Is the seller open to a 12% concession, seller financing, or rate buy-down credit?
- Built in 1867 — when were the roof, HVAC, electrical panel, plumbing, and water heater last replaced?
- Why hasn't it sold? Are there any deal-killer items the seller is aware of (foundation, flood, title, zoning, code violations)?
- Is there a deadline driving the sale (1031 exchange, divorce, estate, relocation)? That informs how much negotiation room exists.
- Schools are F-rated, which usually means shorter tenancies and higher turnover. Who's the typical renter profile here, and what's been the actual vacancy rate?
- What's the average days-on-market for RENTAL listings here right now (not sales)? A rising rental-DOM trend means longer vacancies and softer asking-rent achievability than the comps imply.
- What's the recent tenant-quality profile in this submarket — average credit score on applications, eviction rate, late-payment / NSF rate, and stable-employment percentage? A property-management company in the area should have these aggregated.
- How much new for-sale + rental construction is in the pipeline within 1–3 miles? Heavy new supply typically softens prices + rents 12–24 months out; constrained supply supports both.
Investment metrics
- 1% rule
- 1.37% ✓
- Cap rate
- 11.10%
- Cash-on-cash
- 17.17%
- DSCR
- 1.76
- GRM
- 6.1
CMA / ARV
- ARV (median comp)
- $86,307
- List price
- $85,000
- Delta
- -1.51%
- Verdict
- FAIR
- Comps
- 20 within 1.0 mi
Projected returns pro-forma
-3.0% appreciation · 3.0% rent growth · sell at horizon
- IRR
- 8.5%
- Equity multiple
- 1.33×
- Total profit
- $7,931
- Equity at exit
- $12,674
- IRR
- 17.7%
- Equity multiple
- 2.47×
- Total profit
- $34,889
- Equity at exit
- $7,349
Cash invested: $23,800 (down + closing). Projections, not guarantees.
Landlord ↔ Tenant lean methodology
- Overall (STATE)
- 43 Moderately Tenant-Leaning
- State Illinois
- 43 Moderately Tenant-Leaning · D+7
- County
- — inherits STATE
- City
- — inherits STATE
ZIP-level market 61032
- Home prices YoY
- -19.5%
- Active inventory
- 197
- Price-to-rent
- 6.1×
Monthly cashflow live
- Estimated rent
- $1,164 high interval (Pro) →
- Mortgage (P&I)
- −$446
- Tax from tax record
- −$98 /mo · $1,173/yr
- Insurance
- −$35
- HOA
- −$0
- Vacancy / Maint / Mgmt
- −$244
- Net cashflow
- $341
Break-even live
UW: 25.0% down · 7.5% · 30yr · 1.5% tax · 5.0% vac · 8.0% maint · 8.0% mgmt
Financing live
Cash to close
- Down payment
- $21,250
- Closing costs
- $2,550
- Reserves months
- —
- Total cash needed
- —
Loan-product check · same deal, 3 products live
Conventional
25% down · 7.5% · 30yr
- Down + closing
- —
- Monthly P&I
- —
- Monthly cashflow
- —
- DSCR
- —
- Eligible?
- —
Personal DTI + credit; lowest rate.
DSCR
20% down · 8.5% · 30yr
- Down + closing
- —
- Monthly P&I
- —
- Monthly cashflow
- —
- DSCR
- —
- Eligible?
- —
No personal income docs; deal must DSCR.
Hard money
10% down · 12.0% · 12mo
- Down + closing
- —
- Monthly P&I
- —
- Monthly cashflow
- —
- DSCR
- —
- Eligible?
- —
Short-term bridge; refi at stabilization.
Rent comps 24 comps
| Address | Beds | Baths | Sqft | Rent | $/sqft | DOM | Units | Dist |
|---|---|---|---|---|---|---|---|---|
| 742 W Homer St Freeport, IL | 3.0 | 1.0 | 1434 | $1,325 | $0.92 | 43d | 1 | 0.16mi |
| 833 W Pleasant St Freeport, IL | 3.0 | 2.0 | — | $1,300 | — | 43d | 1 | 0.22mi |
| 407 S Beaver Ave Freeport, IL | 2.0 | 1.0 | — | $700 | — | 43d | 1 | 0.22mi |
| 503 W Pleasant St Freeport, IL | 3.0 | 1.0 | — | $950 | — | 43d | 1 | 0.24mi |
| 837 W Stephenson St Freeport, IL | 2.0 | 1.0 | 1330 | $1,000 | $0.75 | 43d | 1 | 0.26mi |
| 303 N West Ave Freeport, IL | 3.0 | 1.5 | — | $1,200 | — | 43d | 1 | 0.37mi |
| 320 W Clark St Freeport, IL | 4.0 | 1.0 | 1509 | $1,395 | $0.92 | 43d | 1 | 0.39mi |
| 934 W Stephenson St Freeport, IL | 3.0 | 1.0 | — | $950 | — | 43d | 1 | 0.41mi |
| 435 N Apple Ave Freeport, IL | 4.0 | 2.0 | 1500 | $1,450 | $0.97 | 43d | 1 | 0.46mi |
| 816 S James Ave Freeport, IL | 3.0 | 1.0 | 1152 | $1,325 | $1.15 | 43d | 1 | 0.48mi |
| 434 1/2 S State Ave Freeport, IL | 3.0 | 2.0 | 2544 | $1,595 | $0.63 | 43d | 1 | 0.69mi |
| 601 N Winnebago Ave Freeport, IL | 3.0 | 1.0 | 784 | $1,225 | $1.56 | 43d | 1 | 0.70mi |
| 316 E Winslow St Freeport, IL | 2.0 | 1.0 | 812 | $1,295 | $1.59 | 21d | 1 | 0.83mi |
| 1645 Hilltop Pl Freeport, IL | 3.0 | 1.0 | 1008 | $1,000 | $0.99 | 43d | 1 | 0.87mi |
| 1645 Hilltop Pl Unit 2 Freeport, IL | 3.0 | 1.5 | 1008 | $1,000 | $0.99 | 43d | 1 | 0.87mi |
| 404 E Prospect Ter Freeport, IL | 4.0 | 2.0 | 2560 | $1,525 | $0.60 | 21d | 1 | 0.88mi |
| 1214 S Saxby Ave Freeport, IL | 3.0 | 1.0 | — | $995 | — | 43d | 1 | 0.94mi |
| 1432 W American St Freeport, IL | 3.0 | 1.0 | — | $1,500 | — | 43d | 1 | 1.01mi |
| 1436 W American St Freeport, IL | 2.0 | 1.0 | 714 | $1,100 | $1.54 | 43d | 1 | 1.02mi |
| 810 E Shawnee St Freeport, IL | 2.0 | 1.0 | 962 | $1,495 | $1.55 | 21d | 1 | 1.18mi |
| 1763 S Hance Dr Unit 6 Freeport, IL | 2.0 | 1.0 | 800 | $950 | $1.19 | 43d | 1 | 1.20mi |
| 1021 S Columbia Ave Freeport, IL | 3.0 | 1.0 | — | $1,200 | — | 13d | 1 | 1.29mi |
| 916 E Garden St Freeport, IL | 2.0 | 1.0 | — | $1,000 | — | 13d | 1 | 1.34mi |
| 933 E Clinton St Freeport, IL | 2.0 | 1.0 | — | $1,000 | — | 13d | 1 | 1.36mi |
Listing history 26 events
-
2026-06-18days on market $85,000 Active 184 DOM
-
2026-06-17days on market $85,000 Active 183 DOM
-
2026-06-16days on market $85,000 Active 182 DOM
-
2026-06-15days on market $85,000 Active 181 DOM
-
2026-06-13days on market $85,000 Active 179 DOM
-
2026-06-12days on market $85,000 Active 178 DOM
-
2026-06-09days on market $85,000 Active 175 DOM
-
2026-06-08days on market $85,000 Active 174 DOM
-
2026-06-07days on market $85,000 Active 173 DOM
-
2026-06-07days on market $85,000 Active 172 DOM
-
2026-06-04days on market $85,000 Active 169 DOM
-
2026-06-02days on market $85,000 Active 168 DOM
-
2026-06-01days on market $85,000 Active 167 DOM
-
2026-05-31days on market $85,000 Active 166 DOM
-
2026-05-31days on market $85,000 Active 165 DOM
-
2026-04-14status Active 786-char remark
Show marketing remark (786 chars)
Great two-flat investment property with each unit offering nearly 1,000 square feet of living space. Both units feature a living room, one to two bedrooms, and a full bath, along with ample off-street parking. The property generates $1,600 per month in rental income, with tenants responsible for all utilities except water and sewer, supporting strong cash flow and reduced owner expenses. The main-floor unit offers excellent owner-occupant potential and includes a large 16' x 14' deck, spacious kitchen, and laundry hookups, making it ideal for a buyer looking to live in one unit while renting the other. A solid opportunity for investors or owner-occupants seeking rental income, mortgage offset, and long-term value. Let the tenants help pay your mortgage while you build equity.
-
2026-04-08status Pending 786-char remark
Show marketing remark (786 chars)
Great two-flat investment property with each unit offering nearly 1,000 square feet of living space. Both units feature a living room, one to two bedrooms, and a full bath, along with ample off-street parking. The property generates $1,600 per month in rental income, with tenants responsible for all utilities except water and sewer, supporting strong cash flow and reduced owner expenses. The main-floor unit offers excellent owner-occupant potential and includes a large 16' x 14' deck, spacious kitchen, and laundry hookups, making it ideal for a buyer looking to live in one unit while renting the other. A solid opportunity for investors or owner-occupants seeking rental income, mortgage offset, and long-term value. Let the tenants help pay your mortgage while you build equity.
-
2026-04-08historical Contingent - Continue to Show 786-char remark
Show marketing remark (786 chars)
Great two-flat investment property with each unit offering nearly 1,000 square feet of living space. Both units feature a living room, one to two bedrooms, and a full bath, along with ample off-street parking. The property generates $1,600 per month in rental income, with tenants responsible for all utilities except water and sewer, supporting strong cash flow and reduced owner expenses. The main-floor unit offers excellent owner-occupant potential and includes a large 16' x 14' deck, spacious kitchen, and laundry hookups, making it ideal for a buyer looking to live in one unit while renting the other. A solid opportunity for investors or owner-occupants seeking rental income, mortgage offset, and long-term value. Let the tenants help pay your mortgage while you build equity.
-
2025-12-15$85,000 Active 786-char remark
Show marketing remark (786 chars)
Great two-flat investment property with each unit offering nearly 1,000 square feet of living space. Both units feature a living room, one to two bedrooms, and a full bath, along with ample off-street parking. The property generates $1,600 per month in rental income, with tenants responsible for all utilities except water and sewer, supporting strong cash flow and reduced owner expenses. The main-floor unit offers excellent owner-occupant potential and includes a large 16' x 14' deck, spacious kitchen, and laundry hookups, making it ideal for a buyer looking to live in one unit while renting the other. A solid opportunity for investors or owner-occupants seeking rental income, mortgage offset, and long-term value. Let the tenants help pay your mortgage while you build equity.
-
2018-07-19soldstatus $23,000
-
2018-07-13soldstatus $24,000
-
2018-06-16status Pending
-
2018-06-12New
-
2018-06-11$29,000
ⓘ Source: listings_history table (triggers on properties + properties_extension) + one-shot
backfill from property_details.listing_events for pre-trigger history.
Tax reassessment forecast IL · Partial reset (capped growth)
- Current annual tax
- $1,173 · $98/mo
- Projected year-2 tax
- $1,551 · $129/mo
- Expected delta
- +$378/yr (+$32/mo · 32.3%)
ⓘ Screening estimate from a state-policy table — verify with the county assessor before closing.
Climate risk First Street
- Flood 1/10 Low FEMA zone X (unshaded) · 0% chance over 30 yrs
- Wildfire 1/10 Low
- Heat 3/10 Moderate 7 d/yr ≥101°F today · 15 d/yr by 30 yrs out
- Wind 2/10 Low
- Air quality 2/10 Low 1 unhealthy d/yr today · 2 by 30 yrs out
Nearby sold comps map
Loading sold comps map…
Walkable amenities ~0.75 mi
Loading nearby amenities…
Taxation est. · year 1
- Rental income
- $13,967
- − Mortgage interest
- −$4,761
- − Property taxes
- −$1,173
- − Insurance
- −$425
- − Repairs & maintenance
- −$1,117
- − Management
- −$1,117
- − Depreciation
- −$2,473
- Taxable income
- $2,900
- Est. tax owed @ 24.0%
- −$696
- After-tax cash flow
- $3,391/yr
For passive investors: Depreciation is non-cash, so a rental often shows a tax loss while cash-flowing — sheltering income. Rental losses are passive: they offset passive income freely, and up to $25,000/yr can offset ordinary (W-2) income if you actively participate and your MAGI is under $100k (phasing out to $0 by $150k); unused losses carry forward. On sale, claimed depreciation is recaptured at up to 25%, and gains may owe capital-gains tax (a 1031 exchange can defer both). Figures are a year-1 estimate at your 24.0% rate — not tax advice; consult a CPA.
Schools (NCES district)
- District
- Freeport SD 145
- NCES district ID
- 1715900
- Math proficiency
- 11% ▼ -3.00%
- Reading proficiency
- 12% ▼ -5.00%
- Median HH income
- $39,803
- Composite
- 9.89/100
- National rank
- #9821
- State rank
- #565 of 620 in IL
Livability — Freeport
- Score
- 72/100
- State rank
- #302
- US rank
- #5927
Category grades
Schools grade is shown separately in the Schools card above.
Census & demographics
- Census place
- Freeport, IL
- Population (ZIP)
- 29,072
Population outlook (Stephenson County) Hauer SSP2
- Today (2025)
- 41,802 people
- By 2030
- 39,487 · -5.5%
- By 2040
- 34,534 · -17.4%
- By 2050
- 29,693 · -29.0%
- By 2075
- 21,196 · -49.3%
- By 2100
- 14,596 · -65.1%
Race, ethnicity, and origin ACS 2023
- Neighborhood character
- Predominantly White (73%)
- Race & ethnicity
- White 73% Black 12% Two or more races 10% Hispanic / Latino 6% Asian 1%
- Hispanic origin (detail)
- Mexican 4% Puerto Rican 1%
- Common ancestry
- Iranian 3% Romanian 2% Lithuanian 2%
- Foreign-born
- 3% · Canada
- Languages at home
- 96% English-only · Spanish 3% Other Indo-European 1%
Political lean MEDSL · Stephenson
- 2024 margin
- R (+19.4) · D 39.5% · R 58.9% · Other 1.6%
- 2008→2024 swing
- -26.1pp toward R · 2008: 6.7pp · 2024: -19.4pp
- All cycles
- 2024: R+19.4 2020: R+15.7 2016: R+17.0 2012: R+4.6 2008: D+6.7
Not yet ingested
- Civics
- —
Market trends
- HPI YoY
- ▼ -39.75%
- Current HPI
- 163.677
- Rent YoY
- —
- Metro
- —
- State GDP YoY
- ▲ 1.59%
- F500 in state
- 60
Industry mix (Fortune 500 HQ in IL)
| Industry | F500 HQs | Revenue |
|---|---|---|
| Insurance | 4 | $201B |
|
||
| Consumer Goods | 4 | $87B |
|
||
| Industrial Machinery | 3 | $64B |
|
||
| Healthcare | 2 | $55B |
|
||
| Retail / Pharmacy | 1 | $148B |
|
||
| Agriculture / Food | 1 | $86B |
|
||
Price history
+193.1% since first listed11 events — show timeline
- 2026-04-14 Relisted — NWIAR
- 2026-04-14 Relisted — MRED as Distributed by MLS Grid
- 2026-04-08 Pending — NWIAR
- 2026-04-08 Contingent — MRED as Distributed by MLS Grid
- 2025-12-15 Listed $85,000 NWIAR
- 2025-12-15 Listed $85,000 MRED as Distributed by MLS Grid
- 2018-07-19 Sold (Public Records) $23,000 Public Records
- 2018-07-13 Sold (MLS) $24,000 NWIAR
- 2018-06-16 Pending — MRED as Distributed by MLS Grid
- 2018-06-12 Listed — MRED as Distributed by MLS Grid
- 2018-06-11 Listed $29,000 NWIAR
Property tax history
+80.1%/yrLatest (2024): $1,173 · -16.5% YoY. Source: county tax records.
Cash-flow waterfall
monthlySold comps — $/sqft
last 12 mo · ≤1 miLoading sold comps…