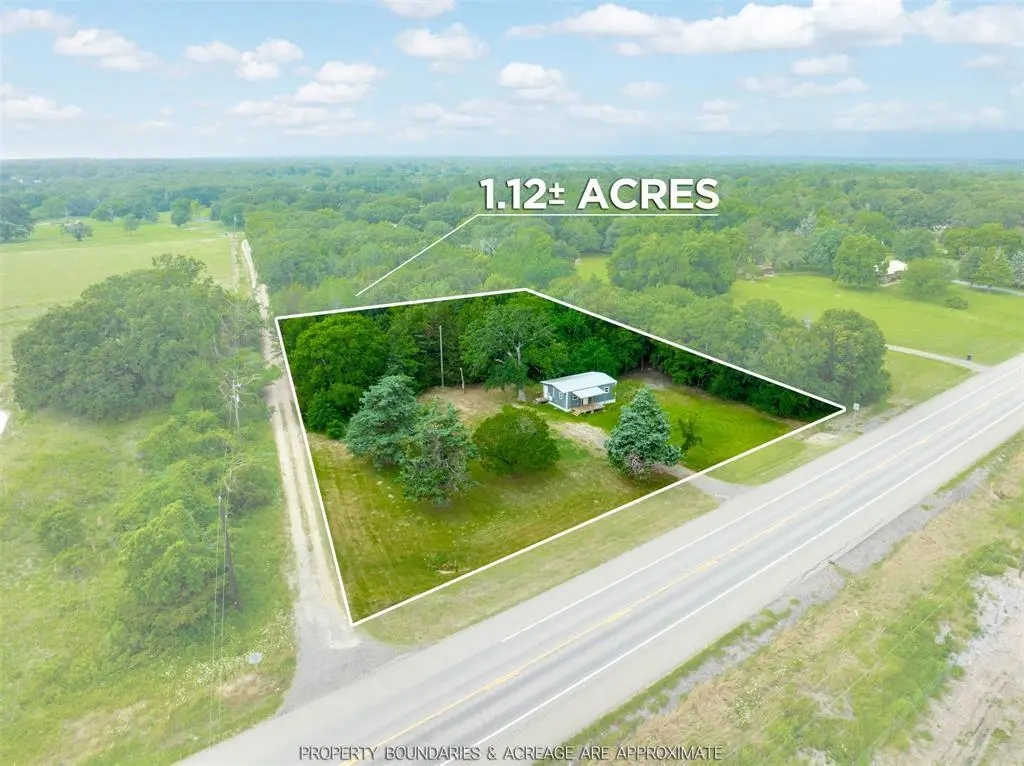
2575 State Highway 37 N · Clarksville, TX
Flood risk 1/10 · Minimal
- FEMA flood zone
- —
- Chance of flooding over 30 yrs
- 0.0%
- Est. flood insurance / yr
- —
Fire risk 6/10 · Moderate
- Est. fire insurance / yr
- $1,222 – $2,270
Heat risk 7/10 · Major
- Hot days now (above 109°F)
- 7 days/yr
- Hot days in 30 yrs
- 22 days/yr
Wind risk 4/10 · Minor
- Chance of severe wind over 30 yrs
- 24.0%
Air-quality risk 1/10 · Minimal
- Unhealthy air days now
- 0 days/yr
- Unhealthy air days in 30 yrs
- 0 days/yr
Risk factors via First Street. Map © Google.
Why this score? — see what drove the C+ grade
The composite is a weighted blend of 9 inputs, each scored 0–100. Each bar is that input's sub-score; the figure is the points it added to the 100-point composite (weight × sub-score).
- Cash flow +21.2/30.0
- Appreciation +10.0/10.0
- ARV discount +7.5/15.0
- DSCR +6.8/10.0
- 1% rule +4.6/10.0
- Livability +3.4/5.0
- Rent growth +2.5/5.0
- Condition / age +2.5/5.0
- Schools +1.9/10.0
$79,900
🖨 Deal sheet 📄 Offer letter ✓ Due diligence
Listing remarks
Outside the city limits and full of charm, this darling tiny home on over an acre offers endless possibilities at a price point that’s hard to find! Conveniently located just minutes from the country club and lake, and less than an hour from Broken Bow State Park, this property is ideal as a weekend getaway, short-term rental investment, starter home, or cozy forever home. Enjoy the peace of country living with room to roam, all while staying close to recreation and amenities. Small in size but big on opportunity—priced under $100,000, this one won’t last long!
Key facts
- Over an acre
- Lake
- 1.12 acre lot
Tags
Property features AI
Finance
- Other: Property listed as standard condition; Possession at closing/funding
- Financial info: Listing is for cash offers; No second mortgage listed
- HOA & community: No association
Exterior
- Parking: On-site parking
- Security: Smoke detector(s)
- Utilities: Co-op electric; Co-op water; Not in a municipal utility district
- Home design: Single family residence; Residential property; Attached property; Built in 2022; One story
- Construction: Metal roof; Pillar/post/pier foundation; Preowned (built 2022)
- Exterior features: Acreage lot (about 1.12 acres); Partially wooded; Sandy loam soil
Interior
- Kitchen: Electric cooktop; Built-in cabinets; Farm sink
- Bedrooms: 1 bedroom (primary on main level)
- Flooring: Luxury vinyl plank flooring
- Bathrooms: 1 full bathroom
- Heating & cooling: Central heating; Central air conditioning
- Interior features: Decorative lighting; 5 total rooms; One level
- Laundry & utility: Full-size washer/dryer area; Washer hookup; Electric dryer hookup
Neighborhood map
What this means for you Summary
Snapshot
- This is a 1-bed/1.0-bath manufactured listed at $80k.
Deal economics
- At list price, monthly cash flow is $115 ($1k/yr) — positive.
- The deal already cash-flows at list — no discount required.
- To meet the 1% rule (rent ≥ 1% of price), the offer needs to be $76k (4.4% below list).
- Recommended offer: $76k (4.4% below list) — sets the bar for 1% rule.
- Cap rate 8.0% vs local median 6.1% in Clarksville — top-decile yield for the area; either an underpriced asset or a hidden risk that comps aren't pricing in. Stress-test before assuming the spread holds.
Location & tenants
- Location reads 67/100 on livability (#523 in TX) — a middle-class / working-renter tenant base. Strengths: crime A+, cost of living A+; Watch: schools F, amenities F, commute F.
- Clarksville ISD (town): math 20% / reading 27% proficiency, ranked #752 of 826 in TX (top 91%) — low school quality limits family demand, transient renter base, plan for 1-2y turnover; 77% free/reduced lunch — lower-income household profile, screen leases tightly.
- Market conditions: 87 active listings in the ZIP; 14 units permitted in Red River County in 2024 (0 in 5+ unit buildings).
Forward outlook
- In year one you build about $9k of equity ($552 loan paydown + $8k appreciation (10.0% local appreciation)).
- Red River County population projected at -25% by 2050 — secular population decline; favor cash flow + early exit over multi-decade hold.
- At projected returns (10.0% appreciation + 3.0% rent growth), your $22k cash investment doubles in ~3 years — after that, you're playing with house money.
- By year 4, paydown + projected appreciation supports a ~$30k cash-out refi (75% LTV) — recoverable capital for the next deal without selling this one.
Negotiation context
- It's been on market 29 days — a 2% lower offer ($79k) is reasonable based on typical stale-listing flexibility.
Risks & watch-outs
- Climate carrying-cost: major wildfire risk; extreme-heat days projected 7→22/yr by 2055 (HVAC capex compounding) — expect insurance premiums to compound above CPI over the hold.
Questions for the listing agent
- Is there a deadline driving the sale (1031 exchange, divorce, estate, relocation)? That informs how much negotiation room exists.
- Schools are F-rated, which usually means shorter tenancies and higher turnover. Who's the typical renter profile here, and what's been the actual vacancy rate?
- What's the average days-on-market for RENTAL listings here right now (not sales)? A rising rental-DOM trend means longer vacancies and softer asking-rent achievability than the comps imply.
- What's the recent tenant-quality profile in this submarket — average credit score on applications, eviction rate, late-payment / NSF rate, and stable-employment percentage? A property-management company in the area should have these aggregated.
- How much new for-sale + rental construction is in the pipeline within 1–3 miles? Heavy new supply typically softens prices + rents 12–24 months out; constrained supply supports both.
Investment metrics
- 1% rule
- 0.96% ✗
- Cap rate
- 8.03%
- Cash-on-cash
- 6.19%
- DSCR
- 1.28
- GRM
- 8.7
CMA / ARV
No comps found within radius.
Projected returns pro-forma
10.0% appreciation · 3.0% rent growth · sell at horizon
- IRR
- 28.8%
- Equity multiple
- 3.27×
- Total profit
- $50,838
- Equity at exit
- $71,980
- IRR
- 25.0%
- Equity multiple
- 7.43×
- Total profit
- $143,873
- Equity at exit
- $155,228
Cash invested: $22,372 (down + closing). Projections, not guarantees.
Landlord ↔ Tenant lean methodology
- Overall (STATE)
- 87 Strongly Landlord-Friendly
- State Texas
- 87 Strongly Landlord-Friendly · R+5
- County
- — inherits STATE
- City
- — inherits STATE
ZIP-level market 75426
- Home prices YoY
- 11.5%
- Active inventory
- 87
- Price-to-rent
- 8.7×
Monthly cashflow live
- Estimated rent
- $764 medium interval (Pro) →
- Mortgage (P&I)
- −$419
- Tax from tax record
- −$36 /mo · $427/yr
- Insurance
- −$33
- HOA
- −$0
- Vacancy / Maint / Mgmt
- −$160
- Net cashflow
- $115
Break-even live
UW: 25.0% down · 7.5% · 30yr · 1.5% tax · 5.0% vac · 8.0% maint · 8.0% mgmt
Financing live
Cash to close
- Down payment
- $19,975
- Closing costs
- $2,397
- Reserves months
- —
- Total cash needed
- —
Loan-product check · same deal, 3 products live
Conventional
25% down · 7.5% · 30yr
- Down + closing
- —
- Monthly P&I
- —
- Monthly cashflow
- —
- DSCR
- —
- Eligible?
- —
Personal DTI + credit; lowest rate.
DSCR
20% down · 8.5% · 30yr
- Down + closing
- —
- Monthly P&I
- —
- Monthly cashflow
- —
- DSCR
- —
- Eligible?
- —
No personal income docs; deal must DSCR.
Hard money
10% down · 12.0% · 12mo
- Down + closing
- —
- Monthly P&I
- —
- Monthly cashflow
- —
- DSCR
- —
- Eligible?
- —
Short-term bridge; refi at stabilization.
Listing history 17 events
-
2026-06-19days on market $79,900 Active 29 DOM
-
2026-06-18days on market $79,900 Active 28 DOM
-
2026-06-17days on market $79,900 Active 27 DOM
-
2026-06-16days on market $79,900 Active 26 DOM
-
2026-06-15days on market $79,900 Active 25 DOM
-
2026-06-14days on market $79,900 Active 23 DOM
-
2026-06-12days on market $79,900 Active 22 DOM
-
2026-06-09days on market $79,900 Active 19 DOM
-
2026-06-08days on market $79,900 Active 18 DOM
-
2026-06-07days on market $79,900 Active 17 DOM
-
2026-06-07days on market $79,900 Active 16 DOM
-
2026-06-03days on market $79,900 Active 13 DOM
-
2026-06-02days on market $79,900 Active 12 DOM
-
2026-06-01days on market $79,900 Active 11 DOM
-
2026-05-31days on market $79,900 Active 10 DOM
-
2026-05-30days on market $79,900 Active 9 DOM
-
2026-05-21$79,900 Active
ⓘ Source: listings_history table (triggers on properties + properties_extension) + one-shot
backfill from property_details.listing_events for pre-trigger history.
Tax reassessment forecast TX · Resets to sale price
- Current annual tax
- $427 · $36/mo
- Projected year-2 tax
- $1,462 · $122/mo
- Expected delta
- +$1,035/yr (+$86/mo · 242.2%)
ⓘ Screening estimate from a state-policy table — verify with the county assessor before closing.
Climate risk First Street
- Flood 1/10 Low 0% chance over 30 yrs
- Wildfire 6/10 Major
- Heat 7/10 Severe 7 d/yr ≥109°F today · 22 d/yr by 30 yrs out
- Wind 4/10 Moderate 24% chance of damaging wind over 30 yrs
- Air quality 1/10 Low 0 unhealthy d/yr today · 0 by 30 yrs out
Nearby sold comps map
Loading sold comps map…
Walkable amenities ~0.75 mi
Loading nearby amenities…
Taxation est. · year 1
- Rental income
- $9,164
- − Mortgage interest
- −$4,476
- − Property taxes
- −$427
- − Insurance
- −$400
- − Repairs & maintenance
- −$733
- − Management
- −$733
- − Depreciation
- −$2,324
- Taxable income
- $71
- Est. tax owed @ 24.0%
- −$17
- After-tax cash flow
- $1,368/yr
For passive investors: Depreciation is non-cash, so a rental often shows a tax loss while cash-flowing — sheltering income. Rental losses are passive: they offset passive income freely, and up to $25,000/yr can offset ordinary (W-2) income if you actively participate and your MAGI is under $100k (phasing out to $0 by $150k); unused losses carry forward. On sale, claimed depreciation is recaptured at up to 25%, and gains may owe capital-gains tax (a 1031 exchange can defer both). Figures are a year-1 estimate at your 24.0% rate — not tax advice; consult a CPA.
Schools (NCES district)
- District
- Clarksville ISD
- NCES district ID
- 4814190
- Math proficiency
- 20% ▼ -12.00%
- Reading proficiency
- 27% ▼ -2.00%
- Median HH income
- $31,795
- Composite
- 19.05/100
- National rank
- #8842
- State rank
- #752 of 826 in TX
Livability — Clarksville
- Score
- 67/100
- State rank
- #523
- US rank
- #10265
Category grades
Schools grade is shown separately in the Schools card above.
Census & demographics
- Population (ZIP)
- 4,199
Population outlook (Red River County) Hauer SSP2
- Today (2025)
- 11,454 people
- By 2030
- 10,874 · -5.1%
- By 2040
- 9,715 · -15.2%
- By 2050
- 8,552 · -25.3%
- By 2075
- 6,042 · -47.2%
- By 2100
- 4,037 · -64.8%
Race, ethnicity, and origin ACS 2023
- Neighborhood character
- Diverse neighborhood (Simpson 0.56)
- Race & ethnicity
- White 52% Black 40% Hispanic / Latino 5% Two or more races 3%
- Hispanic origin (detail)
- Mexican 3%
- Common ancestry
- Slovak 1%
- Foreign-born
- 2% · Canada, China
- Languages at home
- 96% English-only · Spanish 3% Chinese 1%
Political lean MEDSL · Red River
- 2024 margin
- Solid R (+61.8) · D 19.0% · R 80.8%
- 2008→2024 swing
- -23.7pp toward R · 2008: -38.0pp · 2024: -61.8pp
- All cycles
- 2024: R+61.8 2020: R+56.3 2016: R+53.9 2012: R+40.7 2008: R+38.0
Not yet ingested
- Civics
- —
Market trends
- HPI YoY
- ▲ 17.13%
- Current HPI
- 166.5937
- Rent YoY
- —
- Metro
- —
- State GDP YoY
- ▲ 3.95%
- F500 in state
- 110
Industry mix (Fortune 500 HQ in TX)
| Industry | F500 HQs | Revenue |
|---|---|---|
| Energy | 16 | $1,198B |
|
||
| Technology | 5 | $198B |
|
||
| Engineering / Construction | 4 | $72B |
|
||
| Energy Services | 3 | $60B |
|
||
| Utilities | 3 | $41B |
|
||
| Healthcare | 2 | $330B |
|
||
Price history
1 event — show timeline
- 2026-05-21 Listed $79,900 NTREIS
Property tax history
+9.5%/yrLatest (2025): $427 · +13.9% YoY. Source: county tax records.
Cash-flow waterfall
monthlySold comps — $/sqft
last 12 mo · ≤1 miLoading sold comps…