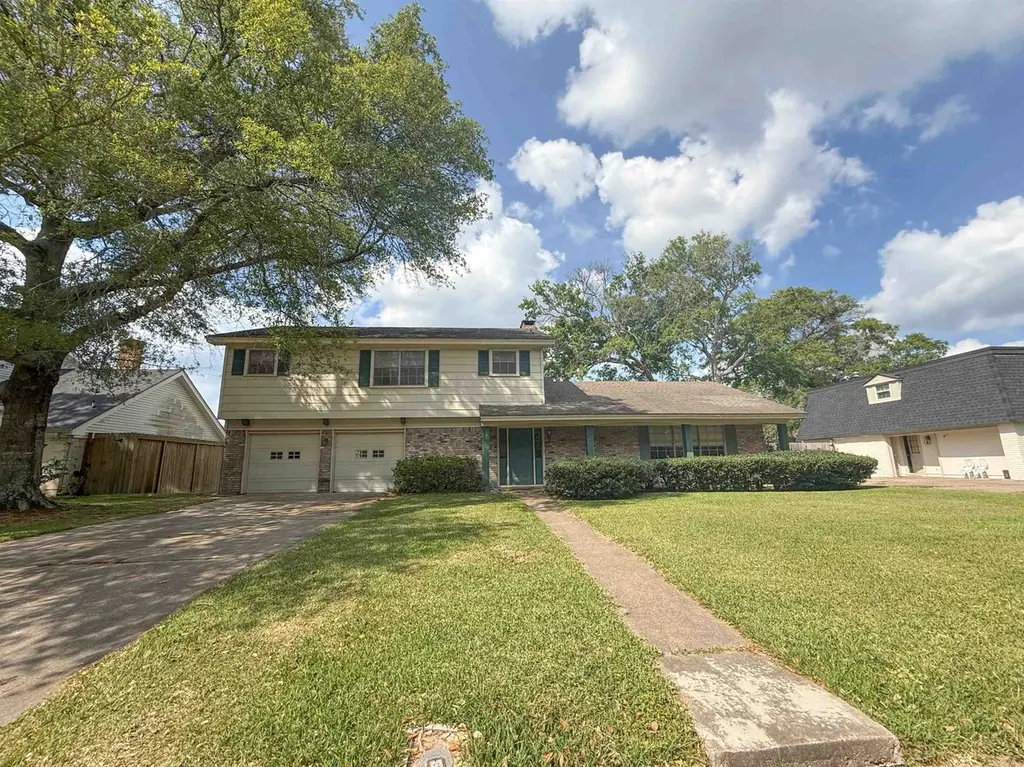
5970 Tangledahl Ln · Beaumont, TX
Flood risk 8/10 · Major
- FEMA flood zone
- X
- Chance of flooding over 30 yrs
- 0.99%
- Est. flood insurance / yr
- $507 – $1,088
Fire risk 1/10 · Minimal
- Est. fire insurance / yr
- $1,222 – $2,270
Heat risk 9/10 · Severe
- Hot days now (above 110°F)
- 7 days/yr
- Hot days in 30 yrs
- 24 days/yr
Wind risk 9/10 · Severe
- Chance of severe wind over 30 yrs
- 99.0%
Air-quality risk 2/10 · Minimal
- Unhealthy air days now
- 1 days/yr
- Unhealthy air days in 30 yrs
- 1 days/yr
Risk factors via First Street. Map © Google.
Why this score? — see what drove the B grade
The composite is a weighted blend of 9 inputs, each scored 0–100. Each bar is that input's sub-score; the figure is the points it added to the 100-point composite (weight × sub-score).
- Cash flow +27.2/30.0
- ARV discount +15.0/15.0
- DSCR +9.5/10.0
- 1% rule +9.4/10.0
- Livability +3.2/5.0
- Rent growth +2.7/5.0
- Condition / age +2.5/5.0
- Schools +1.5/10.0
- Appreciation +0.0/10.0
$159,700
🖨 Deal sheet 📄 Offer letter ✓ Due diligence
Listing remarks MLS
Spacious home full of potential in a nice location! Nestled in a quiet, well-established area just down the road from Regina Howell Schools, this property offers the perfect opportunity to make it your own. With generous living spaces and a functional layout, there’s plenty of room to update and customize to fit your vision. Venture outside to a big backyard—ideal for entertaining, gardening, or simply enjoying the outdoors. Whether you’re looking for your next home or an investment opportunity, this one has great bones and endless possibilities in a fantastic neighborhood!
Key facts
- Big backyard
- Functional layout
- 0.26 acre lot
Tags
Neighborhood map
What this means for you Summary
Snapshot
- This is a 4-bed/2.5-bath single-family listed at $160k.
Deal economics
- At list price, monthly cash flow is $391 ($5k/yr) — positive.
- The deal already cash-flows at list — no discount required.
- Meets the 1% rule at list price ($2k rent vs $160k).
- Recommended offer: $150k (6.0% below list) — sets the bar for market timing.
- Cap rate 9.7% vs local median 5.3% in Beaumont — top-decile yield for the area; either an underpriced asset or a hidden risk that comps aren't pricing in. Stress-test before assuming the spread holds.
Location & tenants
- Location reads 64/100 on livability (#739 in TX) — a middle-class / working-renter tenant base. Strengths: cost of living A+, housing A+, health & safety A+; Watch: employment D, schools D-, crime F.
- Beaumont ISD (urban): math 14% / reading 22% proficiency, ranked #789 of 826 in TX (top 96%) — low school quality limits family demand, transient renter base, plan for 1-2y turnover; 69% free/reduced lunch — lower-income household profile, screen leases tightly.
- Market conditions: Rents flat; 258 active listings in the ZIP; 14 comparable units currently listed for rent nearby; rentals at typical pace (median 24d on market — plan ~3-4 weeks tenant-placement turnaround); 343 units permitted in Jefferson County in 2024 (0 in 5+ unit buildings).
- This rent runs 38% of the median local income ($73k/yr) — at the standard rent-burdened threshold; future hikes will face affordability resistance.
Forward outlook
- Local home prices are declining (-3.0%/yr); year-one equity from $1k of loan paydown is wiped out by about $5k of value loss. Plan a longer hold.
Negotiation context
- It's been on market 66 days — a 6% lower offer ($150k) is reasonable based on typical stale-listing flexibility.
Risks & watch-outs
- Watch-outs: property tax is 3.4% of price; flood insurance adds $66/mo.
- Climate carrying-cost: severe flood risk; severe wind risk, 99% chance of damaging wind over 30y; extreme-heat days projected 7→24/yr by 2055 (HVAC capex compounding) — expect insurance premiums to compound above CPI over the hold.
Questions for the listing agent
- It's been on market 66 days. Have you received any prior offers? Is the seller open to a 6% concession, seller financing, or rate buy-down credit?
- Built in 1968 — when were the roof, HVAC, electrical panel, plumbing, and water heater last replaced?
- Property tax is high relative to price — has the assessment been appealed recently, and will the sale trigger a re-assessment?
- What's the actual annual flood-insurance premium (NFIP or private), and is the property in a SFHA with mandatory coverage?
- Why hasn't it sold? Are there any deal-killer items the seller is aware of (foundation, flood, title, zoning, code violations)?
- Is there a deadline driving the sale (1031 exchange, divorce, estate, relocation)? That informs how much negotiation room exists.
- Schools are D-rated, which usually means shorter tenancies and higher turnover. Who's the typical renter profile here, and what's been the actual vacancy rate?
- Crime grade is F in this area — have there been break-ins, vandalism, or insurance claims at this property in the last 3 years? What carrier currently insures it and at what premium?
- What's the average days-on-market for RENTAL listings here right now (not sales)? A rising rental-DOM trend means longer vacancies and softer asking-rent achievability than the comps imply.
- What's the recent tenant-quality profile in this submarket — average credit score on applications, eviction rate, late-payment / NSF rate, and stable-employment percentage? A property-management company in the area should have these aggregated.
- How much new for-sale + rental construction is in the pipeline within 1–3 miles? Heavy new supply typically softens prices + rents 12–24 months out; constrained supply supports both.
Investment metrics
- 1% rule
- 1.44% ✓
- Cap rate
- 9.73%
- Cash-on-cash
- 12.28%
- DSCR
- 1.55
- GRM
- 5.8
CMA / ARV
- ARV (median comp)
- $299,784
- List price
- $159,700
- Delta
- -46.73%
- Verdict
- UNDERPRICED
- Comps
- 20 within 1.0 mi
Show comp detail 8 sales within ~0.75 mi
| Address | Dist | Beds/Ba | Sqft | Sold | Price | $/sf | Match |
|---|---|---|---|---|---|---|---|
| 5755 Sul Ross Ln | 0.33mi | 4/2.0 | 2,447 (+3%) | 1mo | $256,500 | $105 | 77 |
| 6070 Pan St | 0.24mi | 4/2.5 | 2,477 (+4%) | 7mo | $330,000 | $133 | 76 |
| 1365 Sheridan Ln | 0.53mi | 4/2.5 | 2,343 (-1%) | 1mo | $289,900 | $124 | 73 |
| 6120 Pinkstaff Ln | 0.13mi | 4/2.5 | 2,617 (+10%) | 9mo | $315,000 | $120 | 69 |
| 1865 Rikisha Ln | 0.33mi | 3/2.0 (-1) | 2,186 (-8%) | 10mo | $192,500 | $88 | 56 |
| 5715 Dellwood Ln | 0.30mi | 3/2.5 (-1) | 2,286 (-4%) | 23mo | $289,000 | $126 | 56 |
| 4870 Teakwood Ln | 0.39mi | 3/2.0 (-1) | 2,369 (-0%) | 23mo | $265,000 | $112 | 55 |
| 5770 Derby Ln | 0.27mi | 4/2.0 | 2,038 (-14%) | 19mo | $268,900 | $132 | 46 |
Match score weights: distance 35% · size 25% · config 20% · recency 20%. Top-matched comps best support the ARV.
Projected returns pro-forma
-3.0% appreciation · 0.66% rent growth · sell at horizon
- IRR
- -3.7%
- Equity multiple
- 0.87×
- Total profit
- $-6,006
- Equity at exit
- $23,812
- IRR
- 2.5%
- Equity multiple
- 1.16×
- Total profit
- $7,134
- Equity at exit
- $13,808
Cash invested: $44,716 (down + closing). Projections, not guarantees.
Landlord ↔ Tenant lean methodology
- Overall (STATE)
- 87 Strongly Landlord-Friendly
- State Texas
- 87 Strongly Landlord-Friendly · R+5
- County
- — inherits STATE
- City
- — inherits STATE
ZIP-level market 77706
- Rents YoY
- 0.7%
- Active inventory
- 258
- Price-to-rent
- 5.8×
Monthly cashflow live
- Estimated rent
- $2,293 high interval (Pro) →
- Mortgage (P&I)
- −$837
- Tax from tax record
- −$449 /mo · $5,394/yr
- Insurance
- −$67
- Flood insurance flood zone
- −$66 /mo · $798/yr
- HOA
- −$0
- Vacancy / Maint / Mgmt
- −$481
- Net cashflow
- $391
Break-even live
UW: 25.0% down · 7.5% · 30yr · 1.5% tax · 5.0% vac · 8.0% maint · 8.0% mgmt
Financing live
Cash to close
- Down payment
- $39,925
- Closing costs
- $4,791
- Reserves months
- —
- Total cash needed
- —
Loan-product check · same deal, 3 products live
Conventional
25% down · 7.5% · 30yr
- Down + closing
- —
- Monthly P&I
- —
- Monthly cashflow
- —
- DSCR
- —
- Eligible?
- —
Personal DTI + credit; lowest rate.
DSCR
20% down · 8.5% · 30yr
- Down + closing
- —
- Monthly P&I
- —
- Monthly cashflow
- —
- DSCR
- —
- Eligible?
- —
No personal income docs; deal must DSCR.
Hard money
10% down · 12.0% · 12mo
- Down + closing
- —
- Monthly P&I
- —
- Monthly cashflow
- —
- DSCR
- —
- Eligible?
- —
Short-term bridge; refi at stabilization.
Rent comps 14 comps
| Address | Beds | Baths | Sqft | Rent | $/sqft | DOM | Units | Dist |
|---|---|---|---|---|---|---|---|---|
| 1510 Belvedere Dr Beaumont, TX | 4.0 | 2.5 | 2476 | $2,200 | $0.89 | 23d | 1 | 0.28mi |
| 930 Hibiscus Cir Beaumont, TX | 4.0 | 2.5 | 2639 | $2,950 | $1.12 | 14d | 1 | 0.58mi |
| 5875 Oleander Dr Beaumont, TX | 3.0 | 2.5 | 2595 | $2,500 | $0.96 | 44d | 1 | 0.62mi |
| 4740 Baywood Ln Beaumont, TX | 4.0 | 3.0 | 2548 | $2,495 | $0.98 | 23d | 1 | 0.63mi |
| 440 N Circuit Dr Beaumont, TX | 3.0 | 2.0 | 1946 | $2,150 | $1.10 | 23d | 1 | 0.93mi |
| 6795 Greenwood Dr Beaumont, TX | 3.0 | 2.0 | 1650 | $2,500 | $1.52 | 23d | 1 | 1.16mi |
| 770 Peyton Dr Beaumont, TX | 3.0 | 2.0 | 1769 | $1,895 | $1.07 | 44d | 1 | 1.20mi |
| 880 Lockwood Dr Beaumont, TX | 3.0 | 2.0 | 1819 | $1,995 | $1.10 | 44d | 1 | 1.22mi |
| 6286 Afton Ln Beaumont, TX | 3.0 | 2.5 | 2024 | $1,675 | $0.83 | 23d | 1 | 1.26mi |
| 1170 Brandywine St Beaumont, TX | 3.0 | 2.0 | 2100 | $1,890 | $0.90 | 23d | 1 | 1.32mi |
| 7 Stonebrook Ct Beaumont, TX | 5.0 | 3.5 | 3000 | $3,500 | $1.17 | 14d | 1 | 1.32mi |
| 1915 Sams Way Beaumont, TX | 3.0 | 2.0 | 1696 | $2,100 | $1.24 | 23d | 1 | 1.33mi |
| 5195 Oriole Dr Beaumont, TX | 3.0 | 2.0 | 1814 | $2,000 | $1.10 | 44d | 1 | 1.43mi |
| 3450 Durwood Dr Beaumont, TX | 3.0 | 2.0 | 1952 | $2,195 | $1.12 | 44d | 1 | 1.49mi |
Listing history 17 events
-
2026-06-18days on market $159,700 Active 66 DOM
-
2026-06-17days on market $159,700 Active 65 DOM
-
2026-06-16days on market $159,700 Active 64 DOM
-
2026-06-15days on market $159,700 Active 63 DOM
-
2026-06-14days on market $159,700 Active 61 DOM
-
2026-06-13days on market $159,700 Active 60 DOM
-
2026-06-10pricedays on market $159,700 Active 58 DOM
-
2026-06-09days on market $199,700 Active 57 DOM
-
2026-06-08days on market $199,700 Active 56 DOM
-
2026-06-07pricedays on market $199,700 Active 55 DOM
-
2026-06-03days on market $201,400 Active 51 DOM
-
2026-06-02days on market $201,400 Active 50 DOM
-
2026-06-01days on market $201,400 Active 49 DOM
-
2026-05-31days on market $201,400 Active 48 DOM
-
2026-05-30days on market $201,400 Active 47 DOM
-
2026-05-13price $201,400 598-char remark
Show marketing remark (598 chars)
Spacious home full of potential in a nice location! Nestled in a quiet, well-established area just down the road from Regina Howell Schools, this property offers the perfect opportunity to make it your own. With generous living spaces and a functional layout, there’s plenty of room to update and customize to fit your vision. Venture outside to a big backyard—ideal for entertaining, gardening, or simply enjoying the outdoors. Whether you’re looking for your next home or an investment opportunity, this one has great bones and endless possibilities in a fantastic neighborhood!
-
2026-04-14$212,000 Active 598-char remark
Show marketing remark (598 chars)
Spacious home full of potential in a nice location! Nestled in a quiet, well-established area just down the road from Regina Howell Schools, this property offers the perfect opportunity to make it your own. With generous living spaces and a functional layout, there’s plenty of room to update and customize to fit your vision. Venture outside to a big backyard—ideal for entertaining, gardening, or simply enjoying the outdoors. Whether you’re looking for your next home or an investment opportunity, this one has great bones and endless possibilities in a fantastic neighborhood!
ⓘ Source: listings_history table (triggers on properties + properties_extension) + one-shot
backfill from property_details.listing_events for pre-trigger history.
Tax reassessment forecast TX · Resets to sale price
- Current annual tax
- $5,394 · $449/mo
- Projected year-2 tax
- $5,394 · $449/mo
- Expected delta
- $0/yr ($0/mo · -0.0%)
ⓘ Screening estimate from a state-policy table — verify with the county assessor before closing.
Climate risk First Street
- Flood 8/10 Severe FEMA zone X · 99% chance over 30 yrs
- Wildfire 1/10 Low
- Heat 9/10 Extreme 7 d/yr ≥110°F today · 24 d/yr by 30 yrs out
- Wind 9/10 Extreme 99% chance of damaging wind over 30 yrs
- Air quality 2/10 Low 1 unhealthy d/yr today · 1 by 30 yrs out
Nearby sold comps map
Loading sold comps map…
Walkable amenities ~0.75 mi
Loading nearby amenities…
Taxation est. · year 1
- Rental income
- $27,512
- − Mortgage interest
- −$8,946
- − Property taxes
- −$5,394
- − Insurance
- −$1,596
- − Repairs & maintenance
- −$2,201
- − Management
- −$2,201
- − Depreciation
- −$4,646
- Taxable income
- $2,529
- Est. tax owed @ 24.0%
- −$607
- After-tax cash flow
- $4,088/yr
For passive investors: Depreciation is non-cash, so a rental often shows a tax loss while cash-flowing — sheltering income. Rental losses are passive: they offset passive income freely, and up to $25,000/yr can offset ordinary (W-2) income if you actively participate and your MAGI is under $100k (phasing out to $0 by $150k); unused losses carry forward. On sale, claimed depreciation is recaptured at up to 25%, and gains may owe capital-gains tax (a 1031 exchange can defer both). Figures are a year-1 estimate at your 24.0% rate — not tax advice; consult a CPA.
Schools (NCES district)
- District
- Beaumont ISD
- NCES district ID
- 4809670
- Math proficiency
- 14% ▼ -13.00%
- Reading proficiency
- 22% ▼ -7.00%
- Median HH income
- $41,683
- Composite
- 15.43/100
- National rank
- #9316
- State rank
- #789 of 826 in TX
Livability — Beaumont
- Score
- 64/100
- State rank
- #739
- US rank
- #13710
Category grades
Schools grade is shown separately in the Schools card above.
Census & demographics
- Census place
- Beaumont, TX
- County
- Jefferson County · 203,592 people
- City population
- 125,901
- Metro
- Beaumont-Port Arthur, TX
- Population (ZIP)
- 30,393
- Household income
- $73,185
- Rent vs Own
- Severe rent burden
- 1299.0
Population outlook (Jefferson County) Hauer SSP2
- Today (2025)
- 259,015 people
- By 2030
- 260,685 · +0.6%
- By 2040
- 263,309 · +1.7%
- By 2050
- 265,237 · +2.4%
- By 2075
- 270,193 · +4.3%
- By 2100
- 255,628 · -1.3%
Race, ethnicity, and origin ACS 2023
- Neighborhood character
- Diverse neighborhood (Simpson 0.61)
- Race & ethnicity
- White 56% Black 24% Hispanic / Latino 13% Two or more races 9% Asian 4%
- Hispanic origin (detail)
- Mexican 10%
- Common ancestry
- Lithuanian 4% Iranian 3% Slovak 2%
- Foreign-born
- 8% · Canada, China
- Languages at home
- 87% English-only · Spanish 8% Other Indo-European 2% German/W. Germanic 1%
Political lean MEDSL · Jefferson
- 2024 margin
- Lean R (+8.9) · D 45.1% · R 54.0%
- 2008→2024 swing
- -11.1pp toward R · 2008: 2.2pp · 2024: -8.9pp
- All cycles
- 2024: R+8.9 2020: R+1.6 2016: R+0.5 2012: D+1.6 2008: D+2.2
Not yet ingested
- Civics
- —
Market trends
- HPI YoY
- ▼ -180.53%
- Current HPI
- 159.4053
- Rent YoY
- ▲ 0.66%
- Metro
- Beaumont-Port Arthur, TX
- State GDP YoY
- ▲ 3.95%
- F500 in state
- 110
Industry mix (Fortune 500 HQ in TX)
| Industry | F500 HQs | Revenue |
|---|---|---|
| Energy | 16 | $1,198B |
|
||
| Technology | 5 | $198B |
|
||
| Engineering / Construction | 4 | $72B |
|
||
| Energy Services | 3 | $60B |
|
||
| Utilities | 3 | $41B |
|
||
| Healthcare | 2 | $330B |
|
||
Price history
-5.0% since first listed2 events — show timeline
- 2026-05-13 Price Changed $201,400 BBOR
- 2026-04-14 Listed $212,000 BBOR
Property tax history
+2.4%/yrLatest (2025): $5,394 · -0.8% YoY. Source: county tax records.
Cash-flow waterfall
monthlySold comps — $/sqft
last 12 mo · ≤1 miLoading sold comps…