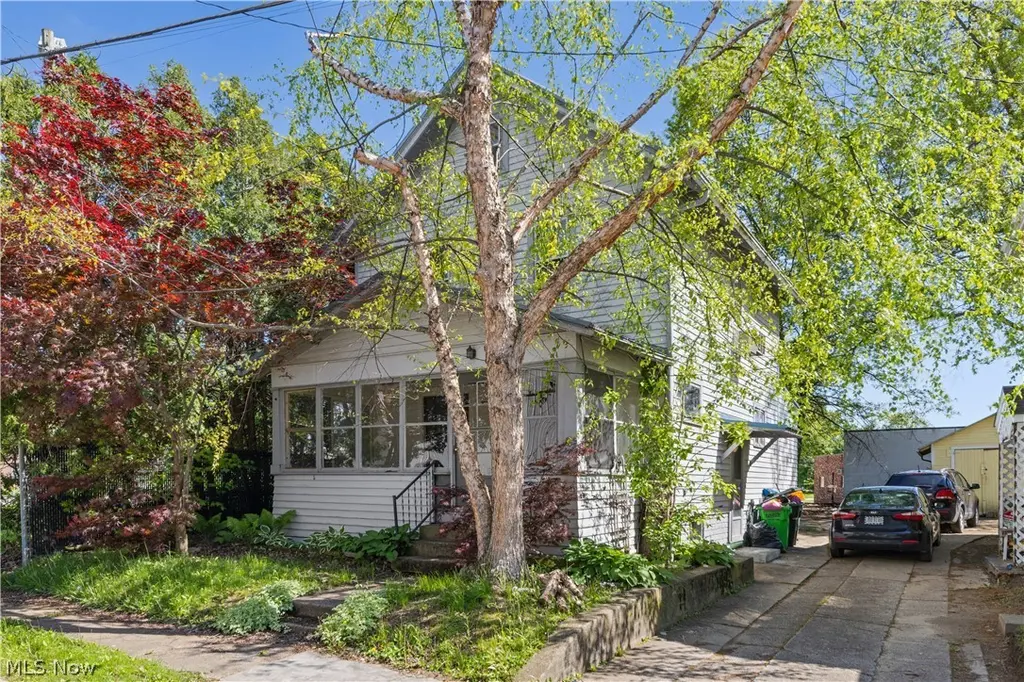
120 Ohio St · Wooster, OH
Flood risk 1/10 · Minimal
- FEMA flood zone
- X (unshaded)
- Chance of flooding over 30 yrs
- 0.0%
- Est. flood insurance / yr
- $473 – $860
Fire risk 1/10 · Minimal
- Est. fire insurance / yr
- $713 – $1,323
Heat risk 3/10 · Minor
- Hot days now (above 98°F)
- 7 days/yr
- Hot days in 30 yrs
- 17 days/yr
Wind risk 2/10 · Minimal
- Chance of severe wind over 30 yrs
- —
Air-quality risk 2/10 · Minimal
- Unhealthy air days now
- 0 days/yr
- Unhealthy air days in 30 yrs
- 1 days/yr
Risk factors via First Street. Map © Google.
Why this score? — see what drove the B+ grade
The composite is a weighted blend of 9 inputs, each scored 0–100. Each bar is that input's sub-score; the figure is the points it added to the 100-point composite (weight × sub-score).
- Cash flow +30.0/30.0
- ARV discount +15.0/15.0
- DSCR +10.0/10.0
- 1% rule +8.6/10.0
- Rent growth +4.6/5.0
- Schools +4.4/10.0
- Livability +3.9/5.0
- Condition / age +2.5/5.0
- Appreciation +0.0/10.0
$99,000
🖨 Deal sheet 📄 Offer letter ✓ Due diligence
Listing remarks
Priced to sell! Investment property with potential in the city of Wooster. Sells as-is, cash or conventional financing.
Key facts
- 3,354 sq ft lot
- Parking
- Built 1923
Property features AI
Finance
- Other: Property listed as fixer condition
Exterior
- Parking: Driveway
- Utilities: Public water; Public sewer
- Home design: Two-story house; Aluminum siding
- Construction: Built (year per public records); Asphalt/fiberglass roof
- Exterior features: Small lot (approximately 0.077 acres)
Interior
- Kitchen: First-floor kitchen; Breakfast nook adjacent to kitchen
- Bedrooms: Three upstairs bedrooms (each roughly 10 x 8–10)
- Bathrooms: One full bathroom; One half bathroom; One main-level bathroom
- Heating & cooling: Central air conditioning; Forced-air gas heating
- Interior features: Full unfinished basement
Neighborhood map
What this means for you Summary
Snapshot
- This is a 3-bed/1.5-bath single-family listed at $99k.
Deal economics
- At list price, monthly cash flow is $437 ($5k/yr) — positive.
- The deal already cash-flows at list — no discount required.
- Meets the 1% rule at list price ($1k rent vs $99k).
- Recommended offer: $98k (1.5% below list) — sets the bar for market timing.
- Cap rate 11.6% vs local median 3.2% in Wooster — top-decile yield for the area; either an underpriced asset or a hidden risk that comps aren't pricing in. Stress-test before assuming the spread holds.
Location & tenants
- Location reads 77/100 on livability (#195 in OH, #3,001 nationally) — a middle-class / working-renter tenant base. Strengths: cost of living A+, housing A+, health & safety A+; Watch: employment D+, amenities D-, commute F.
- Wooster City (town): math 47% / reading 57% proficiency, ranked #422 of 656 in OH (top 64%) — acceptable for families but not a draw, mixed tenant base, ~2y average lease.
- Market conditions: Rents rising fast (+8.4%/yr); 154 active listings in the ZIP; 3 comparable units currently listed for rent nearby; rentals lingering (median 44d on market — plan ~5-8 weeks vacancy on turnover, expect pricing pressure); 67% of comp listings sitting > 30 days — soft ceiling on asking rent; 284 units permitted in Wayne County in 2024 (42 in 5+ unit buildings).
Forward outlook
- Local home prices are declining (-3.0%/yr); year-one equity from $684 of loan paydown is wiped out by about $3k of value loss. Plan a longer hold.
- Wayne County population projected to shrink 6% by 2050 — rents likely to lag national; underwrite the cash flow, not the appreciation.
- At projected returns (-3.0% appreciation + 8.0% rent growth), your $28k cash investment doubles in ~6 years — after that, you're playing with house money.
Negotiation context
- It's been on market 15 days — a 2% lower offer ($98k) is reasonable based on typical stale-listing flexibility.
- 2 sale attempts since 3y ago with the ask held roughly flat each time — persistent listings suggest the price (not the market) is what's stuck; bring a comps-based counter.
- Current owner paid $40k; list at $99k implies a 148% gain — meaningful room to come down on a strong offer.
Risks & watch-outs
- Watch-outs: built in 1923 — expect roof / HVAC / electrical / plumbing capex.
Questions for the listing agent
- Built in 1923 — when were the roof, HVAC, electrical panel, plumbing, and water heater last replaced?
- Is there a deadline driving the sale (1031 exchange, divorce, estate, relocation)? That informs how much negotiation room exists.
- Schools are B-rated — typically a magnet for longer-tenancy family renters. What's the average tenant stay here, and is there a school-zone premium baked into asking?
- What's the average days-on-market for RENTAL listings here right now (not sales)? A rising rental-DOM trend means longer vacancies and softer asking-rent achievability than the comps imply.
- What's the recent tenant-quality profile in this submarket — average credit score on applications, eviction rate, late-payment / NSF rate, and stable-employment percentage? A property-management company in the area should have these aggregated.
- How much new for-sale + rental construction is in the pipeline within 1–3 miles? Heavy new supply typically softens prices + rents 12–24 months out; constrained supply supports both.
Investment metrics
- 1% rule
- 1.36% ✓
- Cap rate
- 11.58%
- Cash-on-cash
- 18.90%
- DSCR
- 1.84
- GRM
- 6.1
CMA / ARV
- ARV (median comp)
- $139,892
- List price
- $99,000
- Delta
- -29.23%
- Verdict
- UNDERPRICED
- Comps
- 20 within 1.0 mi
Show comp detail 12 sales within ~0.75 mi
| Address | Dist | Beds/Ba | Sqft | Sold | Price | $/sf | Match |
|---|---|---|---|---|---|---|---|
| 140 Ohio St | 0.03mi | 3/1.0 | 1,240 (-2%) | 2mo | $158,500 | $128 | 91 |
| 216 W Vine St | 0.08mi | 3/1.0 | 1,276 (+0%) | 13mo | $130,000 | $102 | 83 |
| 318 S Grant St | 0.17mi | 3/1.0 | 1,086 (-15%) | 4mo | $157,000 | $145 | 62 |
| 218 Clark Ave | 0.65mi | 3/1.0 | 1,260 (-1%) | 10mo | $190,000 | $151 | 58 |
| 1013 Old Columbus Rd | 0.50mi | 3/1.0 | 1,176 (-8%) | 10mo | $175,000 | $149 | 54 |
| 355 N Grant St | 0.59mi | 3/2.0 | 1,317 (+4%) | 14mo | $150,000 | $114 | 53 |
| 423 Emerick St | 0.63mi | 3/2.0 | 1,228 (-4%) | 13mo | $174,000 | $142 | 52 |
| 355 Saybolt Ave | 0.61mi | 3/1.0 | 1,191 (-6%) | 10mo | $155,000 | $130 | 50 |
| 412 Emerick St | 0.62mi | 3/1.5 | 1,152 (-9%) | 8mo | $206,700 | $179 | 49 |
| 566 N Walnut St | 0.75mi | 3/1.5 | 1,344 (+6%) | 10mo | $179,000 | $133 | 48 |
| 636 Saybolt Ave | 0.73mi | 4/1.0 (+1) | 1,364 (+7%) | 6mo | $190,000 | $139 | 42 |
| 330 Spink St | 0.71mi | 3/2.0 | 1,392 (+9%) | 13mo | $175,000 | $126 | 38 |
Match score weights: distance 35% · size 25% · config 20% · recency 20%. Top-matched comps best support the ARV.
Projected returns pro-forma
-3.0% appreciation · 8.0% rent growth · sell at horizon
- IRR
- 16.0%
- Equity multiple
- 1.68×
- Total profit
- $18,869
- Equity at exit
- $14,761
- IRR
- 27.9%
- Equity multiple
- 4.05×
- Total profit
- $84,596
- Equity at exit
- $8,560
Cash invested: $27,720 (down + closing). Projections, not guarantees.
Landlord ↔ Tenant lean methodology
- Overall (STATE)
- 73 Landlord-Friendly
- State Ohio
- 73 Landlord-Friendly · R+6
- County
- — inherits STATE
- City
- — inherits STATE
ZIP-level market 44691
- Rents YoY
- 8.4%
- Active inventory
- 154
- Price-to-rent
- 6.1×
Monthly cashflow live
- Estimated rent
- $1,348 medium interval (Pro) →
- Mortgage (P&I)
- −$519
- Tax from tax record
- −$68 /mo · $815/yr
- Insurance
- −$41
- HOA
- −$0
- Vacancy / Maint / Mgmt
- −$283
- Net cashflow
- $437
Break-even live
UW: 25.0% down · 7.5% · 30yr · 1.5% tax · 5.0% vac · 8.0% maint · 8.0% mgmt
Financing live
Cash to close
- Down payment
- $24,750
- Closing costs
- $2,970
- Reserves months
- —
- Total cash needed
- —
Loan-product check · same deal, 3 products live
Conventional
25% down · 7.5% · 30yr
- Down + closing
- —
- Monthly P&I
- —
- Monthly cashflow
- —
- DSCR
- —
- Eligible?
- —
Personal DTI + credit; lowest rate.
DSCR
20% down · 8.5% · 30yr
- Down + closing
- —
- Monthly P&I
- —
- Monthly cashflow
- —
- DSCR
- —
- Eligible?
- —
No personal income docs; deal must DSCR.
Hard money
10% down · 12.0% · 12mo
- Down + closing
- —
- Monthly P&I
- —
- Monthly cashflow
- —
- DSCR
- —
- Eligible?
- —
Short-term bridge; refi at stabilization.
Rent comps 3 comps
| Address | Beds | Baths | Sqft | Rent | $/sqft | DOM | Units | Dist |
|---|---|---|---|---|---|---|---|---|
| 240 1/2 E Bowman St Wooster, OH | 2.0 | 1.0 | 1040 | $855 | $0.82 | 43d | 1 | 0.83mi |
| 554 Northwestern Ave Wooster, OH | 3.0 | 1.0 | 948 | $1,250 | $1.32 | 43d | 1 | 0.91mi |
| 825 Gasche St Wooster, OH | 3.0 | 1.0 | 1224 | $1,350 | $1.10 | 23d | 1 | 1.18mi |
Listing history 7 events
-
2026-05-13$99,000 Active 119-char remark
-
2023-10-03historical
-
2023-08-21price $115,000
-
2023-08-10price $129,900
-
2023-08-01$135,000 Active
-
2022-02-07soldstatus $40,000
-
1997-11-17soldstatus $58,000
ⓘ Source: listings_history table (triggers on properties + properties_extension) + one-shot
backfill from property_details.listing_events for pre-trigger history.
Tax reassessment forecast OH · Partial reset (capped growth)
- Current annual tax
- $815 · $68/mo
- Projected year-2 tax
- $1,180 · $98/mo
- Expected delta
- +$364/yr (+$30/mo · 44.7%)
ⓘ Screening estimate from a state-policy table — verify with the county assessor before closing.
Climate risk First Street
- Flood 1/10 Low FEMA zone X (unshaded) · 0% chance over 30 yrs
- Wildfire 1/10 Low
- Heat 3/10 Moderate 7 d/yr ≥98°F today · 17 d/yr by 30 yrs out
- Wind 2/10 Low
- Air quality 2/10 Low 0 unhealthy d/yr today · 1 by 30 yrs out
Nearby sold comps map
Loading sold comps map…
Walkable amenities ~0.75 mi
Loading nearby amenities…
Taxation est. · year 1
- Rental income
- $16,175
- − Mortgage interest
- −$5,546
- − Property taxes
- −$815
- − Insurance
- −$495
- − Repairs & maintenance
- −$1,294
- − Management
- −$1,294
- − Depreciation
- −$2,880
- Taxable income
- $3,851
- Est. tax owed @ 24.0%
- −$924
- After-tax cash flow
- $4,314/yr
For passive investors: Depreciation is non-cash, so a rental often shows a tax loss while cash-flowing — sheltering income. Rental losses are passive: they offset passive income freely, and up to $25,000/yr can offset ordinary (W-2) income if you actively participate and your MAGI is under $100k (phasing out to $0 by $150k); unused losses carry forward. On sale, claimed depreciation is recaptured at up to 25%, and gains may owe capital-gains tax (a 1031 exchange can defer both). Figures are a year-1 estimate at your 24.0% rate — not tax advice; consult a CPA.
Schools (NCES district)
- District
- Wooster City
- NCES district ID
- 3910032
- Math proficiency
- 47% ▼ -24.00%
- Reading proficiency
- 57% ▼ -11.00%
- Median HH income
- $43,805
- Composite
- 43.82/100
- National rank
- #2928
- State rank
- #422 of 656 in OH
Livability — Wooster
- Score
- 77/100
- State rank
- #195
- US rank
- #3001
Category grades
Schools grade is shown separately in the Schools card above.
Census & demographics
- Census place
- Wooster, OH
- County
- Wayne County · 44,344 people
- City population
- 44,344
- Metro
- Wooster, OH
- Population (ZIP)
- 44,344
- Household income
- $69,920
- Rent vs Own
- Severe rent burden
- 844.0
Population outlook (Wayne County) Hauer SSP2
- Today (2025)
- 116,616 people
- By 2030
- 116,214 · -0.3%
- By 2040
- 113,891 · -2.3%
- By 2050
- 109,009 · -6.5%
- By 2075
- 94,622 · -18.9%
- By 2100
- 70,577 · -39.5%
Race, ethnicity, and origin ACS 2023
- Neighborhood character
- Predominantly White (90%)
- Race & ethnicity
- White 90% Two or more races 5% Hispanic / Latino 2% Black 2% Asian 1%
- Common ancestry
- Romanian 3% Slovak 3% Lithuanian 2%
- Foreign-born
- 4% · Canada
- Languages at home
- 92% English-only · German/W. Germanic 3% Spanish 1% Other Indo-European 1%
Political lean MEDSL · Wayne
- 2024 margin
- Solid R (+39.3) · D 29.9% · R 69.2%
- 2008→2024 swing
- -24.6pp toward R · 2008: -14.6pp · 2024: -39.3pp
- All cycles
- 2024: R+39.3 2020: R+37.0 2016: R+34.9 2012: R+21.3 2008: R+14.6
Not yet ingested
- Civics
- —
Market trends
- HPI YoY
- ▼ -174.13%
- Current HPI
- 231.7627
- Rent YoY
- ▲ 8.42%
- Metro
- Wooster, OH
- State GDP YoY
- ▲ 1.98%
- F500 in state
- 48
Industry mix (Fortune 500 HQ in OH)
| Industry | F500 HQs | Revenue |
|---|---|---|
| Insurance | 3 | $145B |
|
||
| Industrial Machinery | 3 | $49B |
|
||
| Financial Services | 3 | $24B |
|
||
| Consumer Goods | 2 | $93B |
|
||
| Aerospace / Defense | 2 | $47B |
|
||
| Utilities | 2 | $33B |
|
||
Price history
+70.7% since first listed8 events — show timeline
- 2026-05-28 Pending — MLSNOW
- 2026-05-13 Listed $99,000 MLSNOW
- 2023-10-03 Listing Removed — MLSNOW
- 2023-08-21 Price Changed $115,000 MLSNOW
- 2023-08-10 Price Changed $129,900 MLSNOW
- 2023-08-01 Listed $135,000 MLSNOW
- 2022-02-07 Sold (Public Records) $40,000 Public Records
- 1997-11-17 Sold (Public Records) $58,000 Public Records
Property tax history
-0.5%/yrLatest (2025): $815 · -0.4% YoY. Source: county tax records.
Cash-flow waterfall
monthlySold comps — $/sqft
last 12 mo · ≤1 miLoading sold comps…