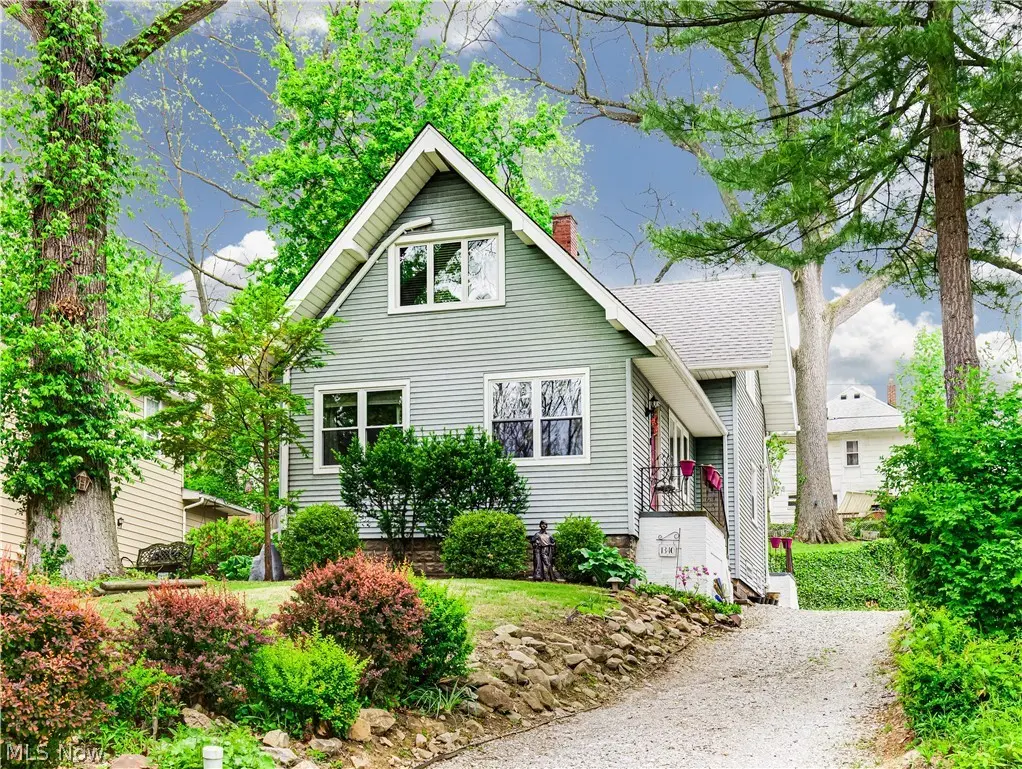
1340 Front St · Cuyahoga Falls, OH
Flood risk 1/10 · Minimal
- FEMA flood zone
- X (unshaded)
- Chance of flooding over 30 yrs
- 0.0%
- Est. flood insurance / yr
- $473 – $860
Fire risk 1/10 · Minimal
- Est. fire insurance / yr
- $713 – $1,323
Heat risk 3/10 · Minor
- Hot days now (above 97°F)
- 7 days/yr
- Hot days in 30 yrs
- 16 days/yr
Wind risk 1/10 · Minimal
- Chance of severe wind over 30 yrs
- —
Air-quality risk 3/10 · Minor
- Unhealthy air days now
- 2 days/yr
- Unhealthy air days in 30 yrs
- 4 days/yr
Risk factors via First Street. Map © Google.
Why this score? — see what drove the D grade
The composite is a weighted blend of 9 inputs, each scored 0–100. Each bar is that input's sub-score; the figure is the points it added to the 100-point composite (weight × sub-score).
- Cash flow +13.7/30.0
- ARV discount +7.6/15.0
- Schools +4.5/10.0
- DSCR +4.2/10.0
- Rent growth +4.2/5.0
- Livability +4.2/5.0
- 1% rule +3.8/10.0
- Condition / age +2.5/5.0
- Appreciation +0.0/10.0
$175,000
🖨 Deal sheet (PDF) 📄 Offer letter ✓ Due diligence
Listing remarks
This Gorgeous Cape Cod nestled among the trees is the perfect place to relax and unwind! A large living room with streaming natural light, stone fireplace and original woodwork welcomes you into this spacious main level. The dining room features coffered ceiling, updated wet bar and direct access to the back deck for entertaining. The fully applianced kitchen includes a walk-in pantry and ample cabinet space. Second level boasts 3 bedrooms with original hardwood floors and an updated full bathroom! The outdoor space is like something out of a book with terraced back yard and whimsy landscaping. Call today for a list of notable improvements and to schedule your tour!
Key facts
- 0.26 acre lot
- Parking
- Built 1916
Property features AI
Exterior
- Parking: Driveway
- Utilities: Public water; Public sewer
- Home design: 2 stories; Vinyl siding; Asphalt/fiberglass roof
- Construction: Built (year source: public records)
- Exterior features: Private yard; Deck; Shed(s); Partial fencing
Interior
- Kitchen: Dishwasher; Range; Microwave; Refrigerator; Pantry
- Bedrooms: Total rooms: 6
- Bathrooms: 1 full bathroom
- Heating & cooling: Hot water heating; Steam heating; Ductless cooling; Ceiling fans
- Interior features: Coffered ceilings; Open floor plan; Pantry; Bar; Natural woodwork; Full basement
- Laundry & utility: Washer and dryer in basement
Neighborhood map
What this means for you Summary
Snapshot
- This is a 3-bed/1.5-bath single-family listed at $175k.
Deal economics
- At list price, monthly cash flow is $14 ($173/yr) — positive.
- The deal already cash-flows at list — no discount required.
- To meet the 1% rule (rent ≥ 1% of price), the offer needs to be $155k (11.6% below list).
- Recommended offer: $155k (11.6% below list) — sets the bar for 1% rule.
- Cap rate 6.4% vs local median 4.5% in Cuyahoga Falls — top-decile yield for the area; either an underpriced asset or a hidden risk that comps aren't pricing in. Stress-test before assuming the spread holds.
Location & tenants
- Location reads 83/100 on livability (#60 in OH, #870 nationally) — a professional / high-income tenant draw. Strengths: cost of living A+, housing A+, health & safety A+; Watch: commute F.
- Cuyahoga Falls City (suburban): math 47% / reading 58% proficiency, ranked #408 of 656 in OH (top 62%) — acceptable for families but not a draw, mixed tenant base, ~2y average lease.
- Zoned schools: Gordon Dewitt Elementary School (math 62% / reading 67%, grade B, #522 of 1,584 statewide, top 36%, 344 students, 54% FRL); Bolich Middle School (math 38% / reading 48%, grade D-, #489 of 654 statewide, top 75%, 542 students, 52% FRL); Cuyahoga Falls High School (math 32% / reading 63%, grade D, #432 of 781 statewide, top 56%, 1,247 students, 39% FRL).
- Market conditions: Rents rising fast (+7.0%/yr); 92 active listings in the ZIP; 18 comparable units currently listed for rent nearby; rentals at typical pace (median 26d on market — plan ~3-4 weeks tenant-placement turnaround); 44% of comp listings sitting > 30 days — soft ceiling on asking rent; 1,114 units permitted in Summit County in 2024 (397 in 5+ unit buildings).
Forward outlook
- Local home prices are declining (-3.0%/yr); year-one equity from $1k of loan paydown is wiped out by about $5k of value loss. Plan a longer hold.
- Summit County population projected to shrink 6% by 2050 — rents likely to lag national; underwrite the cash flow, not the appreciation.
Negotiation context
- Only 8 days on market — expect competitive offers; lowballing is unlikely to land.
Risks & watch-outs
- Watch-outs: built in 1916 — expect roof / HVAC / electrical / plumbing capex.
Questions for the listing agent
- Built in 1916 — when were the roof, HVAC, electrical panel, plumbing, and water heater last replaced?
- Is there a deadline driving the sale (1031 exchange, divorce, estate, relocation)? That informs how much negotiation room exists.
- Schools are A-rated — typically a magnet for longer-tenancy family renters. What's the average tenant stay here, and is there a school-zone premium baked into asking?
- The area grade is low — what's the realistic commute time and amenity access for the typical tenant pool here? Any planned neighborhood developments (good or bad) we should know about?
- What's the average days-on-market for RENTAL listings here right now (not sales)? A rising rental-DOM trend means longer vacancies and softer asking-rent achievability than the comps imply.
- What's the recent tenant-quality profile in this submarket — average credit score on applications, eviction rate, late-payment / NSF rate, and stable-employment percentage? A property-management company in the area should have these aggregated.
- How much new for-sale + rental construction is in the pipeline within 1–3 miles? Heavy new supply typically softens prices + rents 12–24 months out; constrained supply supports both.
Investment metrics
- 1% rule
- 0.88% ✗
- Cap rate
- 6.39%
- Cash-on-cash
- 0.35%
- DSCR
- 1.02
- GRM
- 9.4
CMA / ARV
- ARV (median comp)
- $175,275
- List price
- $175,000
- Delta
- -0.16%
- Verdict
- FAIR
- Comps
- 20 within 1.0 mi
Show comp detail 12 sales within ~0.75 mi
| Address | Dist | Beds/Ba | Sqft | Sold | Price | $/sf | Match |
|---|---|---|---|---|---|---|---|
| 1764 10th St | 0.60mi | 3/1.5 | 1,308 (+2%) | 3mo | $249,000 | $190 | 66 |
| 714 Grant Ave | 0.35mi | 3/1.0 | 1,144 (-11%) | 2mo | $190,000 | $166 | 62 |
| 1353 Gorge Blvd | 0.64mi | 3/1.0 | 1,218 (-5%) | 3mo | $158,500 | $130 | 57 |
| 1642 10th St | 0.46mi | 4/2.0 (+1) | 1,408 (+10%) | 1mo | $230,000 | $163 | 55 |
| 1745 14th St | 0.71mi | 2/1.5 (-1) | 1,332 (+4%) | 1mo | $245,000 | $184 | 55 |
| 1101 Linden Ave | 0.62mi | 3/1.0 | 1,186 (-8%) | 2mo | $111,000 | $94 | 55 |
| 1105 Linden Ave | 0.61mi | 3/1.0 | 1,144 (-11%) | 2mo | $59,900 | $52 | 50 |
| 1156 Clifton Ave | 0.51mi | 3/2.0 | 1,460 (+14%) | 2mo | $140,000 | $96 | 49 |
| 946 Falls Ave | 0.75mi | 2/2.0 (-1) | 1,230 (-4%) | 3mo | $209,900 | $171 | 49 |
| 1300 Mount Vernon Ave | 0.52mi | 2/1.0 (-1) | 1,100 (-14%) | 1mo | $117,000 | $106 | 44 |
| 1652 14th St | 0.63mi | 2/2.0 (-1) | 1,136 (-12%) | 2mo | $195,000 | $172 | 43 |
| 1616 Union St | 0.72mi | 2/1.0 (-1) | 1,100 (-14%) | 2mo | $160,000 | $145 | 34 |
Match score weights: distance 35% · size 25% · config 20% · recency 20%. Top-matched comps best support the ARV.
Projected returns pro-forma
-3.0% appreciation · 6.95% rent growth · sell at horizon
- IRR
- -11.4%
- Equity multiple
- 0.57×
- Total profit
- $-21,026
- Equity at exit
- $26,093
- IRR
- 2.8%
- Equity multiple
- 1.23×
- Total profit
- $11,420
- Equity at exit
- $15,131
Cash invested: $49,000 (down + closing). Projections, not guarantees.
Landlord ↔ Tenant lean methodology
- Overall (STATE)
- 73 Landlord-Friendly
- State Ohio
- 73 Landlord-Friendly · R+6
- County
- — inherits STATE
- City
- — inherits STATE
ZIP-level market 44221
- Rents YoY
- 7.0%
- Active inventory
- 92
- Price-to-rent
- 9.4×
Monthly cashflow live
- Estimated rent
- $1,547 high interval (Pro) →
- Mortgage (P&I)
- −$918
- Tax from tax record
- −$217 /mo · $2,605/yr
- Insurance
- −$73
- HOA
- −$0
- Lot rent
- −$0
- Vacancy / Maint / Mgmt
- −$325
- Net cashflow
- $14
Break-even live
Sensitivity live
| Price | -10% $113 | -5% $64 | +0% $14 | +5% $-35 | +10% $-85 |
|---|---|---|---|---|---|
| Rent | -10% $-108 | -5% $-47 | +0% $14 | +5% $76 | +10% $137 |
| Rate | -1.0pp $103 | -0.5pp $59 | base $14 | +0.5pp $-31 | +1.0pp $-77 |
UW: 25.0% down · 7.5% · 30yr · 1.5% tax · 5.0% vac · 8.0% maint · 8.0% mgmt
Financing live
Cash to close
- Down payment
- $43,750
- Closing costs
- $5,250
- Reserves months
- —
- Total cash needed
- —
Loan-product check · same deal, 3 products live
Conventional
25% down · 7.5% · 30yr
- Down + closing
- —
- Monthly P&I
- —
- Monthly cashflow
- —
- DSCR
- —
- Eligible?
- —
Personal DTI + credit; lowest rate.
DSCR
20% down · 8.5% · 30yr
- Down + closing
- —
- Monthly P&I
- —
- Monthly cashflow
- —
- DSCR
- —
- Eligible?
- —
No personal income docs; deal must DSCR.
Hard money
10% down · 12.0% · 12mo
- Down + closing
- —
- Monthly P&I
- —
- Monthly cashflow
- —
- DSCR
- —
- Eligible?
- —
Short-term bridge; refi at stabilization.
Rent comps 18 comps
| Address | Beds | Baths | Sqft | Rent | $/sqft | DOM | Units | Dist |
|---|---|---|---|---|---|---|---|---|
| 1522 Campbell St Unit 2 Cuyahoga Falls, OH | 2.0 | 1.0 | 900 | $1,300 | $1.44 | 23d | 1 | 0.40mi |
| 467 Lynn Dr Cuyahoga Falls, OH | 3.0 | 1.0 | 1414 | $1,600 | $1.13 | 16d | 1 | 0.66mi |
| 1823 7th St Cuyahoga Falls, OH | 3.0 | 1.5 | 1248 | $2,850 | $2.28 | 46d | 1 | 0.66mi |
| 1180 Murray Ave Akron, OH | 3.0 | 2.0 | 1340 | $1,175 | $0.88 | 23d | 1 | 0.66mi |
| 1088 Lexington Ave Akron, OH | 3.0 | 1.0 | 1008 | $1,600 | $1.59 | 16d | 1 | 0.68mi |
| 539 E Cuyahoga Falls Ave Unit 1 Akron, OH | 2.0 | 1.0 | 1000 | $895 | $0.90 | 25d | 1 | 0.73mi |
| 1928 3rd St Unit 4 Cuyahoga Falls, OH | 2.0 | 1.0 | 1150 | $1,300 | $1.13 | 46d | 1 | 0.81mi |
| 1832 15th St Cuyahoga Falls, OH | 3.0 | 1.0 | 1000 | $1,495 | $1.50 | 25d | 1 | 0.87mi |
| 1059 Jean Ave Akron, OH | 3.0 | 1.0 | 1012 | $1,300 | $1.28 | 46d | 1 | 0.98mi |
| 1390 N Howard St Akron, OH | 2.0 | 1.0 | 1000 | $1,000 | $1.00 | 46d | 1 | 1.02mi |
| 255 Portage Trl Cuyahoga Falls, OH | 2.0 | 2.0 | 1650 | $1,725 | $1.05 | 16d | 1 | 1.04mi |
| 1791 Windsor St Cuyahoga Falls, OH | 3.0 | 1.0 | 1120 | $1,929 | $1.72 | 16d | 1 | 1.27mi |
| 1975 Tudor St Cuyahoga Falls, OH | 3.0 | 1.0 | 1120 | $1,475 | $1.32 | 46d | 1 | 1.28mi |
| 1276 Bailey Rd Cuyahoga Falls, OH | 3.0 | 2.0 | 1188 | $1,800 | $1.52 | 46d | 1 | 1.30mi |
| 2220 High St Cuyahoga Falls, OH | 1.0–2.0 | 1.0–2.0 | 870 | $1,215 | $1.40 | 16d | 1 | 1.41mi |
| 649 Patterson Ave Unit a Akron, OH | 2.0 | 1.0 | 1000 | $775 | $0.78 | 46d | 1 | 1.41mi |
| 649 Patterson Ave Unit B Akron, OH | 3.0 | 1.0 | 1200 | $900 | $0.75 | 46d | 1 | 1.41mi |
| 825 Avon St Unit 1 Akron, OH | 2.0 | 1.0 | 960 | $875 | $0.91 | 23d | 1 | 1.48mi |
Listing history 2 events
-
2026-05-15status Pending 674-char remark
-
2026-05-07$175,000 Active 674-char remark
ⓘ Source: listings_history table (triggers on properties + properties_extension) + one-shot
backfill from property_details.listing_events for pre-trigger history.
Tax reassessment forecast OH · Partial reset (capped growth)
- Current annual tax
- $2,605 · $217/mo
- Projected year-2 tax
- $2,667 · $222/mo
- Expected delta
- +$63/yr (+$5/mo · 2.4%)
ⓘ Screening estimate from a state-policy table — verify with the county assessor before closing.
Climate risk First Street
- Flood 1/10 Low FEMA zone X (unshaded) · 0% chance over 30 yrs
- Wildfire 1/10 Low
- Heat 3/10 Moderate 7 d/yr ≥97°F today · 16 d/yr by 30 yrs out
- Wind 1/10 Low
- Air quality 3/10 Moderate 2 unhealthy d/yr today · 4 by 30 yrs out
Nearby sold comps map
Loading sold comps map…
Walkable amenities ~0.75 mi
Loading nearby amenities…
Taxation est. · year 1
- Rental income
- $18,564
- − Mortgage interest
- −$9,803
- − Property taxes
- −$2,605
- − Insurance
- −$875
- − Repairs & maintenance
- −$1,485
- − Management
- −$1,485
- − Depreciation
- −$5,091
- Taxable loss
- −$2,780
- Est. tax savings @ 24.0%
- +$667
- After-tax cash flow
- $840/yr
For passive investors: Depreciation is non-cash, so a rental often shows a tax loss while cash-flowing — sheltering income. Rental losses are passive: they offset passive income freely, and up to $25,000/yr can offset ordinary (W-2) income if you actively participate and your MAGI is under $100k (phasing out to $0 by $150k); unused losses carry forward. On sale, claimed depreciation is recaptured at up to 25%, and gains may owe capital-gains tax (a 1031 exchange can defer both). Figures are a year-1 estimate at your 24.0% rate — not tax advice; consult a CPA.
Schools (NCES district)
- District
- Cuyahoga Falls City
- NCES district ID
- 3904383
- Math proficiency
- 47% ▼ -18.00%
- Reading proficiency
- 58% ▼ -7.00%
- Median HH income
- $49,587
- Composite
- 44.78/100
- National rank
- #2746
- State rank
- #408 of 656 in OH
Livability — Cuyahoga Falls
- Score
- 83/100
- State rank
- #60
- US rank
- #870
Category grades
Schools grade is shown separately in the Schools card above.
Census & demographics
- Census place
- Cuyahoga Falls, OH
- County
- Summit County · 440,783 people
- City population
- 47,005
- Metro
- Akron, OH
- Population (ZIP)
- 28,546
- Household income
- $63,342
- Rent vs Own
- Severe rent burden
- 1080.0
Population outlook (Summit County) Hauer SSP2
- Today (2025)
- 546,583 people
- By 2030
- 544,028 · -0.5%
- By 2040
- 531,363 · -2.8%
- By 2050
- 514,923 · -5.8%
- By 2075
- 481,765 · -11.9%
- By 2100
- 432,265 · -20.9%
Race, ethnicity, and origin ACS 2023
- Neighborhood character
- Predominantly White (81%)
- Race & ethnicity
- White 81% Asian 7% Black 5% Two or more races 5% Hispanic / Latino 2%
- Common ancestry
- Romanian 4% Lithuanian 2% Scotch-Irish 2%
- Foreign-born
- 7% · India, China, Canada
- Languages at home
- 90% English-only · Other Indo-European 6% Other Asian/Pacific 1% German/W. Germanic 1%
Political lean MEDSL · Summit
- 2024 margin
- Lean D (+7.0) · D 53.0% · R 46.0%
- 2008→2024 swing
- -9.6pp toward R · 2008: 16.6pp · 2024: 7.0pp
- All cycles
- 2024: D+7.0 2020: D+9.6 2016: D+8.2 2012: D+14.8 2008: D+16.6
Not yet ingested
- Civics
- —
Market trends
- HPI YoY
- ▼ -222.74%
- Current HPI
- 213.5428
- Rent YoY
- ▲ 6.95%
- Metro
- Akron, OH
- State GDP YoY
- ▲ 1.98%
- F500 in state
- 48
Industry mix (Fortune 500 HQ in OH)
| Industry | F500 HQs | Revenue |
|---|---|---|
| Insurance | 3 | $145B |
|
||
| Industrial Machinery | 3 | $49B |
|
||
| Financial Services | 3 | $24B |
|
||
| Consumer Goods | 2 | $93B |
|
||
| Aerospace / Defense | 2 | $47B |
|
||
| Utilities | 2 | $33B |
|
||
Price history
2 events — show timeline
- 2026-05-15 Pending — MLSNOW
- 2026-05-07 Listed $175,000 MLSNOW
Property tax history
+2.3%/yrLatest (2025): $2,605 · -1.8% YoY. Source: county tax records.
Cash-flow waterfall
monthlySold comps — $/sqft
last 12 mo · ≤1 miLoading sold comps…